


感知机二分类模型:𝑓(𝑥)=sign(𝑤⋅𝑥+𝑏)
最小化损失函数:
import pandas as pd
import numpy as np
from sklearn.datasets import load_iris
import matplotlib.pyplot as plt
加载数据集:
iris = load_iris()
iris:
‘target_names’: array([‘setosa’, ‘versicolor’, ‘virginica’]
‘feature_names’: [‘sepal length (cm)’, ‘sepal width (cm)’, ‘petal length (cm)’, ‘petal width (cm)’]
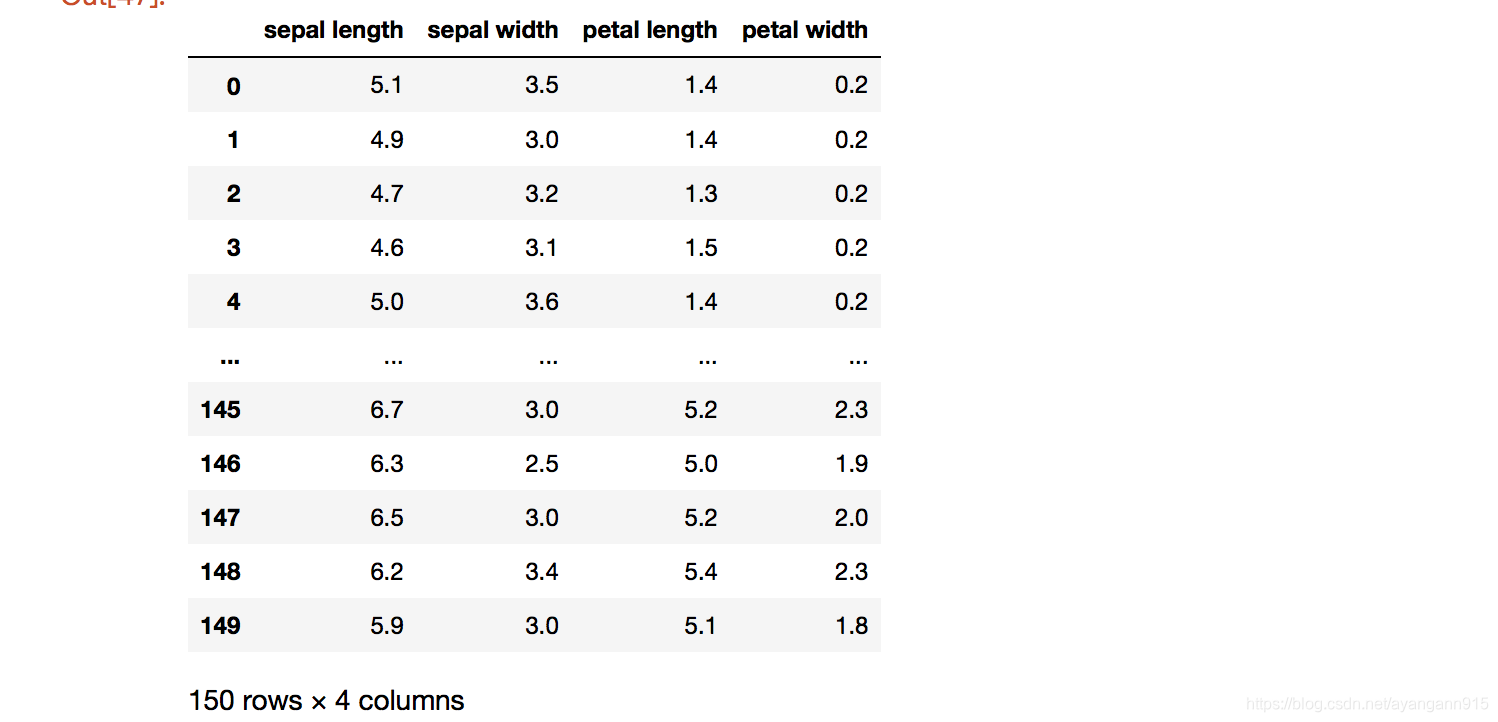
将数据以表格的形式展示:
df = pd.DataFrame(iris.data, columns=['sepal length', 'sepal width', 'petal length', 'petal width'])
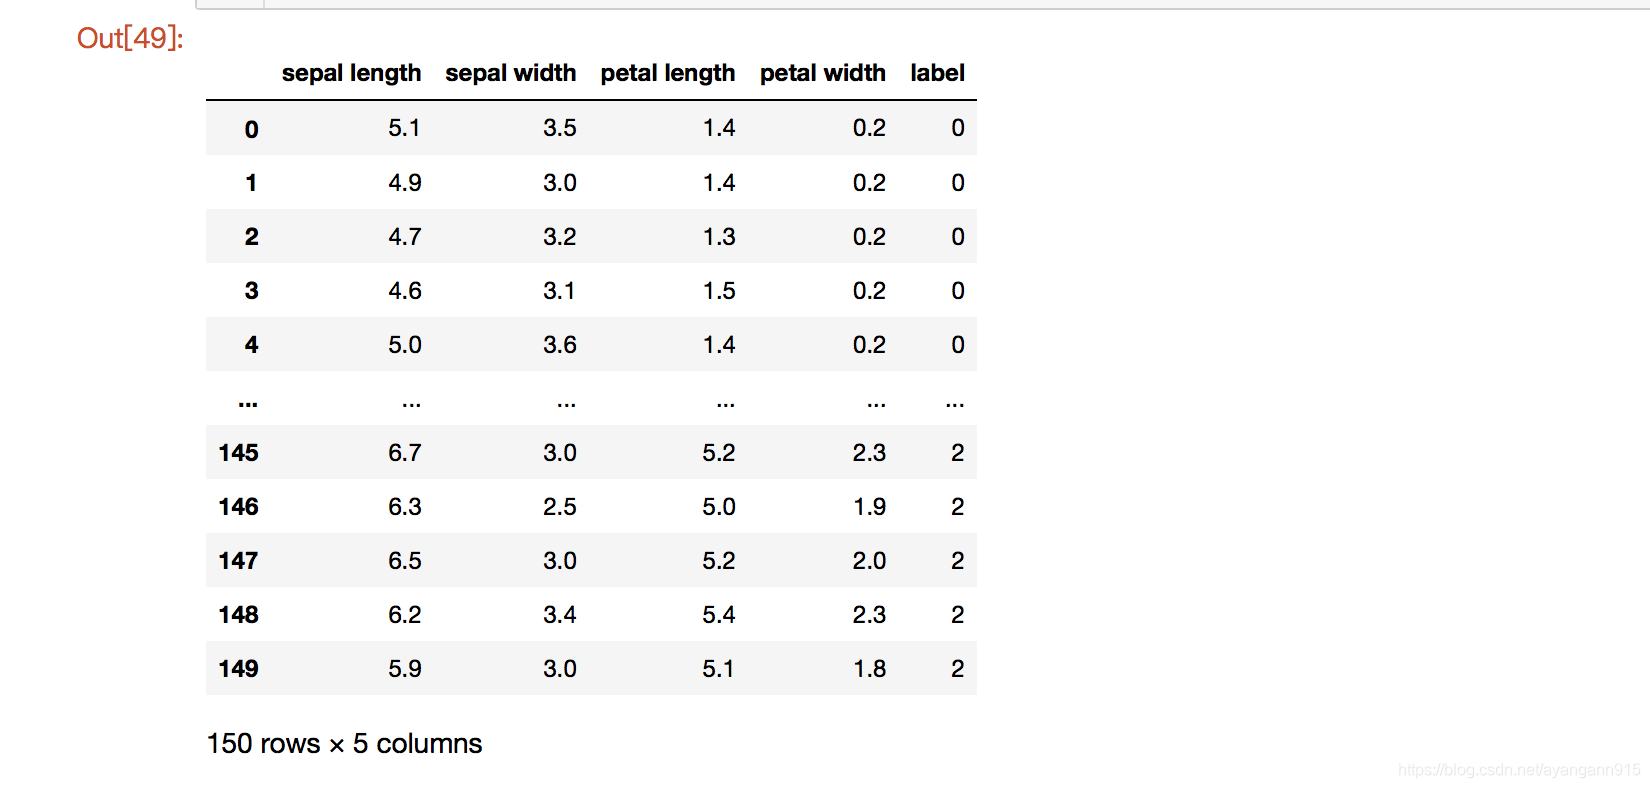
加上标签:
df['label'] = iris.target
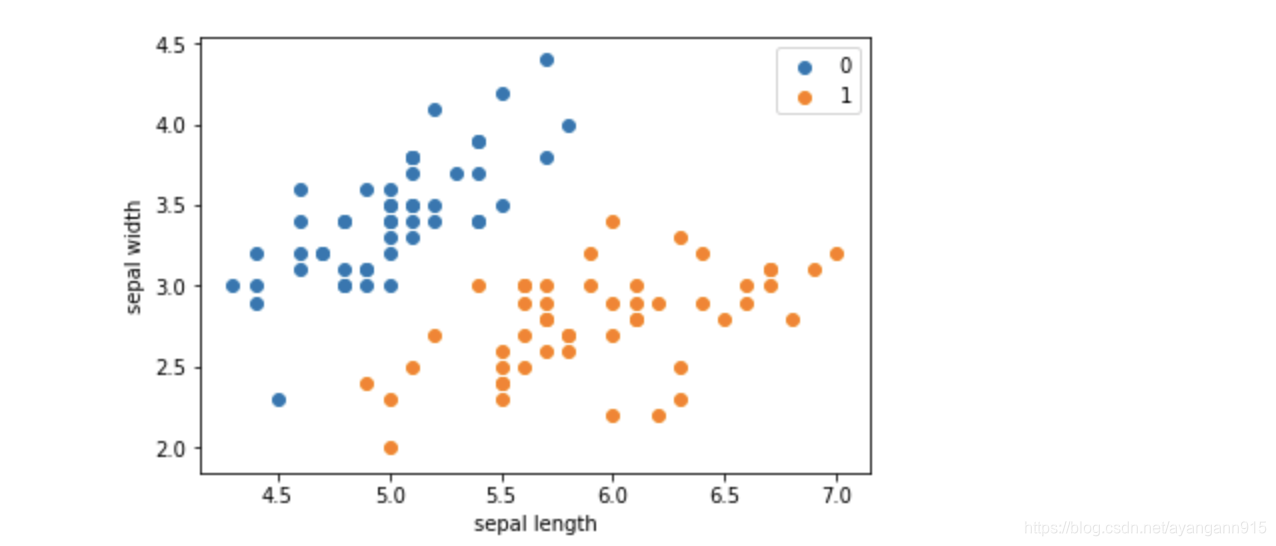
坐标图展示两类鸢尾花:
plt.scatter(df[:50]['sepal length'], df[:50]['sepal width'], label='0')
plt.scatter(df[50:100]['sepal length'], df[50:100]['sepal width'],label='1')
plt.xlabel("sepal length")
plt.ylabel("sepal width")
plt.legend()#显示图例
提取数据:
data = np.array(df.iloc[:100, [0,1,-1]])#提取前100行,第0,1 ,最后一列的数据
X, y = data[:, :-1], data[:, -1]#x取第0,1列的数据,y取最后一列的数据
y = np.array([1 if i == 1 else -1 for i in y])#将y的标签设置为1或者-1
感知机模型训练:
class Model:
    def __init__(self):
        self.w = np.ones(len(data[0])-1, dtype=np.float32)
        self.b = 0
        self.rate = 0.1

    def sign(self, x, w, b):
        y = np.dot(x, w) + b
        return y

    def fit(self, X_train, y_train):
        is_wrong = False
        while not is_wrong:
            wrong_count = 0
            for d in range(len(X_train)):
                x = X_train[d]
                y = y_train[d]
                if y * self.sign(x, self.w, self.b) <=0 :
                    self.w = self.w + self.rate * np.dot(y,x)
                    self.b = self.b + self.rate * y
                    wrong_count +=1
            if wrong_count == 0 :
                is_wrong = True
        return "success"
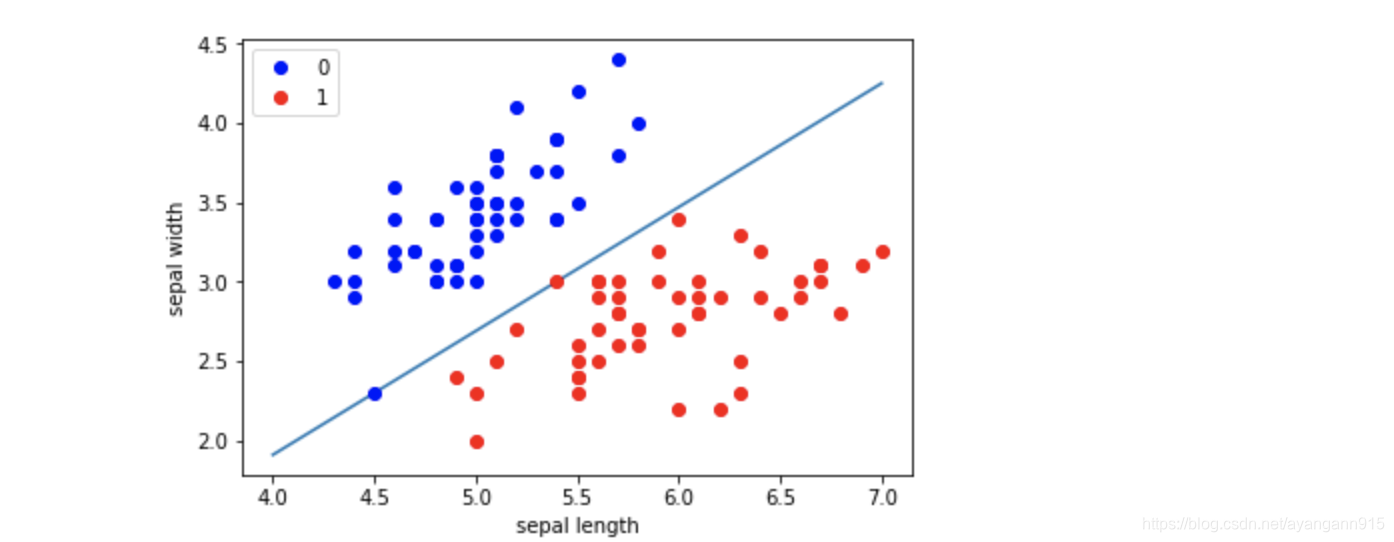
结果:
perceptron = Model()
perceptron.fit(X, y)

x = np.linspace(4,7,10)
y = -(perceptron.w[0] * x + perceptron.b) / perceptron.w[1]
plt.plot(x,y)

plt.plot(data[:50,0],data[:50,1], 'bo', color="blue", label="0")
plt.plot(data[50:100,0],data[50:100,1], 'bo',color="red", label="1")
plt.xlabel("sepal length")
plt.ylabel("sepal width")
plt.legend()


 5299
5299


 被折叠的 条评论
为什么被折叠?
被折叠的 条评论
为什么被折叠?
 到【灌水乐园】发言


