


Windows系统下MSVC编译器
debug模式
生成exe时自带生成pdb文件,所以无需处理pdb文件。
1.生成dump文件
通过修改注册表
增加注册表HKEY_LOCAL_MACHINE\SOFTWARE\Microsoft\Windows\Windows Error Reporting\LocalDumps
自己写封装一个函数,调用MiniDumpWriteDump函数实现。主动生成
在.pro文件中添加如下语句,来产生调试信息以及pdb文件
win32{
    QMAKE_CXXFLAGS_RELEASE = $$QMAKE_CFLAGS_RELEASE_WITH_DEBUGINFO
    QMAKE_LFLAGS_RELEASE = $$QMAKE_LFLAGS_RELEASE_WITH_DEBUGINFO
    LIBS += -lDbgHelp
}
#include "dialog.h"
#include <QApplication>
#include <QDateTime>
#include <QDebug>
#include <QDir>
static QString g_strDumpPath = "";
#ifdef Q_OS_WIN
#include <Windows.h> // Windows.h必须放在DbgHelp.h前,否则编译会报错
#include <DbgHelp.h>
LONG crashHandler(EXCEPTION_POINTERS *pException)
{
QString curDataTime = QDateTime::currentDateTime().toString("yyyyMMddhhmmss");
QString dumpName = g_strDumpPath + curDataTime + ".dmp";
HANDLE dumpFile = CreateFile((LPCWSTR)QString(dumpName).utf16(),GENERIC_WRITE, 0, NULL, CREATE_ALWAYS, FILE_ATTRIBUTE_NORMAL, NULL);
if(dumpFile != INVALID_HANDLE_VALUE)
{
MINIDUMP_EXCEPTION_INFORMATION dumpInfo;
dumpInfo.ExceptionPointers = pException;
dumpInfo.ThreadId = GetCurrentThreadId();
dumpInfo.ClientPointers = TRUE;
MiniDumpWriteDump(GetCurrentProcess(), GetCurrentProcessId(),dumpFile, MiniDumpNormal, &dumpInfo, NULL, NULL);
CloseHandle(dumpFile);
}
else
{
qDebug() << "dumpFile not vaild";
}
return EXCEPTION_EXECUTE_HANDLER;
}
//防止CRT(C runtime)函数报错可能捕捉不到
void DisableSetUnhandledExceptionFilter()
{
void* addr = (void*)GetProcAddress(LoadLibrary(L"kernel32.dll"), "SetUnhandledExceptionFilter");
if(addr)
{
unsigned char code[16];
int size = 0;
code[size++] = 0x33;
code[size++] = 0xC0;
code[size++] = 0xC2;
code[size++] = 0x04;
code[size++] = 0x00;
DWORD dwOldFlag, dwTempFlag;
VirtualProtect(addr, size, PAGE_READWRITE, &dwOldFlag);
WriteProcessMemory(GetCurrentProcess(), addr, code, size, NULL);
VirtualProtect(addr, size, dwOldFlag, &dwTempFlag);
}
}
#endif
int main(int argc, char *argv[])
{
QApplication a(argc, argv);
#ifdef Q_OS_WIN /// 创建dump
QString strdmpFile =QApplication::applicationDirPath();
strdmpFile = strdmpFile +"/testdump/";
g_strDumpPath = strdmpFile;
QDir dir(strdmpFile);
if(!dir.exists())
{
if (!dir.mkpath(strdmpFile))
qDebug() << QStringLiteral("创建dump文件目录失败");
}
SetUnhandledExceptionFilter((LPTOP_LEVEL_EXCEPTION_FILTER)crashHandler);
DisableSetUnhandledExceptionFilter();
#endif
Dialog w;
w.show();
return a.exec();
}
具体见:利用vs 分析DMP文件、pdb文件定位release下的异常崩溃_小飞侠hello的博客-CSDN博客_dmp文件 用vs 查看
使用第三方库QBreakpad
2.调试dump
使用vs调试dump
见:windows系统利用vs 分析DMP文件、pdb文件定位异常崩溃_dmp文件分析-CSDN博客
使用Windbg调试dump
a.配置Symbol file path(符号路径)、Source file path(源文件路径)、 Image File Path(可执行文件路径)。
b.执行命令 !analyze -v
符号路径:把生成的pdb文件所在目录及微软符号服务器加进去
源文件路径:源代码文件夹
可执行文件路径:可执行文件路径(这个选择具体的exe文件报错,只能选exe文件所在文件夹)
具体见:利用windbg分析程序崩溃生成的dmp文件_小飞侠hello的博客-CSDN博客_windbg分析dmp文件
Release模式
1.生成.pdb文件
release版本是不会自动生成pdb文件的。需要手动设置。
办法是:在pro文件中加入
QMAKE_CXXFLAGS_RELEASE = $$QMAKE_CFLAGS_RELEASE_WITH_DEBUGINFO
QMAKE_LFLAGS_RELEASE = $$QMAKE_LFLAGS_RELEASE_WITH_DEBUGINFO
2.其他步骤和debug一样,设置dump生成和使用windbg调试。
举例
MainWindow::MainWindow(QWidget *parent)
    : QMainWindow(parent)
{
    int *pa = new int[2];
    int *p = nullptr;
    *p = 1;

}
WARNING: Minidump contains unknown stream type 0x15
WARNING: Minidump contains unknown stream type 0x16
WARNING: Non-directory path: 'D:\study\qt\qt\build-test-Desktop_Qt_5_12_0_MSVC2017_32bit-Release\release\test.exe'
WARNING: Non-directory path: 'D:\study\qt\qt\build-test-Desktop_Qt_5_12_0_MSVC2017_32bit-Release\release\test.pdb'
Symbol search path is: D:\study\qt\qt\build-test-Desktop_Qt_5_12_0_MSVC2017_32bit-Release\release\test.pdb
Executable search path is: D:\study\qt\qt\build-test-Desktop_Qt_5_12_0_MSVC2017_32bit-Release\release\test.exe
Windows 7 Version 17134 MP (8 procs) Free x86 compatible
Product: WinNt, suite: SingleUserTS
Machine Name:
Debug session time: Fri Dec 30 15:45:10.000 2022 (UTC + 8:00)
System Uptime: 53 days 19:07:29.355
Process Uptime: 0 days 0:00:02.000
.................................................
*** ERROR: Symbol file could not be found. Defaulted to export symbols for ntdll.dll -
This dump file has an exception of interest stored in it.
The stored exception information can be accessed via .ecxr.
(11bdc.3a04): Access violation - code c0000005 (first/second chance not available)
eax=00000000 ebx=00000000 ecx=00000008 edx=00000000 esi=00000003 edi=00000003
eip=7726adac esp=0113f318 ebp=0113f4a8 iopl=0 nv up ei pl nz na pe nc
cs=0023 ss=002b ds=002b es=002b fs=0053 gs=002b efl=00000206
ntdll!NtWaitForMultipleObjects+0xc:
7726adac c21400 ret 14h
0:000> !analyze -v
*******************************************************************************
* *
* Exception Analysis *
* *
*******************************************************************************
*** ERROR: Symbol file could not be found. Defaulted to export symbols for kernel32.dll -
***** OS symbols are WRONG. Please fix symbols to do analysis.
*************************************************************************
*** ***
*** ***
*** Your debugger is not using the correct symbols ***
*** ***
*** In order for this command to work properly, your symbol path ***
*** must point to .pdb files that have full type information. ***
*** ***
*** Certain .pdb files (such as the public OS symbols) do not ***
*** contain the required information. Contact the group that ***
*** provided you with these symbols if you need this command to ***
*** work. ***
*** ***
*** Type referenced: ntdll!_PEB ***
*** ***
*************************************************************************
*************************************************************************
*** ***
*** ***
*** Your debugger is not using the correct symbols ***
*** ***
*** In order for this command to work properly, your symbol path ***
*** must point to .pdb files that have full type information. ***
*** ***
*** Certain .pdb files (such as the public OS symbols) do not ***
*** contain the required information. Contact the group that ***
*** provided you with these symbols if you need this command to ***
*** work. ***
*** ***
*** Type referenced: nt!IMAGE_NT_HEADERS32 ***
*** ***
*************************************************************************
*** ERROR: Symbol file could not be found. Defaulted to export symbols for ole32.dll -
Failed calling InternetOpenUrl, GLE=12029
FAULTING_IP:
test!MainWindow::MainWindow+54 [d:\study\qt\qt\test\mainwindow.cpp @ 8]
012410f4 c70001000000 mov dword ptr [eax],1
EXCEPTION_RECORD: ffffffff -- (.exr 0xffffffffffffffff)
ExceptionAddress: 012410f4 (test!MainWindow::MainWindow+0x00000054)
ExceptionCode: c0000005 (Access violation)
ExceptionFlags: 00000000
NumberParameters: 2
Parameter[0]: 00000001
Parameter[1]: 00000000
Attempt to write to address 00000000
PROCESS_NAME: test.exe
ADDITIONAL_DEBUG_TEXT:
Use '!findthebuild' command to search for the target build information.
If the build information is available, run '!findthebuild -s ; .reload' to set symbol path and load symbols.
MODULE_NAME: test
FAULTING_MODULE: 77200000 ntdll
DEBUG_FLR_IMAGE_TIMESTAMP: 63ae96ef
ERROR_CODE: (NTSTATUS) 0xc0000005 - 0x%p
EXCEPTION_CODE: (NTSTATUS) 0xc0000005 - 0x%p
EXCEPTION_PARAMETER1: 00000001
EXCEPTION_PARAMETER2: 00000000
WRITE_ADDRESS: 00000000
FOLLOWUP_IP:
test!MainWindow::MainWindow+54 [d:\study\qt\qt\test\mainwindow.cpp @ 8]
012410f4 c70001000000 mov dword ptr [eax],1
MOD_LIST: <ANALYSIS/>
FAULTING_THREAD: 00003a04
BUGCHECK_STR: APPLICATION_FAULT_NULL_POINTER_WRITE_WRONG_SYMBOLS
PRIMARY_PROBLEM_CLASS: NULL_POINTER_WRITE
DEFAULT_BUCKET_ID: NULL_POINTER_WRITE
LAST_CONTROL_TRANSFER: from 0124105c to 012410f4
STACK_TEXT:
0113fce8 0124105c 00000000 c6c81e4a 00000054 test!MainWindow::MainWindow+0x54 [d:\study\qt\qt\test\mainwindow.cpp @ 8]
0113fd28 012421b4 00000001 01552198 00000000 test!main+0x4c [d:\study\qt\qt\test\main.cpp @ 8]
0113fd5c 01241519 01240000 00000000 01533426 test!WinMain+0xe4 [c:\users\qt\work\qt\qtbase\src\winmain\qtmain_win.cpp @ 105]
0113fda8 758d8494 00fa4000 758d8470 0b417979 test!__scrt_common_main_seh+0xf8 [d:\agent\_work\3\s\src\vctools\crt\vcstartup\src\startup\exe_common.inl @ 288]
WARNING: Stack unwind information not available. Following frames may be wrong.
0113fdbc 772640e8 00fa4000 a44e8b37 00000000 kernel32!BaseThreadInitThunk+0x24
0113fe04 772640b8 ffffffff 7727f4ad 00000000 ntdll!RtlAreBitsSet+0x88
0113fe14 00000000 0124159d 00fa4000 00000000 ntdll!RtlAreBitsSet+0x58
STACK_COMMAND: ~0s; .ecxr ; kb
FAULTING_SOURCE_CODE:
4: : QMainWindow(parent)
5: {
6: int *pa = new int[2];
7: int *p = nullptr;
> 8: *p = 1;
9:
10: }
11:
12: MainWindow::~MainWindow()
13: {
SYMBOL_STACK_INDEX: 0
SYMBOL_NAME: test!MainWindow::MainWindow+54
FOLLOWUP_NAME: MachineOwner
IMAGE_NAME: test.exe
BUCKET_ID: WRONG_SYMBOLS
FAILURE_BUCKET_ID: NULL_POINTER_WRITE_c0000005_test.exe!MainWindow::MainWindow
WATSON_STAGEONE_URL: http://watson.microsoft.com/StageOne/test_exe/0_0_0_0/63ae96ef/test_exe/0_0_0_0/63ae96ef/c0000005/000010f4.htm?Retriage=1
Followup: MachineOwner
---------
Linux系统
在linux上默认的崩溃文件是core文件,但使用第三方库qbreakpad生成的崩溃文件是dump文件,所以下面分两种情况介绍。
core文件
QT程序在崩溃时生成内存镜像文件,windows下生成的叫dump文件,linux下生成的叫core文件.
生成core文件
1.在pro 配置添加 (好像不用配置也可以)
QMAKE_CC += -g

QMAKE_CXX += -g

QMAKE_LINK += -g
2.其他的步骤和一般的linux程序一样。都是 设置ulimit -c unlimited 、更改core文件、运行可执行程序生成core文件。参考:https://blog.csdn.net/baidu_16370559/article/details/128499174?csdn_share_tail=%7B"type"%3A"blog"%2C"rType"%3A"article"%2C"rId"%3A"128499174"%2C"source"%3A"baidu_16370559"%7D
调试core文件
前提条件:注意代码存放的目录位置,要和生成core文件目录时保持一致。
第一种办法:和一般linux程序一样,通过gdb调试。
调用 gdb 程序名 core文件名
或者分2步走
先gdb 可执行程序 再core-file core的名字
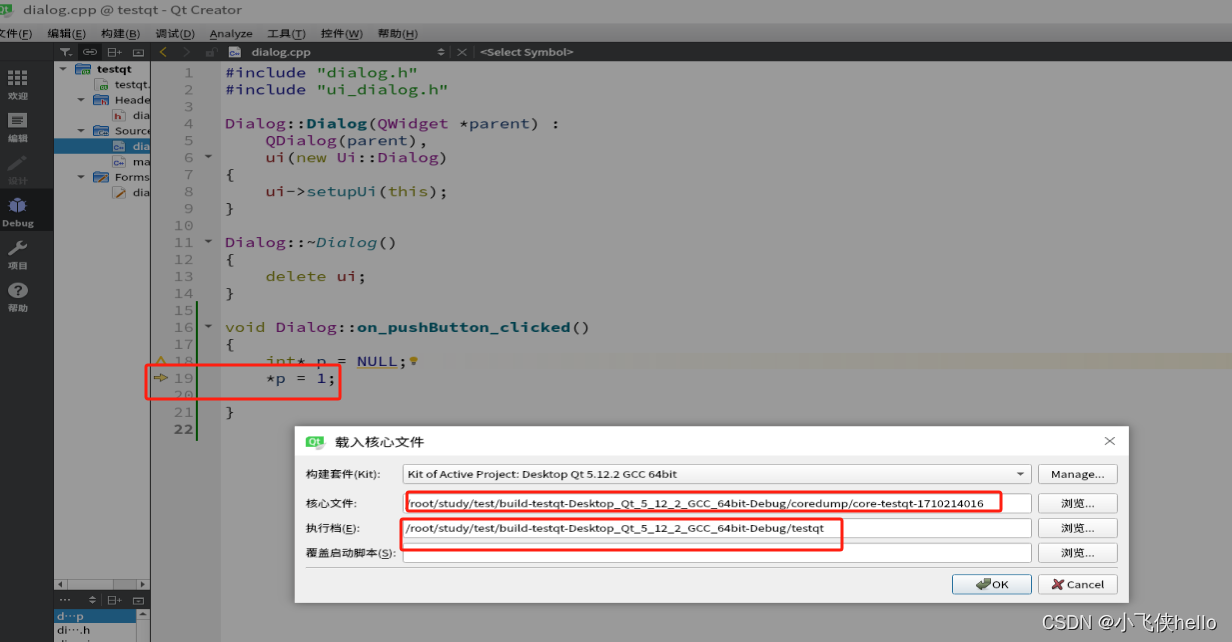
第二种办法:使用qt creator
前提条件:先用qt creator 打开源码
1、Debug->Start Debugging->Load Core File
2、在弹出的窗口选择对应的文件
3、点击OK,开始调试,会看到code里的信息
#-------------------------------------------------
#
# Project created by QtCreator 2022-12-28T12:46:54
#
#-------------------------------------------------

QT       += core gui

greaterThan(QT_MAJOR_VERSION, 4): QT += widgets

TARGET = test
TEMPLATE = app

# The following define makes your compiler emit warnings if you use
# any feature of Qt which as been marked as deprecated (the exact warnings
# depend on your compiler). Please consult the documentation of the
# deprecated API in order to know how to port your code away from it.
DEFINES += QT_DEPRECATED_WARNINGS

# You can also make your code fail to compile if you use deprecated APIs.
# In order to do so, uncomment the following line.
# You can also select to disable deprecated APIs only up to a certain version of Qt.
#DEFINES += QT_DISABLE_DEPRECATED_BEFORE=0x060000    # disables all the APIs deprecated before Qt 6.0.0


SOURCES += \
        main.cpp \
        mainwindow.cpp

HEADERS += \
        mainwindow.h


QMAKE_CC += -g
QMAKE_CXX += -g
QMAKE_LINK += -g


MainWindow::MainWindow(QWidget *parent)
    : QMainWindow(parent)
{
    int *px = (int*)malloc(8 * sizeof(int));
    px[9] = 0; //数组下标越界
    int *p1 = NULL;
    *p1 = 1;
    int a = 1;
}
gxrong@gxrong-virtual-machine:~/test/build-test-Desktop_Qt_5_9_0_GCC_64bit-Debug$ su root
密码:
root@gxrong-virtual-machine:/home/gxrong/test/build-test-Desktop_Qt_5_9_0_GCC_64bit-Debug# ulimit -c unlimited
root@gxrong-virtual-machine:/home/gxrong/test/build-test-Desktop_Qt_5_9_0_GCC_64bit-Debug# ./test
Qt: Session management error: None of the authentication protocols specified are supported
段错误 (核心已转储)
root@gxrong-virtual-machine:/home/gxrong/test/build-test-Desktop_Qt_5_9_0_GCC_64bit-Debug# gdb test /data/coredump/core.test.3630
GNU gdb (Ubuntu 8.1-0ubuntu3) 8.1.0.20180409-git
Copyright (C) 2018 Free Software Foundation, Inc.
License GPLv3+: GNU GPL version 3 or later <http://gnu.org/licenses/gpl.html>
This is free software: you are free to change and redistribute it.
There is NO WARRANTY, to the extent permitted by law. Type "show copying"
and "show warranty" for details.
This GDB was configured as "x86_64-linux-gnu".
Type "show configuration" for configuration details.
For bug reporting instructions, please see:
<http://www.gnu.org/software/gdb/bugs/>.
Find the GDB manual and other documentation resources online at:
<http://www.gnu.org/software/gdb/documentation/>.
For help, type "help".
Type "apropos word" to search for commands related to "word"...
Reading symbols from test...done.
[New LWP 3630]
[New LWP 3632]
[New LWP 3631]
[New LWP 3633]
[Thread debugging using libthread_db enabled]
Using host libthread_db library "/lib/x86_64-linux-gnu/libthread_db.so.1".
Core was generated by `./test'.
Program terminated with signal SIGSEGV, Segmentation fault.
#0 0x000055dd922103b1 in MainWindow::MainWindow (this=0x7ffd796bf9e0,
parent=0x0) at ../test/mainwindow.cpp:12
12 *p1 = 1;
[Current thread is 1 (Thread 0x7f5c09949780 (LWP 3630))]
(gdb)
qBreakpad库
见:


 7061
7061


 被折叠的 条评论
为什么被折叠?
被折叠的 条评论
为什么被折叠?
 到【灌水乐园】发言


