


Vue 使用 ElementUI 构建表格 --柚子真好吃
注:该文章内容在搭建好vue-cli的环境下进行。
文章代码参考:https://blog.csdn.net/liaoxuewu/article/details/81184821
一、安装Element
-
登录element官网查看教程:https://element-angular.faas.ele.me/guide/install
-
npm安装,找到自己的项目目录,如下图。

-
开启命令行进行安装
npm install element-ui -S -
在main.js中进行配置,代码如下
// The Vue build version to load with the `import` command
// (runtime-only or standalone) has been set in webpack.base.conf with an alias.
import Vue from 'vue'
import App from './App'
import router from './router'
import ElementUI from 'element-ui';
import 'element-ui/lib/theme-chalk/index.css';
Vue.config.productionTip = false

/* eslint-disable no-new */
Vue.use(ElementUI);

new Vue({
  el: '#app',
  router,
  components: { App },
  template: '<App/>'
})
二、前台代码
<div class="tableMain">
      <el-table :data="tableData" style="width: 100%">
        <el-table-column prop="id" label="ID" width="180">
        </el-table-column>
        <el-table-column prop="name" label="用户名" width="180">
        </el-table-column>
        <el-table-column prop="city" label="城市" width="180">
          <template scope="scope">
            <el-select v-model="scope.row.city" placeholder="请选择">
              <el-option v-for="item in cityList" :key="item.name" :label="item.name" :value="item.name">
              </el-option>
            </el-select>
          </template>
        </el-table-column>
        <el-table-column prop="address" label="地址">
        </el-table-column>
        <el-table-column label="操作">
          <template scope="scope">
            <el-button size="small" @click="handleEdit(scope.$index, scope.row)">编辑
            </el-button>
            <el-button size="small" type="danger" @click="handleDelete(scope.$index, scope.row)">删除
            </el-button>
          </template>
        </el-table-column>
      </el-table>
    </div>
数据可先自己定义,代码如下
export default {
  name:"basetable",
  data() {
    return {
      loading: true,
      tableData: [{
        id: '1001',
        name: 'Tom',
        region: '男',
        address: '猫窝',
        city: ''

      }, {
        id: '1002',
        name: 'Jerry',
        region: '女',
        address: '鼠洞',
        city: ''
      }, {
        id: '1003',
        name: 'Spike',
        region: '男',
        address: '狗窝',
        city: ''
      },],
      cityList: [
        { name: '猫窝' },
        { name: '鼠洞' },
        { name: '狗窝' },
      ],
      dialogFormVisible: false,
      formLabelWidth: '80px',
      }
注:属性名要一一对应上。
这样我们运行一下
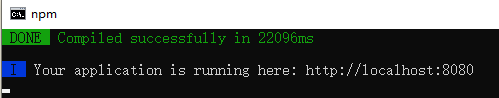
网页中运行的效果如下
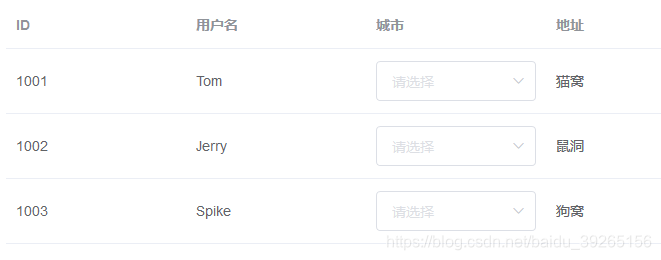
这样的话我们的数据就展示到表格中了。


 4168
4168


 被折叠的 条评论
为什么被折叠?
被折叠的 条评论
为什么被折叠?
 到【灌水乐园】发言


