


一 问题描述
今天测试组更新测试环境后发现系统卡顿,无法办理任何业务,重启系统后问题仍然存在。已经到项目后期,迭代测试时间十分紧张。此问题直接影响到项目进度
二 排查过程
1.查看进程资源占用情况
Linux 下常用top命令显示系统中各个进程的资源占用状况,查看资源发现PID26799进程信息中
CPU使用率达到了333%。详细信息如下
root@10.0.254.59 15:57:17 /data/jboss-4.2.3-9.0.0-8078/bin  # top
top - 16:01:10 up 241 days, 22:37,  6 users,  load average: 8.83, 3.23, 2.69
Tasks: 207 total,   1 running, 206 sleeping,   0 stopped,   0 zombie
%Cpu(s): 84.0 us,  0.7 sy,  0.0 ni, 15.2 id,  0.0 wa,  0.0 hi,  0.1 si,  0.0 st
KiB Mem : 16266800 total,   170440 free,  9203876 used,  6892484 buff/cache
KiB Swap:  4194300 total,  4066812 free,   127488 used.  6589968 avail Mem

  PID USER      PR  NI    VIRT    RES    SHR S  %CPU %MEM     TIME+ COMMAND
26799 root      20   0 8730000   4.6g  28024 S 333.0 29.9  11:09.94 java
27727 root      20   0 8728572   2.3g  36332 S   1.0 14.6  12:27.05 java
21841 root      20   0 5464404   1.6g  16284 S   0.7 10.2 145:29.47 java
    9 root      20   0       0      0      0 S   0.3  0.0  11:51.47 rcu_sched
13985 root      20   0  162148   2408   1588 R   0.3  0.0   0:00.01 top
24029 root      20   0  162856   3156   1608 S   0.3  0.0   0:45.30 top
    1 root      20   0  193640   4364   2832 S   0.0  0.0  19:42.60 systemd
    2 root      20   0       0      0      0 S   0.0  0.0   0:01.32 kthreadd
    3 root      20   0       0      0      0 S   0.0  0.0   0:28.28 ksoftirqd/0
2. 查看进程中占用线程情况
使用top -Hp命令查找该进程中CPU使用最高的线程,发现26801、26802、26803、28604线程CPU使用都达到了100%
root@10.0.254.59 16:01:15 /data/jboss-4.2.3-9.0.0-8078/bin  # top -Hp 26799
top - 16:01:25 up 241 days, 22:37,  6 users,  load average: 8.14, 3.35, 2.74
Threads: 553 total,   4 running, 549 sleeping,   0 stopped,   0 zombie
%Cpu(s): 98.5 us,  1.5 sy,  0.0 ni,  0.0 id,  0.0 wa,  0.0 hi,  0.0 si,  0.0 st
KiB Mem : 16266800 total,   169656 free,  9204352 used,  6892792 buff/cache
KiB Swap:  4194300 total,  4066812 free,   127488 used.  6589608 avail Mem

  PID USER      PR  NI    VIRT    RES    SHR S %CPU %MEM     TIME+ COMMAND
26801 root      20   0 8730000   4.6g  28024 R 99.9 29.9   1:06.08 java
26803 root      20   0 8730000   4.6g  28024 R 99.9 29.9   1:06.22 java
26804 root      20   0 8730000   4.6g  28024 R 99.9 29.9   1:06.30 java
26802 root      20   0 8730000   4.6g  28024 R 99.9 29.9   1:06.11 java
26799 root      20   0 8730000   4.6g  28024 S  0.0 29.9   0:00.00 java
26800 root      20   0 8730000   4.6g  28024 S  0.0 29.9   0:00.05 java
26805 root      20   0 8730000   4.6g  28024 S  0.0 29.9   0:08.64 java
26806 root      20   0 8730000   4.6g  28024 S  0.0 29.9   0:00.01 java
3. 获取进程的栈信息
使用jstack将PID26799进程的栈信息导出到临时文件以便分析
root@10.0.254.59 16:01:58 /data/jboss-4.2.3-9.0.0-8078/bin # jstack 26799 >pid26799.txt
4. 执行printf 将线程号格式化为16进制
26801、26802、26803、28604分别对应十六进制数068b1,、068b2、068b3、068b4
例如:
root@10.0.254.59 16:02:59 /data/jboss-4.2.3-9.0.0-8078/bin  # printf "0%x\n" 26802

068b2
5. 查找线程的栈信息
通过占用转换后的十六进制数去导出的pid26799.txt中查找栈信息。发现4个线程都是GC任务
"Reference Handler" #2 daemon prio=10 os_prio=0 tid=0x00007faef408e800 nid=0x68b6 in Object.wait() [0x00007faee1603000]
   java.lang.Thread.State: WAITING (on object monitor)
	at java.lang.Object.wait(Native Method)
	at java.lang.Object.wait(Object.java:502)
	at java.lang.ref.Reference.tryHandlePending(Reference.java:191)
	- locked <0x00000006c043d188> (a java.lang.ref.Reference$Lock)
	at java.lang.ref.Reference$ReferenceHandler.run(Reference.java:153)

"VM Thread" os_prio=0 tid=0x00007faef4085000 nid=0x68b5 runnable

"GC task thread#0 (ParallelGC)" os_prio=0 tid=0x00007faef4020000 nid=0x68b1 runnable

"GC task thread#1 (ParallelGC)" os_prio=0 tid=0x00007faef4022000 nid=0x68b2 runnable

"GC task thread#2 (ParallelGC)" os_prio=0 tid=0x00007faef4024000 nid=0x68b3 runnable

"GC task thread#3 (ParallelGC)" os_prio=0 tid=0x00007faef4025800 nid=0x68b4 runnable

"VM Periodic Task Thread" os_prio=0 tid=0x00007faef40d4800 nid=0x68bd waiting on condition
6.查看GC垃圾回收
发现YGC(年轻代回收次数) 和FGC(老年代垃圾回收次数) 都比较大,且YGCT(年轻代回收消耗时间) 和FGCT(老年代垃圾回收消耗时间)都比较长,说明系统因为GC才出现的卡顿现象。因为,在执行垃圾收集算法时,Java应用程序的其他所有线程都被挂起,在Java中的这个现象叫做Stop-The-World机制简称STW。 这是一种全局暂停现象。
root@10.0.254.59 16:05:45 /data/STARSMS/jboss-4.2.3-9.0.0-8078/bin  # jstat -gc 26799 5000
 S0C    S1C    S0U    S1U      EC       EU        OC         OU       MC     MU    CCSC   CCSU   YGC     YGCT    FGC    FGCT     GCT
200192.0 211456.0  0.0    0.0   919552.0 919552.0 2796544.0  2709387.4  180608.0 166270.8 22400.0 18766.9     61   17.137  33    394.263  411.400
200192.0 211456.0  0.0    0.0   919552.0 919552.0 2796544.0  2709387.4  180608.0 166270.8 22400.0 18766.9     61   17.137  33    394.263  411.400
200192.0 211456.0  0.0    0.0   919552.0 919552.0 2796544.0  2709387.2  180608.0 166292.3 22400.0 18766.9     61   17.137  34    409.916  427.052
200192.0 211456.0  0.0    0.0   919552.0 919552.0 2796544.0  2709387.2  180608.0 166292.3 22400.0 18766.9     61   17.137  34    409.916  427.052
200192.0 211456.0  0.0    0.0   919552.0 919552.0 2796544.0  2709387.2  180608.0 166292.3 22400.0 18766.9     61   17.137  34    409.916  427.052
200192.0 211456.0  0.0    0.0   919552.0 919552.0 2796544.0  2709236.9  180608.0 166306.0 22400.0 18769.6     61   17.137  35    426.082  443.219
200192.0 211456.0  0.0    0.0   919552.0 919552.0 2796544.0  2709236.9  180608.0 166306.0 22400.0 18769.6     61   17.137  35    426.082  443.219
200192.0 211456.0  0.0    0.0   919552.0 919552.0 2796544.0  2709236.9  180608.0 166306.0
7. 堆转储,分析dump.hprof 文件
先通过 arhtas 的heapdump命令得到hprof文件。( 参考:arthas)通过浏览器下载: http://localhost:8563/arthas-output/
[arthas@9312]$ heapdump arthas-output/dump.hprof
Dumping heap to arthas-output/dump.hprof ...
Heap dump file created 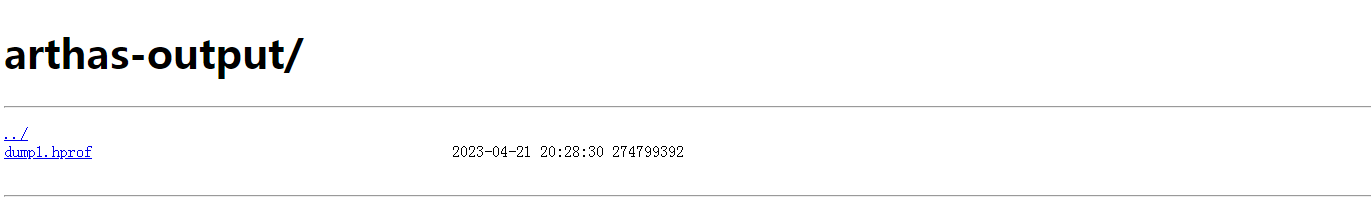
然后分析hprof文件, 分析方法有很多中我使用的是JDK自带的bin/jvisualvm.exe 分析
文件- 装入-选择下载的dump.hprof文件
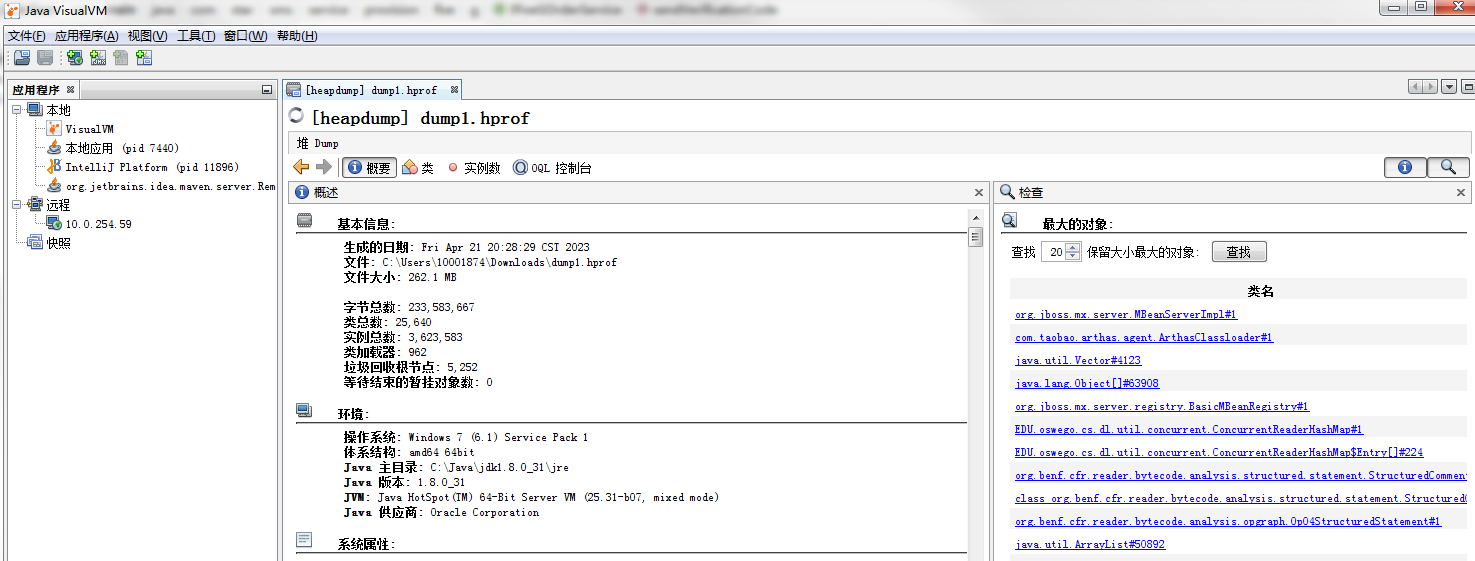
因为SWT时线程被挂起,所以泄露的程序应该有线程信息, 根据对象和线程栈发现了可疑程序
"autoArrivalTimeChangeQuartzSchedule_Worker-1" #361 prio=5 os_prio=0 tid=0x00007fae4419c800 nid=0x6e97 runnable [0x00007fae36f2d000]
   java.lang.Thread.State: RUNNABLE
	at java.text.DateFormatSymbols.<init>(DateFormatSymbols.java:145)
	at sun.util.locale.provider.DateFormatSymbolsProviderImpl.getInstance(DateFormatSymbolsProviderImpl.java:85)
	at java.text.DateFormatSymbols.getProviderInstance(DateFormatSymbols.java:364)
	at java.text.DateFormatSymbols.getInstance(DateFormatSymbols.java:340)
	at java.util.Calendar.getDisplayName(Calendar.java:2110)
	at java.text.SimpleDateFormat.subFormat(SimpleDateFormat.java:1125)
	at java.text.SimpleDateFormat.format(SimpleDateFormat.java:966)
	at java.text.SimpleDateFormat.format(SimpleDateFormat.java:936)
	at java.text.DateFormat.format(DateFormat.java:345)
	at com.star.sms.business.customer.job.GwNpDealContext.getDateList(GwNpDealContext.java:277)
8.分析线上代码
使用arhtas 的jad命令查看线上代码,发现275-279行提交的代码存在死循环。至此找到内存泄露代码
[arthas@9312]$ jad com.star.sms.business.customer.job.GwNpDealContext getDateList

ClassLoader:
+-org.eclipse.osgi.internal.baseadaptor.DefaultClassLoader@105c375d[stariboss-customer:1.0.0(id=130)]
  +-org.eclipse.osgi.baseadaptor.BaseAdaptor$1@d280fb

Location:
/E:/Jboss/jboss-4.2.3-9.0.0R1-8089-hebei-dev/server/default/tmp/stariboss_configuration/org.eclipse.osgi/bundles/130/1/bundlefile

        public List<String> getDateList(String startTime, String endTime, GwNpUserType type) {
            ArrayList<String> dateList = new ArrayList<String>();
/*246*/     SimpleDateFormat format = null;
/*247*/     int calendarField = 0;
/*248*/     if (type.equals((Object)GwNpUserType.HOR)) {
                format = new SimpleDateFormat("yyyyMMddHH");
/*250*/         calendarField = 11;
/*251*/     } else if (type.equals((Object)GwNpUserType.DAY)) {
                format = new SimpleDateFormat("yyyyMMdd");
/*253*/         calendarField = 5;
/*254*/     } else if (type.equals((Object)GwNpUserType.MONTH)) {
                format = new SimpleDateFormat("yyyyMM");
/*256*/         calendarField = 2;
            } else {
/*258*/         this.log.info((Object)"=====GwNpUserType is INVALID======");
/*259*/         return dateList;
            }
            try {
/*263*/         Date startTime1 = null;
/*264*/         Date endTime1 = null;
/*265*/         if (StringUtils.hasText((String)startTime)) {
/*266*/             startTime1 = format.parse(startTime);
/*267*/             endTime1 = format.parse(endTime.substring(0, startTime.length()));
                } else {
/*269*/             startTime = this.assigStartTime(startTime, calendarField);
/*270*/             startTime1 = DateFormatUtil.parseStrToDate4((String)startTime);
/*271*/             endTime1 = DateFormatUtil.parseStrToDate4((String)endTime);
                }
/*274*/         Calendar tempStart = Calendar.getInstance();
/*275*/         tempStart.setTime(startTime1);
                while (endTime1.getTime() >= startTime1.getTime()) {
/*277*/             dateList.add(format.format(startTime1));
/*279*/             startTime1 = tempStart.getTime();
                }
            }
            catch (Exception e) {
                // empty catch block
            }
/*284*/     return dateList;
        }
三 问题总结
本问题是因为开发提交了几行未经测试的代码引起, 此代码直接引起内存泄露,系统频繁GC。这也是提交未测试代码引起故障的典型案例。


 2万+
2万+


 被折叠的 条评论
为什么被折叠?
被折叠的 条评论
为什么被折叠?
 到【灌水乐园】发言


