


RSI:相对强弱指标
talib_rsi.py
# -*- coding: utf-8 -*-
import os, sys
import tushare as ts
import pandas as pd
import matplotlib.pyplot as plt
import numpy as np
import talib

if len(sys.argv) ==2:
    code = sys.argv[1]
else:
    print('usage: python talib_rsi.py stockcode ')
    sys.exit(1)

if len(code) !=6:
    print('stock code length: 6')
    sys.exit(2)

df = ts.get_k_data(code)
if df.empty ==True:
    print(" df is empty ")
    sys.exit(2)

df = df[ df['date'] > '2024-01-01']
if len(df) <15:
    print(" len(df) <15 ")
    sys.exit(2)

# DataFrame 重建索引
df = df.reset_index(drop=True)

# 求ma10日均线
df['ma10'] = df['close'].rolling(window=10).mean()
df.index = pd.to_datetime(df.date)
#dw = pd.DataFrame()
# RSI:相对强弱指标
df['rsi_6'] = talib.RSI(df.close, timeperiod=6)
df['rsi14'] = talib.RSI(df.close, timeperiod=14)
print("rsi_6={0:.1f} , rsi14={1:.1f}".format(df['rsi_6'][-1], df['rsi14'][-1]))
#print(df[ df['rsi_6'] > 80])
#print(df[ df['rsi_6'] < 20])

# RSI 超买 overbuy , 超卖 oversold
rsi_overbuy = df['rsi_6'] > 80
rsi_oversold= df['rsi_6'] < 20
df.loc[rsi_overbuy[(rsi_overbuy==True)&(rsi_overbuy.shift()==False)].index, 'overBuy']='oB'
df.loc[rsi_oversold[(rsi_oversold==True)&(rsi_oversold.shift()==False)].index, 'overSold']='oS'
#print(df[ df['overBuy']=='oB'])
#print(df[ df['overSold']=='oS'])

df = df.reset_index(drop=True)
# 取后半段
m = len(df) //2
df = df[ df.index > m ]
#print(df.head())
df.index = pd.to_datetime(df.date)
# 画股票收盘价图
fig,axes = plt.subplots(2,1)
df[['close', 'ma10']].plot(ax=axes[0], grid=True, title=code)
# 画 RSI 曲线图
df[['rsi_6', 'rsi14']].plot(ax=axes[1], grid=True)
plt.legend(loc='upper left', shadow=True)
plt.show()
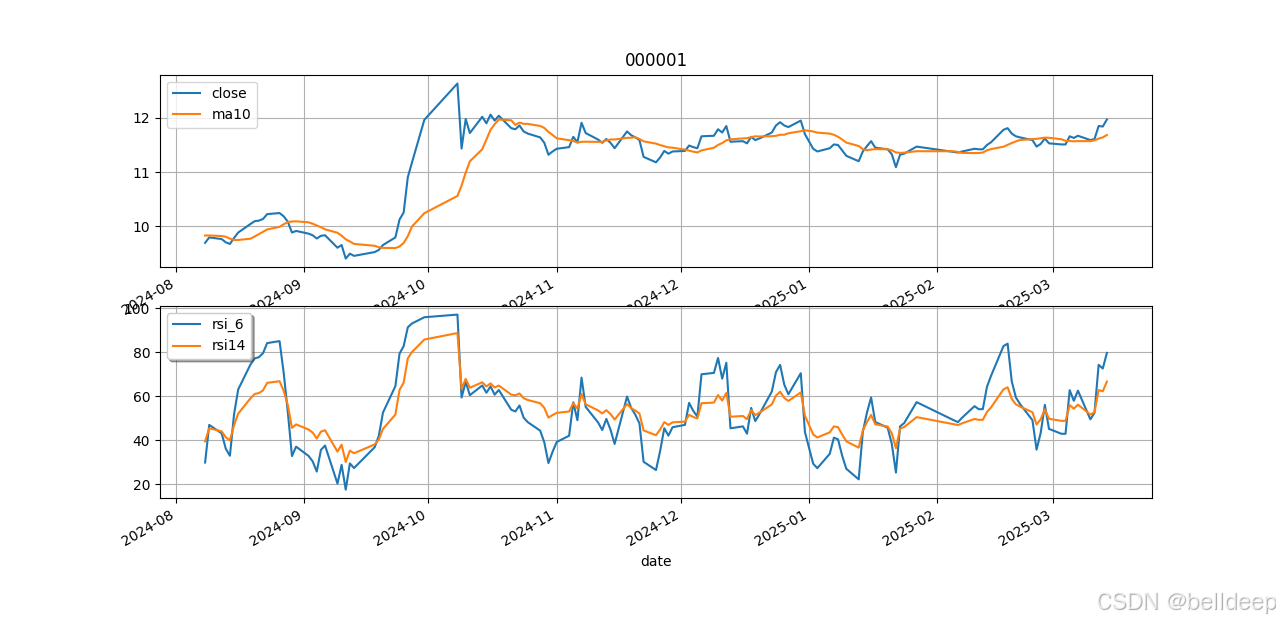
运行 python talib_rsi.py 000001


 9841
9841

 被折叠的 条评论
为什么被折叠?
被折叠的 条评论
为什么被折叠?
 到【灌水乐园】发言


