


配置actuator
采用jdk8
    <parent>
         <artifactId>spring-boot-starter-parent</artifactId>
         <groupId>org.springframework.boot</groupId>
         <version>2.3.12.RELEASE</version>
    </parent>

    <properties>
        <maven.compiler.source>8</maven.compiler.source>
        <maven.compiler.target>8</maven.compiler.target>
        <project.build.sourceEncoding>UTF-8</project.build.sourceEncoding>
        <spring-boot.version>3.2.1</spring-boot.version>
    </properties>

	<dependencies>
        <dependency>
            <groupId>org.springframework.boot</groupId>
            <artifactId>spring-boot-starter-actuator</artifactId>
        </dependency>

        <dependency>
            <groupId>org.springframework.boot</groupId>
            <artifactId>spring-boot-starter-web</artifactId>
        </dependency>
    </dependencies>
浏览器打开链接
GET localhost:8080/actuator
可以看到所有支持的连接
{
	"_links": {
		"self": {
			"href": "http://localhost:8080/actuator",
			"templated": false
		},
		"health-path": {
			"href": "http://localhost:8080/actuator/health/{*path}",
			"templated": true
		},
		"health": {
			"href": "http://localhost:8080/actuator/health",
			"templated": false
		}
	}
}
bean加载情况
http://localhost:8080/actuator/beans
具体使用方法
配置启用所有的监控端点,默认情况下,这些端点禁用
application.yml
management:
  endpoints:
    web:
      exposure:
        include: "*"
"*"代表启用所有的监控端点,
可以单独启用,例如:health,info,metrics
REST接口
分类:
原生端点:在应用程序里提供众多web接口
通过它们了解应用程序运行时的内部状况
又分成3类
应用配置类:可以查看应用在运行时的静态信息,例如自动配置信息m加载的springbean信息,yml文件配置信息,环境信息,请求映射信息
度量指标类:运行期的动态信息,例如堆栈,请求链,一些健康指标,metrics信息…
操作控制类:shutdown,用户可以发送一个请求将应用的监控功能关闭
用户自定义端点:主要是指扩展性
,用户可以根据自己的实际应用,定义一些比较关心的指标,
在运行期进行监控
命令详解
actuator只开放/actuator/health和/actuator/info
可以在配置文件中设置打卡全部
management:
  endpoints:
    web:
      exposure:
        include: "*"
也可以选择打开部分:
management:
  endpoints:
    web:
      exposure:
        exclude: beans
Actuator默认所有的监控点路径都在/actuator/*
如果有需要这个路径也支持定制
management:
  endpoints:
    web:
      exposure:
        exclude: beans
      base-path: /manage
GET localhost:8080/manage
health命令
检查应用的运行状态
默认health状态是开放的
GET localhost:8080/actuator/health
{
	"status": "UP"
}
要查看详细的应用健康信息,需要配置
management:
  endpoint:
    health:
      show-details: always
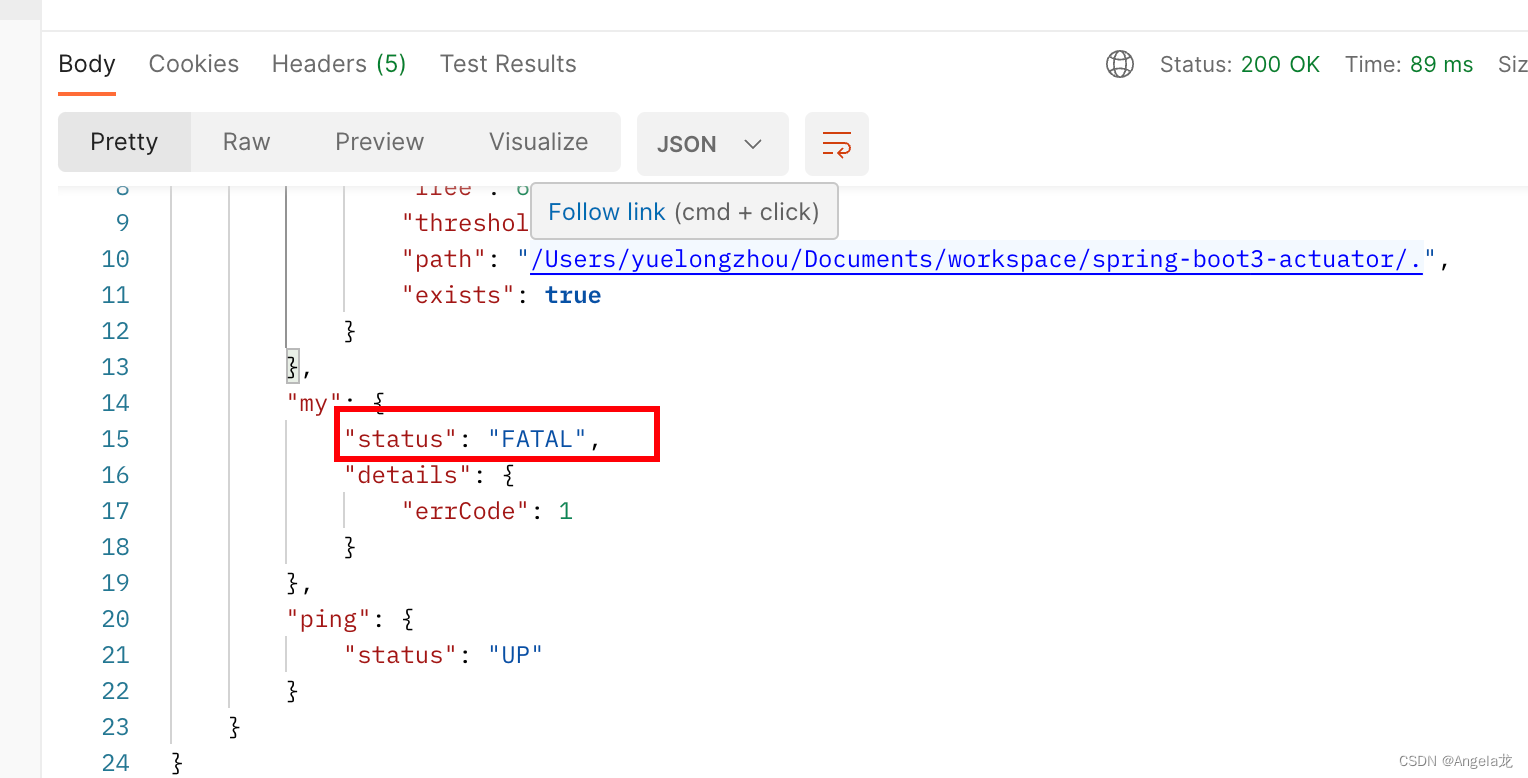
springboot健康信息都是从ApplicationContext中的各种HealthIndicator Beans 中搜集到的
{
    "status": "UP",
    "components": {
        "diskSpace": {
            "status": "UP",
            "details": {
                "total": 994662584320,
                "free": 600135892992,
                "threshold": 10485760,
                "path": "/Users/yuelongzhou/Documents/workspace/spring-boot3-actuator/.",
                "exists": true
            }
        },
        "my": {
            "status": "FATAL",
            "details": {
                "errCode": 1
            }
        },
        "ping": {
            "status": "UP"
        }
    }
}
springboot框架中包含了大量的HealthIndicators的实现类
可以实现自己认为的健康状态
最终的springBoot应用的状态是由HealthAggregator汇总
算法:
1.设置状态码顺序:
setStatusOrder(Status.DOWN,Status.OUT_OF_SERVICE,Status.UP,Status.UNKNOWN)
2.过滤掉不能识别的状态码
3.如果无任何状态码,整个springboot应用的状态是UNKNOWN
4.将所有搜集到的状态码按1中的顺序排序
5.返回有序状态码序列中的第一个状态码,作为整个springboot应用状态
health通过合并几个健康指数检查应用的健康情况
框架自带的HealthIndicators目前包括:
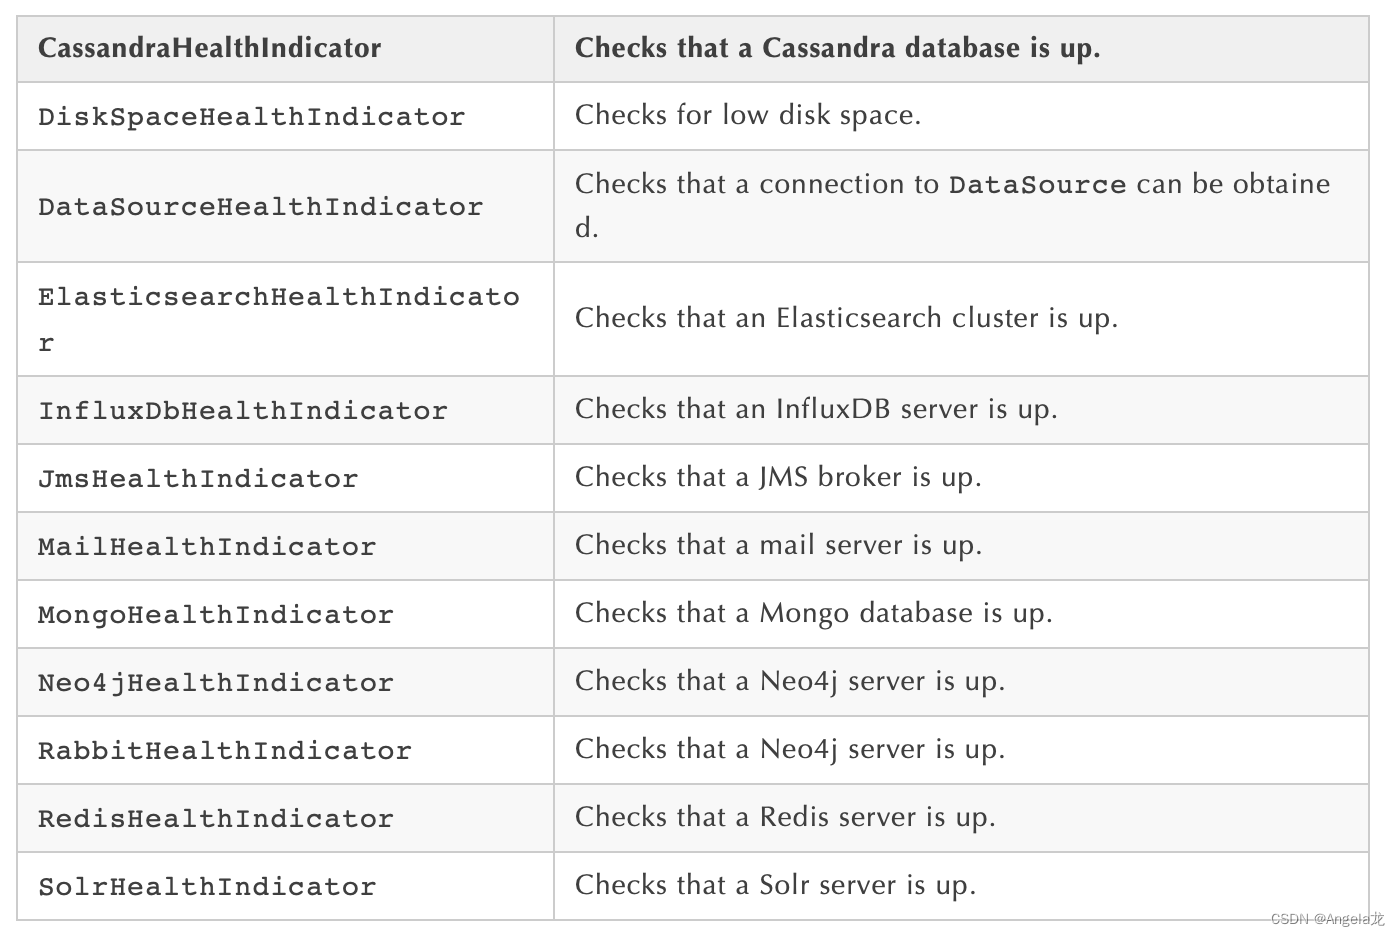
例如:使用的是redis,RedisHealthindicator将被当作检查的一部分
如果使用mongo,MongoHealthIndicator将被当作检查的一部分
可以在配置文件中关闭指定的健康检查指标
例如,关闭redis健康检查
management:
  health:
    redis:
      enabled: false
自定义HealthIndicator健康检查
实现HealthIndicator接口,并将该实现类注册为bean
实现其中health()方法,返回自定义的健康响应状态信息
响应信息包括:状态码和要展示的详细信息
@Component
public class MyHealthIndicator implements HealthIndicator {
    @Override
    public Health health() {
        Integer errCode = 1;
        HashMap<String,Integer> respMap = new HashMap<>();
        respMap.put("errCode", errCode);
        //return Health.down()
        //        .withDetails(respMap).build();
        return Health.unknown().build();
    }
}
除了springboot定义的几个状态类型,自己也可以自定义状态类型
表示新的系统状态
需要实现接口HealthAggregator或通过配置
management.health.status.order来继续使用HealthAggregator的默认实现
在自定义的健康检查HealthIndicator实现类中,
使用了自定义的状态类型FATAL
为了配置该状态类型的严重程度,application.yml添加配置
management:
  health:
    status:
      order: FATAL, DOWN, OUT_OF_SERVICE, UNKNOWN, UP
在做健康检查时,响应中的HTTP状态码反映了整体的健康状态
UP: 200 OUT_OF_SERVICE/DOWN: 503
需要对自定义状态类型设置对应的HTTP状态码
将自定义状态FATAL映射为503
  endpoint:
    health:
      show-details: always
      status:
        order: FATAL, DOWN, OUT_OF_SERVICE, UNKNOWN, UP
info
自己配置在配置文件中以info开头的配置信息
info:
  app:
    name:
      spring-boot_actuator
    version: 1.0.0
    test: test
访问
GET localhost:8080/actuator/info返回:
{
    "app": {
        "name": "spring-boot-actuator",
        "version": "1.0.0",
        "test": "test"
    }
}
beans
展示beans别名,类型,是否单例,类的地址,依赖等信息
GET localhost:8080/actuator/beans
部分信息:
"metricsRestTemplateCustomizer": {
                    "aliases": [],
                    "scope": "singleton",
                    "type": "org.springframework.boot.actuate.metrics.web.client.MetricsRestTemplateCustomizer",
                    "resource": "class path resource [org/springframework/boot/actuate/autoconfigure/metrics/web/client/RestTemplateMetricsConfiguration.class]",
                    "dependencies": [
                        "org.springframework.boot.actuate.autoconfigure.metrics.web.client.RestTemplateMetricsConfiguration",
                        "simpleMeterRegistry",
                        "restTemplateExchangeTagsProvider",
                        "management.metrics-org.springframework.boot.actuate.autoconfigure.metrics.MetricsProperties"
                    ]
                }
condiitons
在应用运行时查看代码某个配置在什么条件下生效,或者某个配置为什么没生效
GET localhost:8080/actuator/conditions
"LogFileWebEndpointAutoConfiguration": [
                    {
                        "condition": "OnAvailableEndpointCondition",
                        "message": "@ConditionalOnAvailableEndpoint no property management.endpoint.logfile.enabled found so using endpoint default; @ConditionalOnAvailableEndpoint marked as exposed by a 'management.endpoints.jmx.exposure' property"
                    }
                ],
heapdump
返回一个GZip压缩的jvm堆dump
GET localhost:8080/actuator/heapdump
自动生成一个jvm的堆文件heapdump
使用jdk自带的jvm监控工具visualVM打开此文件查看内存快照
shutdown
开启接口优雅关闭springboot 应用,要使用这个功能首先在配置文件中开启
management:
  endpoint:
    shutdown:
      enabled: true
配置完成之后,使用curl模拟post请求访问shutdown接口
只支持post请求
{
	"message": "Shutting down, bye..."
}
mappings
描述全部的URL路径,以及它们和控制器的映射关系
GET localhost:8080/actuator/mappings
{
	"handler": "com.zyl.controller.ActuatorController#testActuator()",
	"predicate": "{GET /test}",
	"details": {
		"handlerMethod": {
			"className": "com.zyl.controller.ActuatorController",
			"name": "testActuator",
			"descriptor": "()Ljava/lang/String;"
		},
		"requestMappingConditions": {
			"consumes": [],
			"headers": [],
			"methods": [
				"GET"
			],
			"params": [],
			"patterns": [
				"/test"
			],
			"produces": []
		}
	}
}
threaddump
生成当前线程活动的快照
方便在日常定位问题的时候查看线程的情况
主要展示线程名,线程id,线程状态,是否等待锁资源等信息
GET localhost:8080/actuator/threaddump
生产出现问题的时候,可以通过应用的线程快照来检测应用正在执行的任务
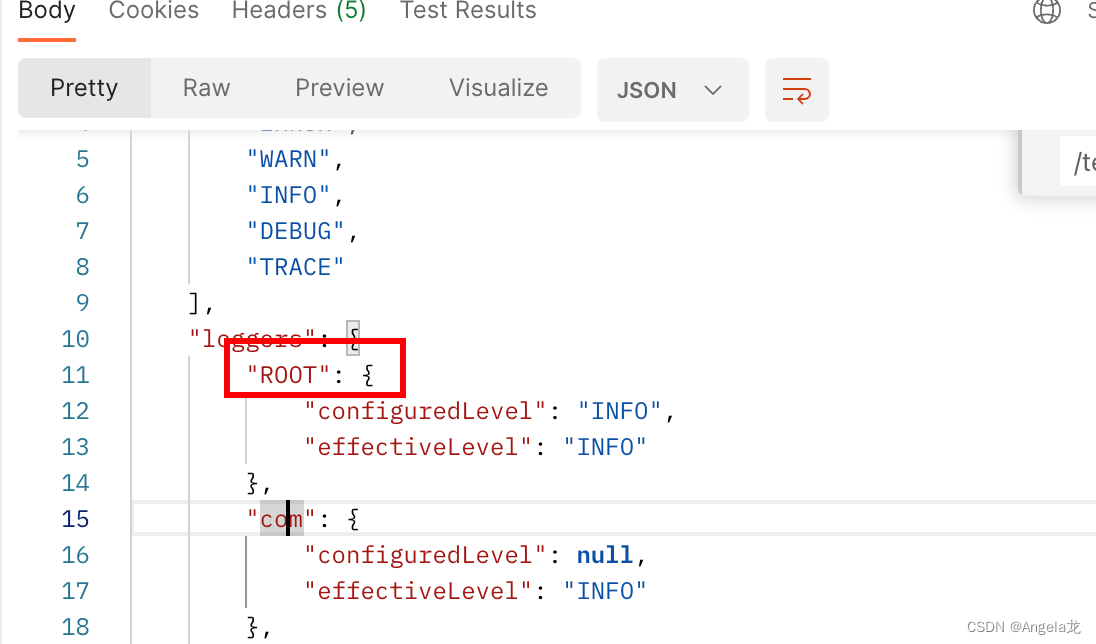
loggers端点
可以查看当前应用的日志级别等信息
GET localhost:8080/actuator/loggers
{
    "levels": [
        "OFF",
        "ERROR",
        "WARN",
        "INFO",
        "DEBUG",
        "TRACE"
    ],
    "loggers": {
        "ROOT": {
            "configuredLevel": "INFO",
            "effectiveLevel": "INFO"
        }
      }
      ...
应用:生产环境日志级别info
但是出现一个bug通过info级别无法排查,可以临时修改log级别
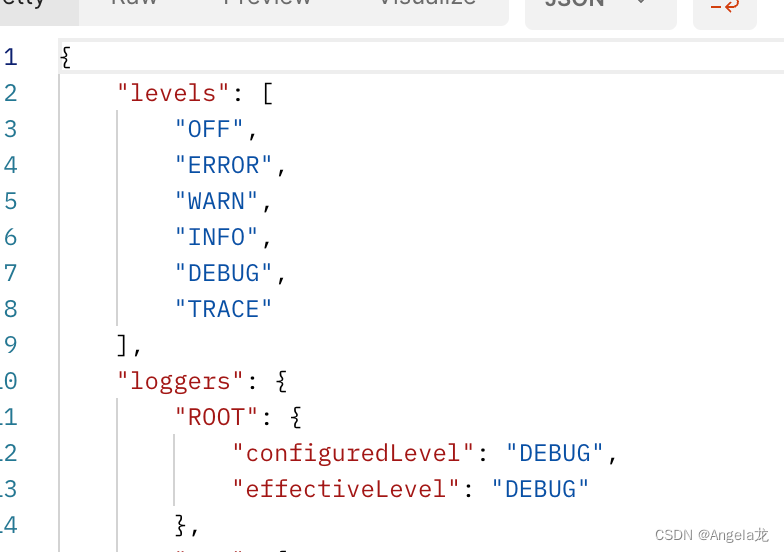
ROOT节点是info级别,通过postman发送一个post请求修改日志级别
POST localhost:8080/actuator/loggers/ROOT
req
{
    "configuredLevel":"DEBUG"
}
再查看日志等级
metrics端点
监控内容覆盖jvm内存,堆,类加载,处理器,tomcat容器等一些重要指标
GET localhost:8080/actuatos/metrics
``json
{
“names”: [
“http.server.requests”,
“jvm.buffer.count”,
“jvm.buffer.memory.used”,
“jvm.buffer.total.capacity”,
“jvm.classes.loaded”,
“jvm.classes.unloaded”,
“jvm.gc.live.data.size”,
“jvm.gc.max.data.size”,
“jvm.gc.memory.allocated”,
“jvm.gc.memory.promoted”,
“jvm.gc.pause”,
“jvm.memory.committed”,
“jvm.memory.max”,
“jvm.memory.used”,
“jvm.threads.daemon”,
“jvm.threads.live”,
“jvm.threads.peak”,
“jvm.threads.states”,
“logback.events”,
“process.cpu.usage”,
“process.files.max”,
“process.files.open”,
“process.start.time”,
“process.uptime”,
“system.cpu.count”,
“system.cpu.usage”,
“system.load.average.1m”,
“tomcat.sessions.active.current”,
“tomcat.sessions.active.max”,
“tomcat.sessions.alive.max”,
“tomcat.sessions.created”,
“tomcat.sessions.expired”,
“tomcat.sessions.rejected”
]
}
任意访问一个指标就可以查看对应的指标信息
GET localhost:8080/actuator/jvm.gc.memory.allocated
```json
{
    "name": "jvm.gc.memory.allocated",
    "description": "Incremented for an increase in the size of the young generation memory pool after one GC to before the next",
    "baseUnit": "bytes",
    "measurements": [
        {
            "statistic": "COUNT",
            "value": 1.9294484E8
        }
    ],
    "availableTags": []
}
自定义endpoint
自定义配置来控制是否开启过滤
actuator:
  filter:
    switch: false
步骤:
1.使用@Endpoint注解相应的类,作为Actuator的一个endpoint,注解要指定id
id作为访问路径,例如:/actuatos/super
2.@ReadOperation注解查询接口,
如果要根据路径查询,要用@Selector注解方法参数
注意:@Selector String arg0,这个arg0不能改变,改成其他的,开放出去的接口还是/{arg0}
导致方法无法获取正常的值
@WriteOperation注解修改接口,请求数据必须是json,不能将实体作为参数
要把实体中相应的属性拿出来做参数
例如:在增加用户时,往request里放一个user对象
SuperEndpoint
@Endpoint(id = "super")
public class SuperEndpoint {

    private ConcurrentHashMap<String, SuperUser> userMap = new ConcurrentHashMap<>();

    @ReadOperation
    public Set<String> users (){
        return userMap.keySet();
    }
    @ReadOperation
    public SuperUser userIdentify(@Selector String arg0) {
        return userMap.get(arg0);
    }

    @WriteOperation
    public Set<String> setUser(String userName,String password) {
        HttpServletRequest req = ((ServletRequestAttributes) RequestContextHolder.getRequestAttributes()).getRequest();
        if (!ObjectUtils.isEmpty(req)) {
            SuperUser superUser = new SuperUser();
            superUser.setUserName(userName);
            superUser.setPassword(password);
            req.getSession().setAttribute("superUser",superUser);
            userMap.put(superUser.getUserName(),superUser);
        }
        return userMap.keySet();
    }
}
实体类
@Data
public class SuperUser {

    private String userName;
    private String password;

}
将Endpoint注册为bean
@Configuration
@ServletComponentScan
public class MvcEndpointConfig {

    @Bean
    public SuperEndpoint superEndpoint () {
        return new SuperEndpoint();
    }

}
@ReadOperstion:作用在方法上,返回端点展示的信息
GET localhost:8080/actuator/super/zyl
{
    "userName": "zyl",
    "password": "123456"
}
@WriteOperation:作用在方法上,修改端点展示的信息
POST localhost:8080/actuator
req
{
    "userName":"zyl",
    "password":"654321"
}
使用filter对访问actuator做限制
actuator的接口要做保护,用filter对接口做作最简单保护
1.对/actuator/*下所有路径作过滤,并用actuator.filter.switch属性对filter作开关
2.如果是/actuator/super路径的post操作,放行,将会往request中放一个对象
3.其他/actuator/*下路径要判断request中有没有user对象,没有就返回错误提示
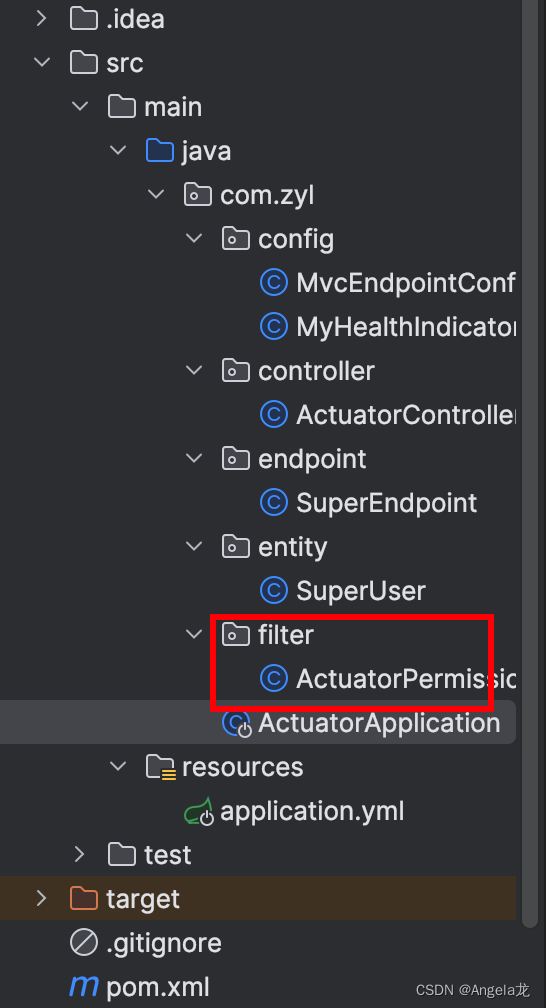
ActuatorPermissionFilter
@WebFilter(urlPatterns = "/actuator/*",filterName = "actuatorPermissionFilter")
@Order(1)//指定过滤器的执行顺序,值越大越靠后执行
public class ActuatorPermissionFilter implements Filter {

    private static final String EXCLUDE_PATH = "actuator/super";

    @Value("${actuator.filter.switch}")
    private Boolean actuatorSwitch;

    @Override
    public void doFilter(ServletRequest servletRequest, ServletResponse servletResponse, FilterChain filterChain) throws IOException, ServletException {
        HttpServletRequest req = (HttpServletRequest) servletRequest;
        HttpServletResponse resp = (HttpServletResponse) servletResponse;
        if (
                actuatorSwitch && !(req.getRequestURI().endsWith(EXCLUDE_PATH))
                && String.valueOf(HttpMethod.POST).equals(req.getMethod())
        ) {
            Object user = req.getSession().getAttribute("superUser");
            if (ObjectUtils.isEmpty(user)) {
                //未登录,返回数据
                ObjectMapper mapper = new ObjectMapper();
                resp.setStatus(HttpStatus.OK.value());
                resp.setContentType(MediaType.APPLICATION_JSON.getType());
                mapper.writeValue(resp.getWriter(),"无权限访问该接口,请使用自定义的登录接口设置superUser后使用");
                return;
            }
        }
        filterChain.doFilter(req,resp);
    }
}
配置文件中设置开关
actuator:
  filter:
    switch: true
注册过滤器
@SpringBootApplication
@ServletComponentScan("com.zyl.filter")
public class ActuatorApplication {
    public static void main(String[] args) {
        SpringApplication.run(ActuatorApplication.class,args);
    }
}
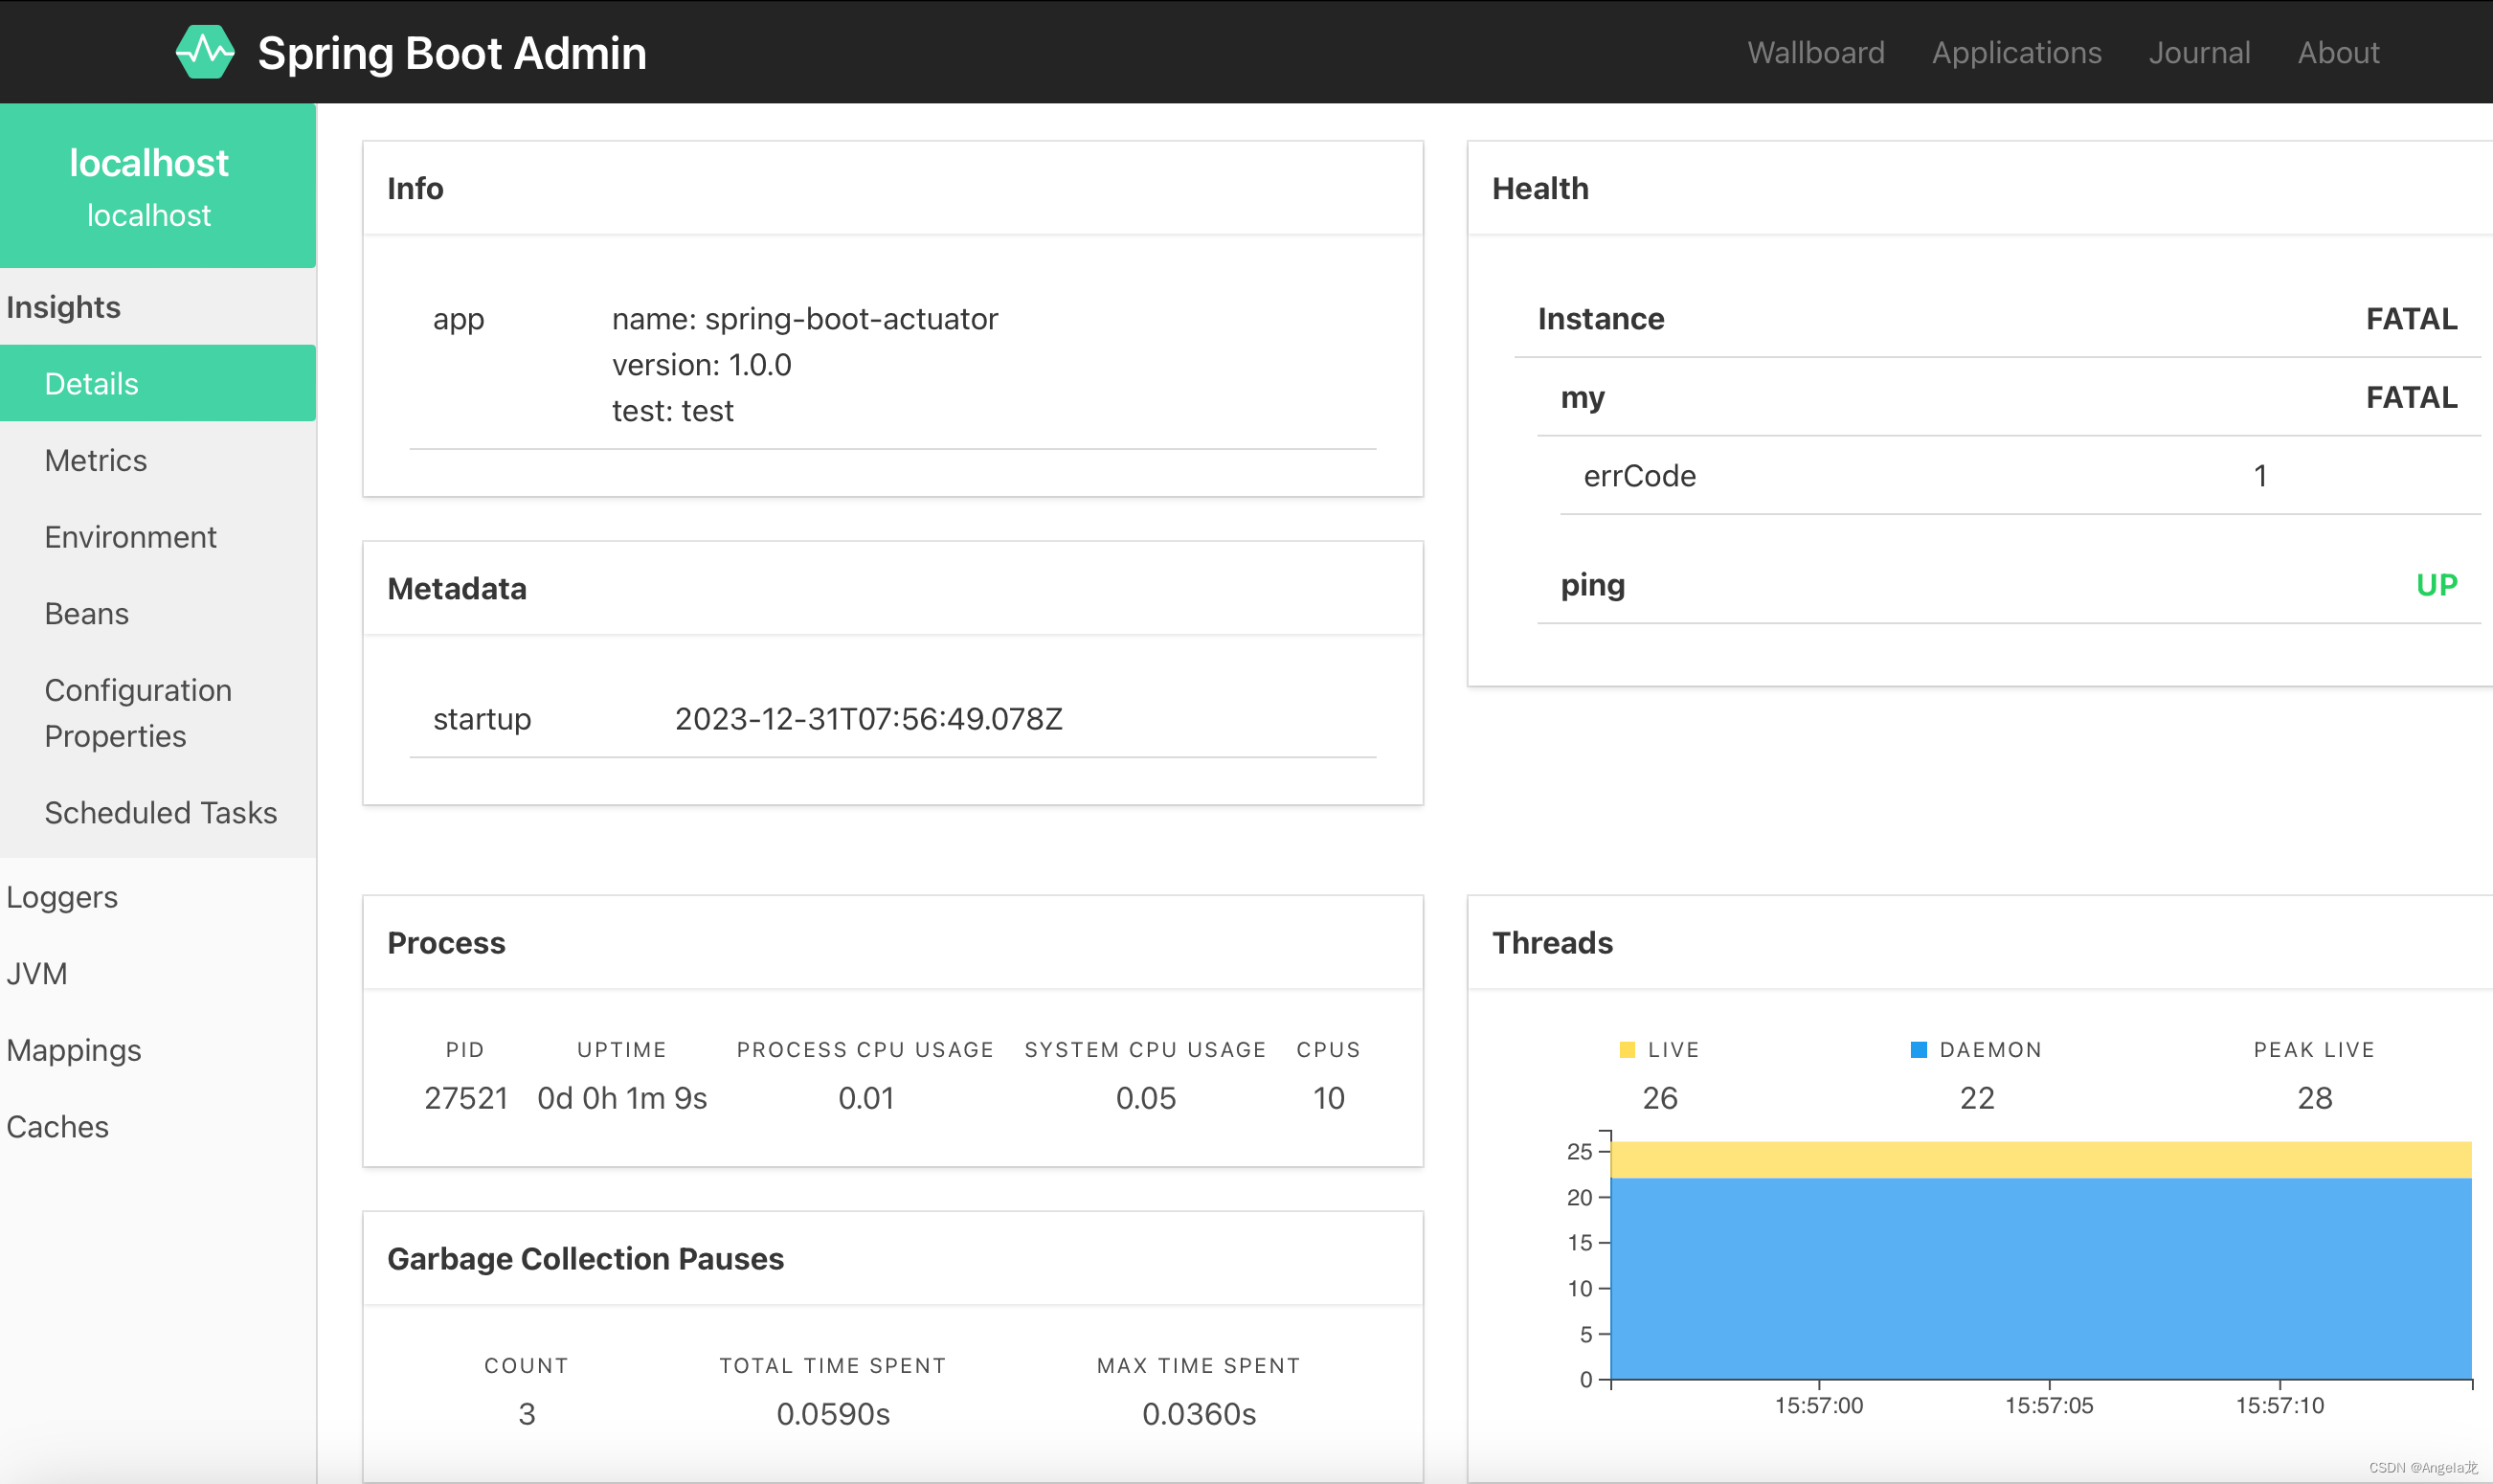
springboot monitor做监控页面
引入依赖
        <dependency>
            <groupId>cn.pomit</groupId>
            <artifactId>spring-boot-monitor</artifactId>
            <version>0.0.1</version>
        </dependency>
浏览器访问localhost:8080/monitor


 3824
3824


 被折叠的 条评论
为什么被折叠?
被折叠的 条评论
为什么被折叠?
 到【灌水乐园】发言


