echarts step line

在这里插入图片描述

https://ppchart.com/#/

<template>
    <div class="c-box" ref="jsEchart"></div>
</template>

<script>
import * as $echarts from 'echarts'
// 事件处理函数
export default {
    props: {
        // 需要传递的数据
        data: {
            type: Array,
            default() {
                return [];
            }
        },
        axisLabelFormatter: {
            type: Function,
            default: null
        }
    },
    data() {
        return {
            // echarts对象
            myEchart: null,
            // echart的options
            options: {}
        };
    },
    // 创建元素
    mounted() {
        this.init();
    },
    // 销毁
    destroyed() {
        // 销毁图表
        this.destroyedChart();
    },
    methods: {
        // 设置默认参数
        setDefaultOptions() {
            // 默认的参数
            this.options = {
                legend: {
                    data: [],
                },
                xAxis: {
                    type: 'category',
                    data: [],
                    boundaryGap : false,
                    position: 'bottom',
                    show: false,
                    axisTick: {
                        show: false
                    },
                    axisLine:{
                        show: true,
                        lineStyle: {
                            color: '#E3EEF6',
                        }
                    },
                    axisLabel:{
                        show: false,
                        color: '#222B45',
                        margin: 10
                    },
                },
                yAxis: {
                    type: 'value',
                    max: 1,
                    min: 0,
                    axisTick:{
                        show: false
                    },
                    axisLine:{
                        show: false,
                    },
                    axisLabel:{
                        show: true,
                        color: '#222B45',
                        formatter: this.axisLabelFormatter
                    },
                    splitLine: {
                        show: false,
                        lineStyle: {
                            color: '#E3EEF6'
                        }
                    },
                },
                series: [
                    {
                        name: 'Step Start',
                        type: 'line',
                        step: 'start',
                        data: [],
                        lineStyle: {
                            color: "rgba(51, 102, 255, 1)"
                        },
                        showSymbol: false
                    }
                ],
            };
        },

        /**
         * @description 初始化的方法
         * @name init
         * @return {*} 无
         */
        init() {
            // 更新数据
            this.update(this.data);
        },

        /**
         * @description 刷新图表
         * @return {*} 无
         */
        refresh() {
            if (this.myEchart) {
                this.myEchart.resize();
            }
        },

        /**
         * @description 设置图表的数据
         * @name getChartData
         * @param {object} data 参数
         * @return {*} 无
         */
        update(data) {
            // 先判断数据是否存在
            if (!Array.isArray(data)) {
                return false;
            }
            // 如果不存在echarts
            if (!this.myEchart) {
                // 图表对象
                this.myEchart = $echarts.init(this.$refs.jsEchart);
                // 绑定resize 事件
                this.bindResizeEvent();
            }
            // 设置默认参数
            this.setDefaultOptions();
            // 更新数据
            this.updateData(data);
            // 清空图表
            this.myEchart.clear();
            // 生成图表
            this.myEchart.setOption(this.options);
        },

        // 更新数据对象
        updateData(data) {
            this.options.series[0].data = data;
        },
        // resize 事件处理函数
        resizeHandler() {
            if (this.myEchart) {
                this.myEchart.resize();
            }
        },

        /**
         * @description 绑定resize 事件
         * @name init
         * @return {*} 无
         */
        bindResizeEvent() {
            // 绑定resize事件
            window.addEventListener('resize', this.resizeHandler);
        },
        // 取消事件绑定
        unbindResizeEvent() {
            // 取消绑定resize事件
            window.removeEventListener('resize', this.resizeHandler);
        },

        /**
         * @description 销毁图表
         * @name destroyedChart
         * @return {*} 无
         */
        destroyedChart() {
            // 如果存在echarts
            if (this.myEchart) {
                // 销毁实例,销毁后实例无法再被使用。
                this.myEchart.dispose();
                this.myEchart = null;
                // 取消事件绑定
                this.unbindResizeEvent();
            }
        }
    }
};


</script>

<style scoped>

</style>

<echarts-line
                :data="echartsData"
                :axisLabelFormatter="axisLabelFormatter">
            </echarts-line>
            
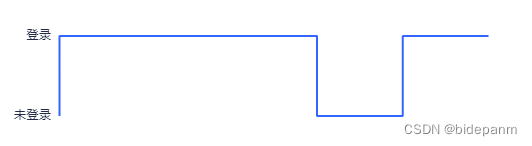
axisLabelFormatter: function (value) {
                if (value === 0) {
                    return '未登录';
                } else if (value === 1) {
                    return '登录';
                }
            }

  • 6
    点赞
  • 6
    收藏
    觉得还不错? 一键收藏
  • 0
    评论

“相关推荐”对你有帮助么?

  • 非常没帮助
  • 没帮助
  • 一般
  • 有帮助
  • 非常有帮助
提交
评论
添加红包

请填写红包祝福语或标题

红包个数最小为10个

红包金额最低5元

当前余额3.43前往充值 >
需支付:10.00
成就一亿技术人!
领取后你会自动成为博主和红包主的粉丝 规则
hope_wisdom
发出的红包
实付
使用余额支付
点击重新获取
扫码支付
钱包余额 0

抵扣说明:

1.余额是钱包充值的虚拟货币,按照1:1的比例进行支付金额的抵扣。
2.余额无法直接购买下载,可以购买VIP、付费专栏及课程。

余额充值