


语图(YuTu)- 自然语言转SQL可视化平台
SQLViz-GPT 是一个基于 AI 的智能数据分析与可视化平台,能够将自然语言需求转换为 SQL 查询并生成专业的数据可视化图表。
功能特点
- 🤖 智能分析: 集成通义千问大语言模型,将自然语言转换为标准 SQL
- 📊 专业可视化: 基于 ECharts 引擎,自动生成适配数据特点的图表
- 🔄 实时预览: SQL 查询结果实时展示,支持数据可视化即时预览
- 💾 配置导出: 支持导出 SQL 和图表配置,便于后续编辑与团队协作
- 🛠 环境配置: 支持自定义数据库连接和 API 密钥配置
快速开始
前端部署
# 进入前端目录
cd code

# 安装依赖
npm install

# 启动开发服务器
npm run serve

# 构建生产版本
npm run build
后端部署
# 进入后端目录
cd 后台

# 使用 Maven 打包
mvn clean package

# 运行 jar 包
java -jar target/SpringBoot-1.0-SNAPSHOT.jar
环境要求
- Node.js >= 14
- Java >= 8
- MySQL >= 5.7
- Maven >= 3.6
配置说明
数据库配置
- 创建 MySQL 数据库
- 在平台配置页面填写数据库连接信息:
- 主机地址
- 端口
- 数据库名
- 用户名
- 密码
API 配置
- 获取通义千问 API 密钥
- 在平台配置页面填写 API Key
使用流程
- 配置数据库连接信息和 API 密钥
- 输入业务分析需求描述
- 系统自动生成 SQL 查询语句
- 执行查询并生成可视化图表
- 根据需要调整和导出配置
技术栈
- 前端: Vue 3 + TailwindCSS + ECharts
- 后端: Spring Boot + MySQL
- AI: 通义千问大语言模型
演示截图
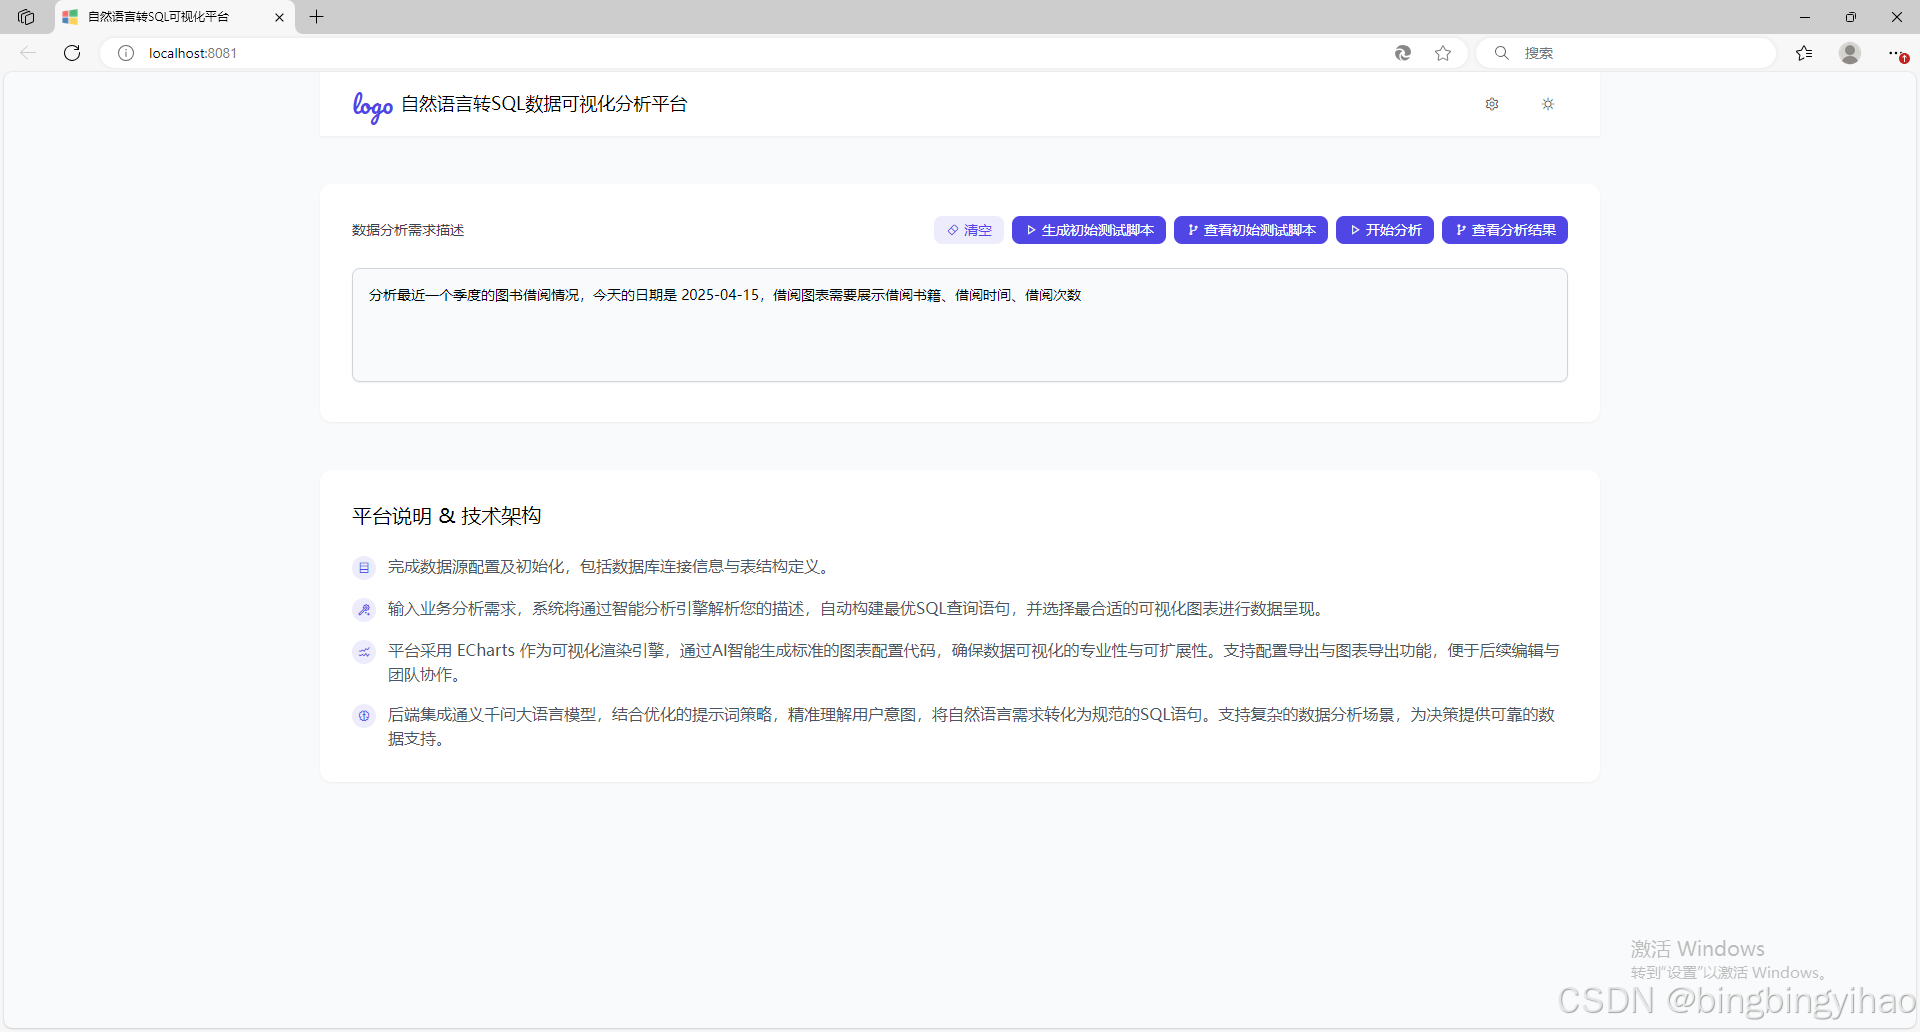
1.首页
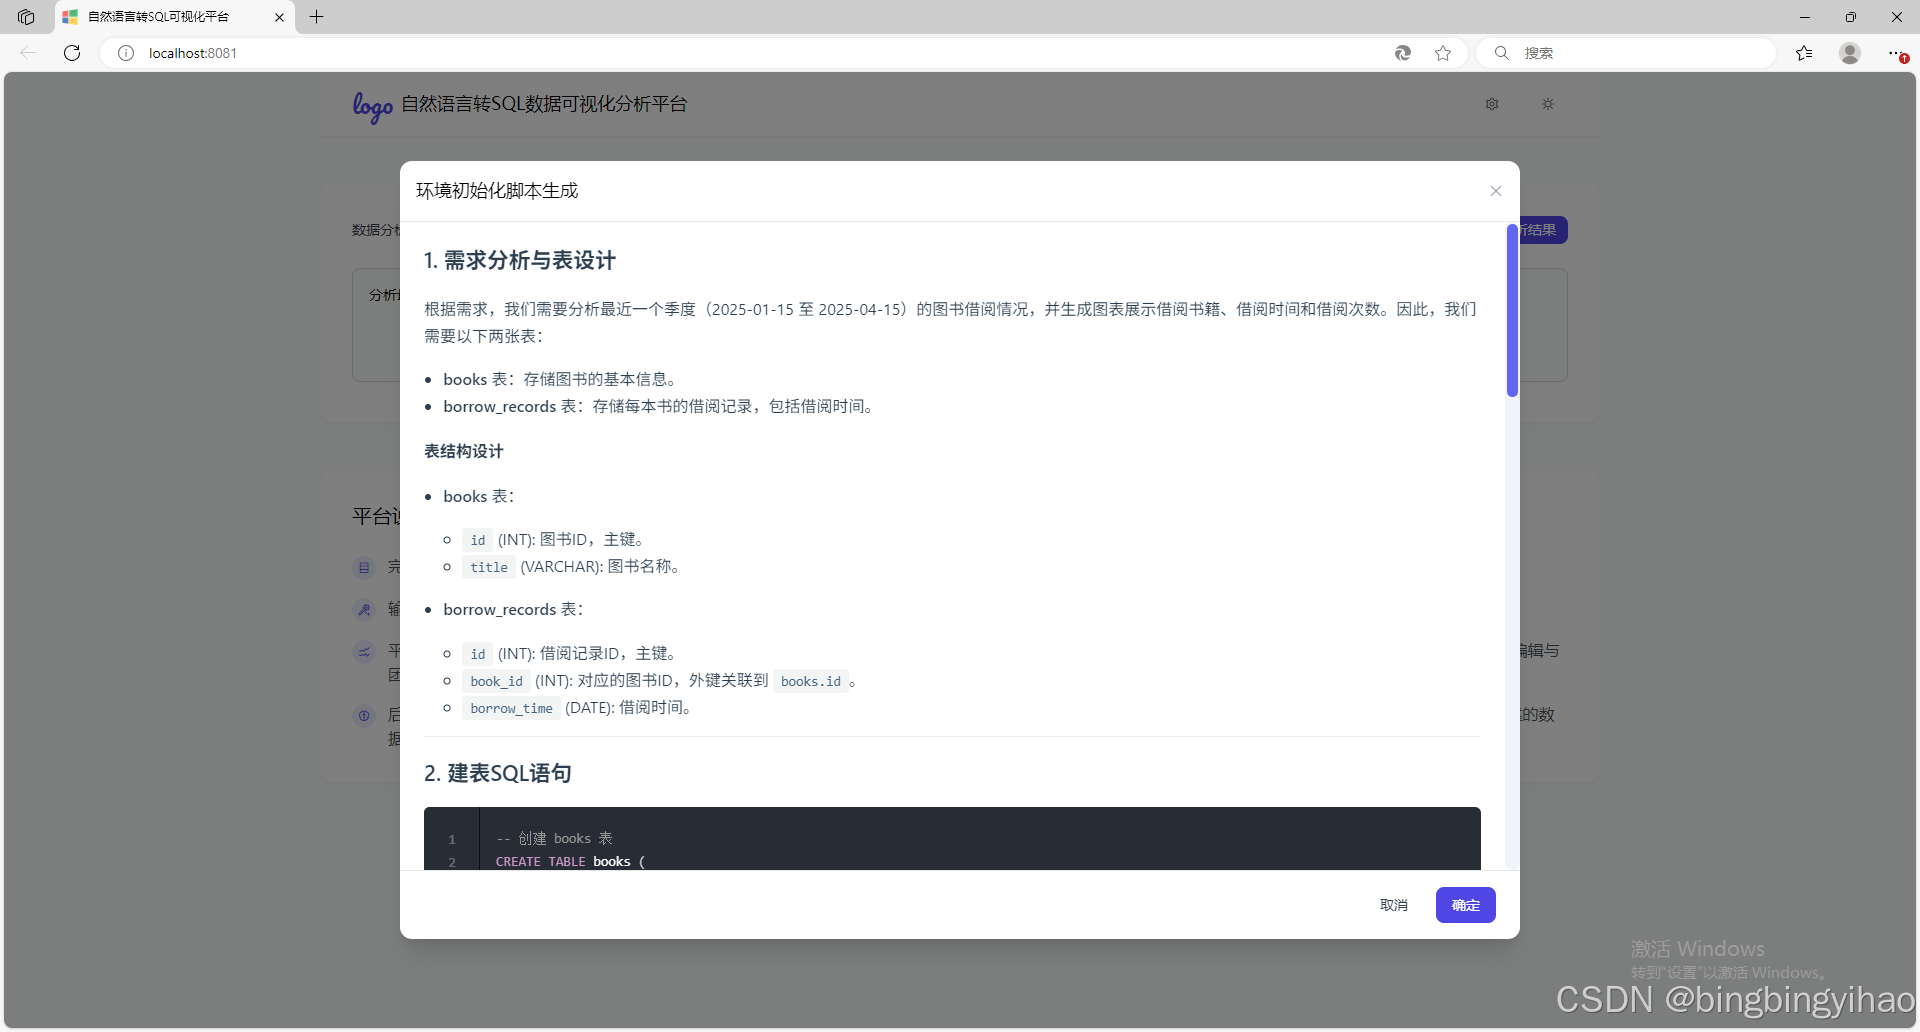
2.初始化脚本及测试数据1
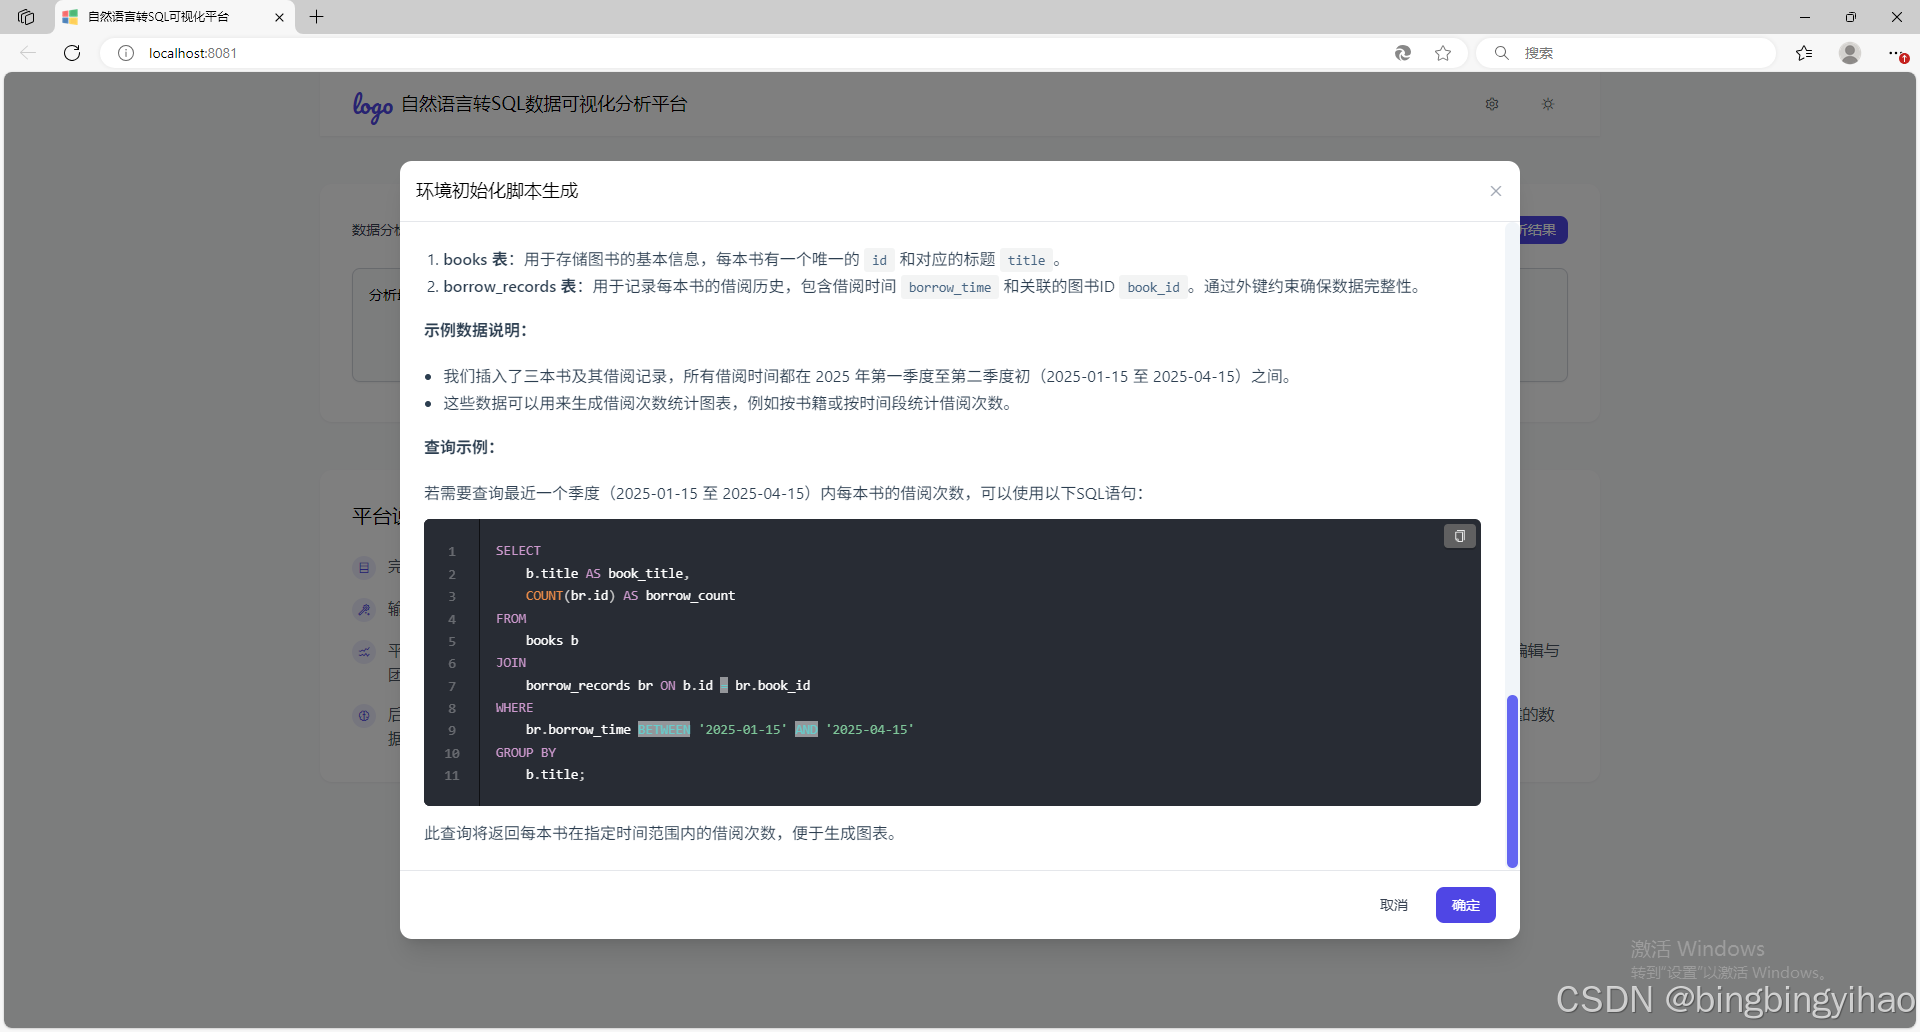
3.初始化脚本及测试数据2
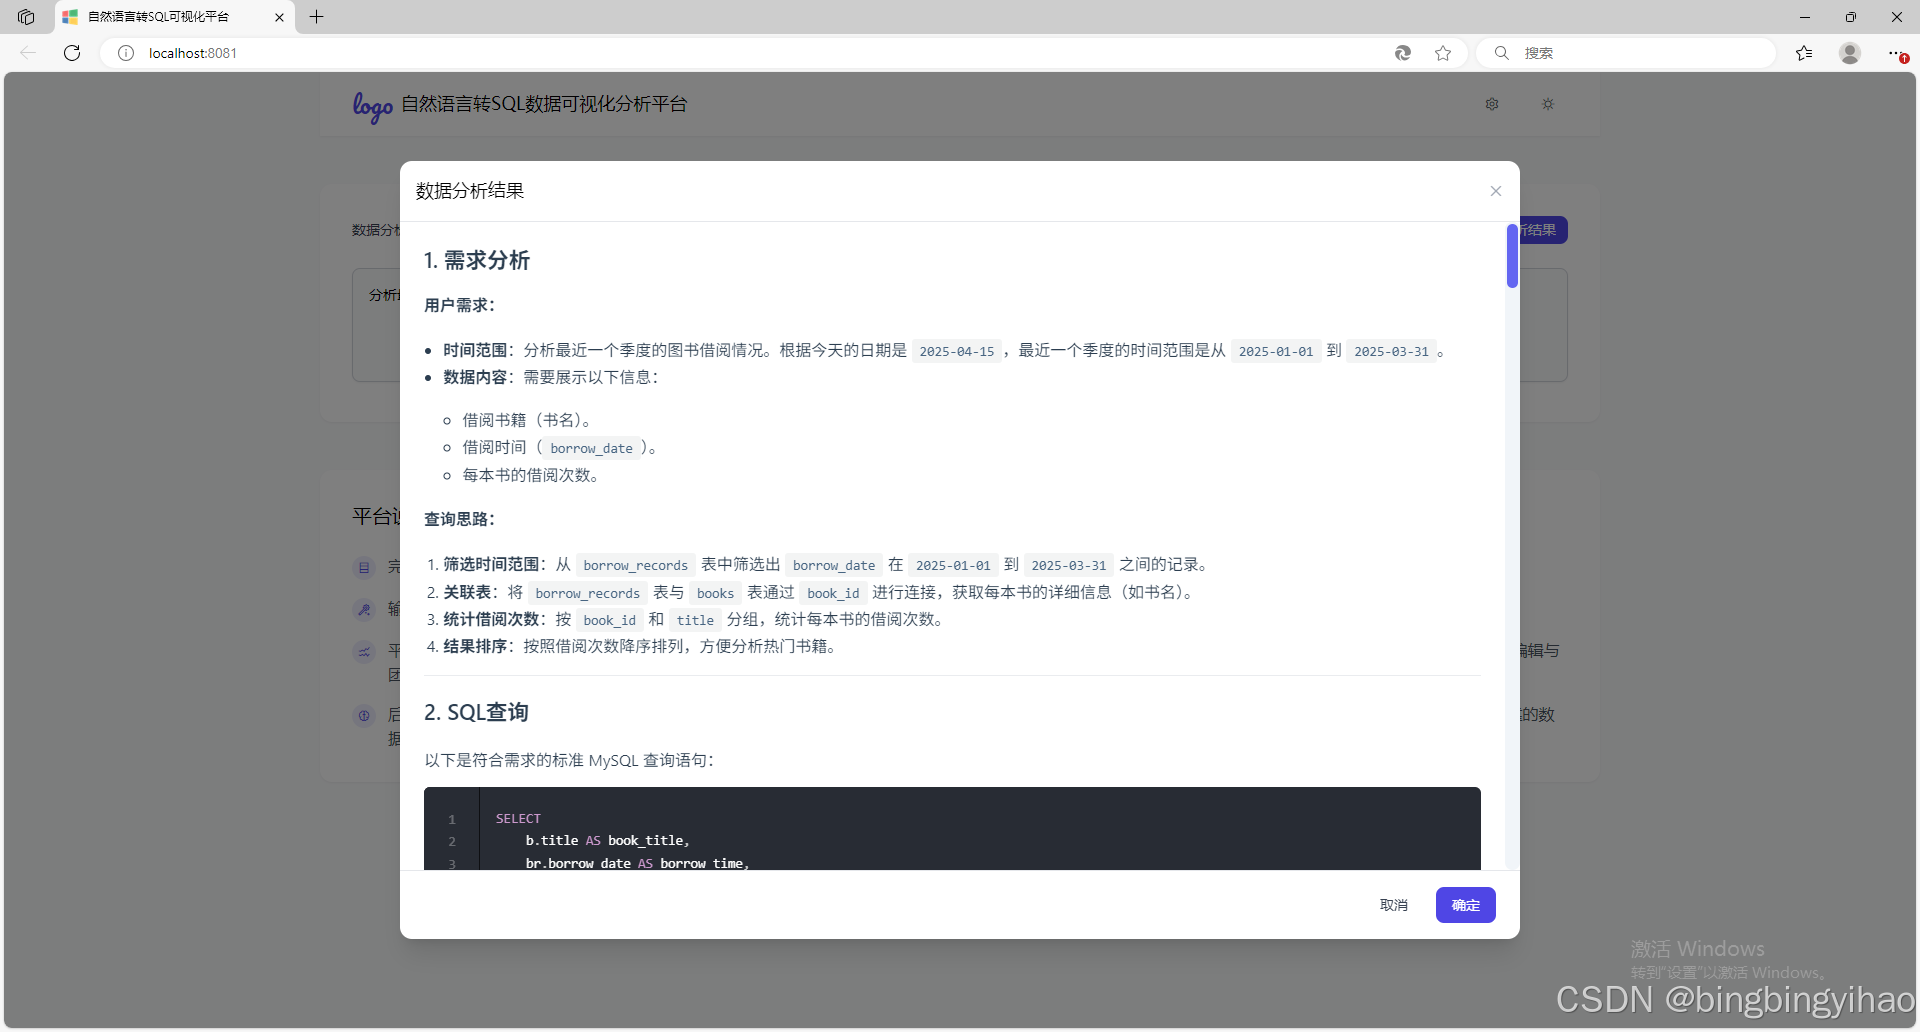
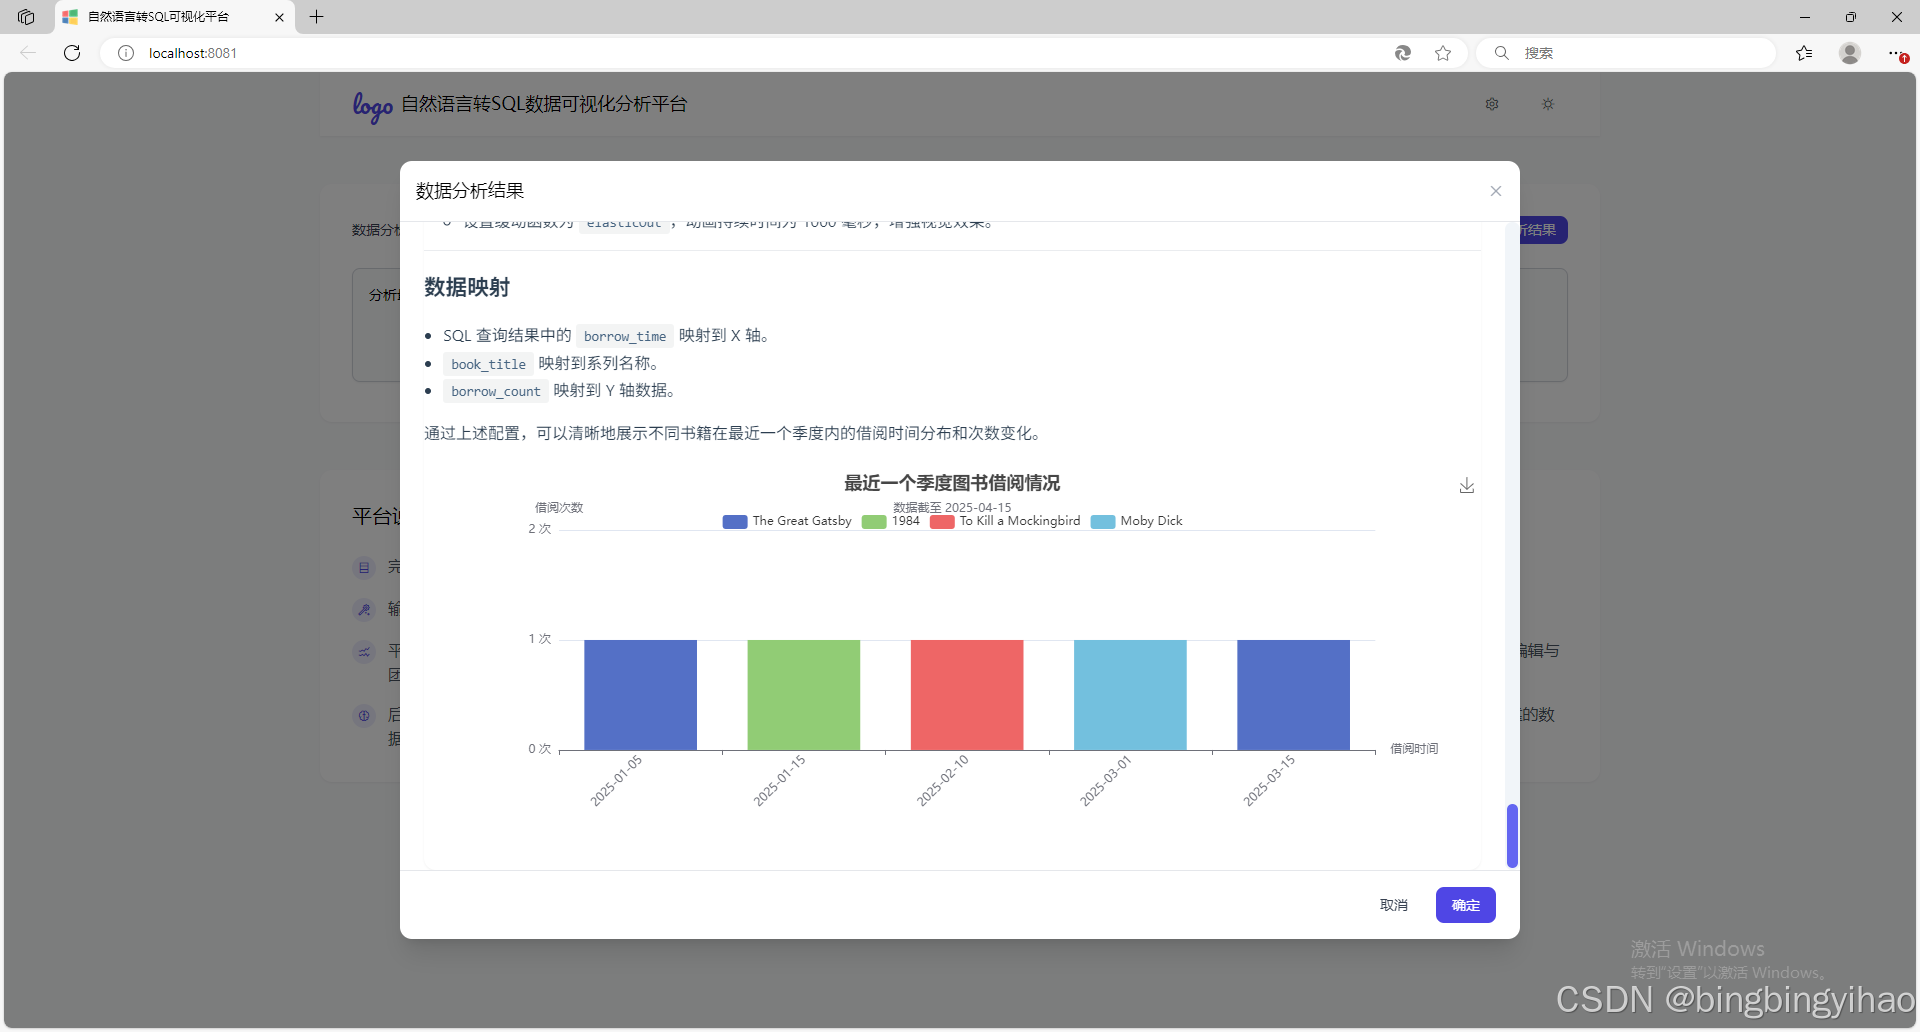
4.生成数据分析结果1
5.生成数据分析结果2
代码下载
核心源码
code/src/components/Dialog.vue
<template>
  <transition name="dialog-fade">
    <div v-show="visible" class="fixed inset-0 z-50 overflow-y-auto">
      <div class="flex min-h-screen items-center justify-center px-4">
        <div class="fixed inset-0 bg-black bg-opacity-50 transition-opacity" @click="handleClose"></div>
        <div class="relative bg-white rounded-lg shadow-xl w-full transform transition-all">
          <div class="flex items-center justify-between p-4 border-b">
            <h3 class="text-lg font-medium">{{ title }}</h3>
            <button class="text-gray-400 hover:text-gray-500" @click="handleClose">
              <i class="fas fa-times"></i>
            </button>
          </div>
          <div class="p-6 preview-container">
            <slot></slot>
          </div>
          <div class="px-6 py-4 border-t flex justify-end space-x-3">
            <button
              class="px-4 py-2 text-sm font-medium text-gray-700 hover:bg-gray-100 rounded-md"
              @click="handleClose"
            >
              取消
            </button>
            <button
              class="px-4 py-2 text-sm font-medium text-white bg-primary hover:bg-primary/90 rounded-md"
              @click="handleConfirm"
            >
              确定
            </button>
          </div>
        </div>
      </div>
    </div>
  </transition>
</template>

<script setup>
import { ref, defineProps, defineEmits } from 'vue';

const props = defineProps({
  title: {
    type: String,
    required: true
  },
  visible: {
    type: Boolean,
    default: false
  }
});

const emit = defineEmits(['update:visible', 'confirm']);

const handleClose = () => {
  emit('update:visible', false);
};

const handleConfirm = () => {
  emit('confirm');
  handleClose();
};
</script>

<style scoped>
.dialog-fade-enter-active,
.dialog-fade-leave-active {
  transition: opacity 0.3s ease;
}

.dialog-fade-enter-from,
.dialog-fade-leave-to {
  opacity: 0;
}

.preview-container {
  overflow: auto;
}

.preview-container::-webkit-scrollbar {
  width: 15px;
}

.preview-container::-webkit-scrollbar-track {
  background: #f1f5f9;
  border-radius: 8px;
}

.preview-container::-webkit-scrollbar-thumb {
  background: #6366f1;
  border-radius: 8px;
  border: 2px solid #f1f5f9;
}

.preview-container::-webkit-scrollbar-thumb:hover {
  background: #4f46e5;
}
</style>
code/src/components/DataVisualization.vue
<template>
  <div class="space-y-4">
    <div class="bg-white rounded-lg shadow-sm">
      <h3 class="text-lg font-medium mb-4">SQL 查询</h3>
      <div class="space-x-2">
        <button
            class="px-3 py-1 text-sm rounded-md bg-primary/10 text-primary hover:bg-primary/20 transition-colors"
            @click="generateOption"
        >
          <i class="fas fa-chart-line mr-1"></i>生成echarts图表
        </button>
      </div>
      <div class="rounded-md">
        <v-md-editor
            v-model="sqlRef"
            mode="preview"
            :disabled="true"
            height="100%"
        ></v-md-editor>
      </div>
    </div>

    <div class="bg-white rounded-lg shadow-sm echarts-options-container" v-show="chartConfig">
      <v-md-editor
          v-model="chartConfig"
          mode="preview"
          :disabled="true"
          height="100%"
      ></v-md-editor>
      <div ref="chartContainer" class="w-full h-[400px]" v-show="option"></div>
    </div>
  </div>
</template>

<script setup>
import {ref, onMounted, onUnmounted, watch, nextTick} from 'vue';
import * as echarts from 'echarts';
import Message from '@/utils/message';
import {baseURL, callGpt} from "@/utils/util";
import {confirm} from "@/utils/confirm";

const props = defineProps({
  sql: {
    type: String,
    required: true
  },
  description: {
    type: String,
    required: true
  },
});

const sqlRef = ref('');
const chartContainer = ref();
let chart = null;
const chartConfig = ref();
const option = ref();

// 执行 SQL 查询并获取数据
const fetchData = async () => {
  try {
    const settings = JSON.parse(localStorage.getItem('sqlviz-settings'));
    const response = await fetch(baseURL+ '/api/query', {
      method: 'POST',
      headers: {
        'Content-Type': 'application/json'
      },
      body: JSON.stringify({
        sql: props.sql,
        dbConfig: {
          host: settings.dbHost,
          port: settings.dbPort,
          database: settings.dbName,
          user: settings.dbUsername,
          password: settings.dbPassword
        }
      })
    });

    if (!response.ok) {
      throw new Error('查询失败');
    }

    const data = await response.json();
    return data;
  } catch (error) {
    Message.error('数据查询失败:' + error.message);
    throw error;
  }
};

const generateOption = async () => {
  chartConfig.value = '正在分析SQL,生成echarts配置...';

  const seriesData = await fetchData();

  const prompt = `基于以下信息,请生成ECharts可视化配置:

1. 数据分析需求:
${props.description}

2. 当前SQL查询结果数据:
${JSON.stringify(seriesData, null, 2)}

请按照以下格式输出:
1. 可视化分析:分析数据特点,选择合适的图表类型并说明原因
2. ECharts配置:生成完整的ECharts配置代码(JSON格式)

注意事项:
- 配置必须包含以下基础组件:
  * title:设置合适的标题和副标题
  * tooltip:配置数据提示框
  * toolbox:必须包含 saveAsImage 功能
  * grid:确保图表布局合理
  * legend:当有多个系列时必须配置图例

- 样式设置要求:
  * 使用合适的颜色方案
  * 确保图表清晰易读
  * 适当配置动画效果
  * 根据数据特点设置坐标轴样式

- 数据映射说明:
  * 准确映射SQL查询结果中的字段
  * 合理处理数值类型和格式化
  * 支持多维度数据展示
  * 确保数据单位标识清晰`;

  const sk = JSON.parse(localStorage.getItem("sqlviz-settings")).apiKey;
  callGpt(sk, prompt,
      (text) => {
        chartConfig.value = text;
        // 自动滚动到底部
        scrollToBottom();
      },
      (finalText) => {
        chartConfig.value = finalText;
        const echartsOptionsContainer = document.getElementsByClassName("echarts-options-container")[0];
        const jsonElem = echartsOptionsContainer.getElementsByClassName("v-md-prism-json")[0];
        option.value = jsonElem.textContent;
        console.log(jsonElem.textContent)
        nextTick(() => {
          updateChart();
          scrollToBottom();
        });
        Message.success('脚本生成完成');
      }
  );
};

// 更新图表数据
const updateChart = async () => {
  try {
    if (chart) {
      chart.dispose();
    }
    chart = echarts.init(chartContainer.value);
    chart.setOption(JSON.parse(option.value));
  } catch (error) {
    console.error('绘制图表失败:', error);
    Message.error('绘制图表失败:' + error.message);
  }
};

onMounted(() => {
  sqlRef.value = '```sql\n' + props.sql + '\n```';
  console.log(sqlRef.value)
  nextTick(() => {
    const copyBtnList = document.getElementsByClassName("v-md-copy-code-btn");
    for (let i = 0; i < copyBtnList.length; i++) {
      copyBtnList[i].onclick = function () {
        // 添加复制成功的类
        copyBtnList[i].classList.add('copied');
        // 1.5秒后恢复原状
        setTimeout(() => {
          copyBtnList[i].classList.remove('copied');
        }, 1500);
      }
    }
  });
});

onUnmounted(() => {
  if (chart) {
    chart.dispose();
    chart = null;
  }
});

const scrollToBottom = () => {
  nextTick(() => {
    const containers = document.querySelectorAll('.preview-container');
    containers.forEach(container => {
      if (container.offsetParent !== null) {  // 判断元素是否可见
        container.scrollTop = container.scrollHeight;
      }
    });

    const copyBtnList = document.getElementsByClassName("v-md-copy-code-btn");
    for (let i = 0; i < copyBtnList.length; i++) {
      copyBtnList[i].onclick = function () {
        // 添加复制成功的类
        copyBtnList[i].classList.add('copied');
        // 1.5秒后恢复原状
        setTimeout(() => {
          copyBtnList[i].classList.remove('copied');
        }, 1500);
      }
    }
  });
};
</script>
code/src/App.vue
<template>
  <div class="min-h-screen bg-gray-50">
    <div class="max-w-7xl mx-auto">
      <nav class="h-16 bg-white shadow-sm flex items-center justify-between px-8">
        <div class="flex items-center space-x-2">
          <span class="text-2xl font-['Pacifico'] text-primary">logo</span>
          <span class="text-lg font-medium">自然语言转SQL数据可视化分析平台</span>
        </div>
        <div class="flex items-center space-x-4">
          <button
            class="w-10 h-10 rounded-button flex items-center justify-center hover:bg-gray-100 transition-colors"
            @click="showSettings = true"
          >
            <i class="fas fa-cog text-gray-600"></i>
          </button>
          <button class="w-10 h-10 rounded-button flex items-center justify-center hover:bg-gray-100 transition-colors">
            <i class="fas fa-sun text-gray-600"></i>
          </button>
        </div>
      </nav>

      <main class="py-12">
        <div class="mx-auto">
          <div class="bg-white rounded-lg shadow-sm p-8">
            <div class="space-y-6">
              <div class="flex items-center justify-between">
                <label for="description" class="block text-sm font-medium text-gray-700">
                  数据分析需求描述
                </label>
                <div class="flex space-x-2">
                  <button
                    class="px-3 py-1 text-sm rounded-md bg-primary/10 text-primary hover:bg-primary/20 transition-colors"
                    @click="handleClear"
                  >
                    <i class="fas fa-eraser mr-1"></i>清空
                  </button>
                  <button
                      class="px-3 py-1 text-sm rounded-md bg-primary text-white hover:bg-primary/90 transition-colors"
                      @click="handleGenerateEnv"
                  >
                    <i class="fas fa-play mr-1"></i>生成初始测试脚本
                  </button>
                  <button
                      class="px-3 py-1 text-sm rounded-md bg-primary text-white hover:bg-primary/90 transition-colors"
                      @click="handleViewGenerateEnv"
                  >
                    <i class="fas fa-code-branch mr-1"></i>查看初始测试脚本
                  </button>
                  <button
                    class="px-3 py-1 text-sm rounded-md bg-primary text-white hover:bg-primary/90 transition-colors"
                    @click="handleAnalyze"
                  >
                    <i class="fas fa-play mr-1"></i>开始分析
                  </button>
                  <button
                      class="px-3 py-1 text-sm rounded-md bg-primary text-white hover:bg-primary/90 transition-colors"
                      @click="handleViewAnalyze"
                  >
                    <i class="fas fa-code-branch mr-1"></i>查看分析结果
                  </button>
                </div>
              </div>
              <div>
                <textarea
                  id="description"
                  v-model="description"
                  rows="4"
                  class="block w-full rounded-md border-gray-300 shadow-sm focus:border-primary focus:ring-primary sm:text-sm resize-none p-4 my-2"
                  placeholder="请描述您的数据分析需求,例如:'分析最近一个季度人力资源部门的人员流动趋势及构成变化'"
                ></textarea>
              </div>
            </div>
          </div>

          <div class="mt-12 bg-white rounded-lg shadow-sm p-8">
            <h2 class="text-xl font-medium mb-6">平台说明 & 技术架构</h2>
            <div class="space-y-4 text-gray-600">
              <div class="flex items-start space-x-3">
                <div class="w-6 h-6 rounded-full bg-primary/10 flex items-center justify-center flex-shrink-0 mt-0.5">
                  <i class="fas fa-database text-sm text-primary"></i>
                </div>
                <p>完成数据源配置及初始化,包括数据库连接信息与表结构定义。</p>
              </div>
              <div class="flex items-start space-x-3">
                <div class="w-6 h-6 rounded-full bg-primary/10 flex items-center justify-center flex-shrink-0 mt-0.5">
                  <i class="fas fa-magic text-sm text-primary"></i>
                </div>
                <p>输入业务分析需求,系统将通过智能分析引擎解析您的描述,自动构建最优SQL查询语句,并选择最合适的可视化图表进行数据呈现。</p>
              </div>
              <div class="flex items-start space-x-3">
                <div class="w-6 h-6 rounded-full bg-primary/10 flex items-center justify-center flex-shrink-0 mt-0.5">
                  <i class="fas fa-chart-line text-sm text-primary"></i>
                </div>
                <p>平台采用 ECharts 作为可视化渲染引擎,通过AI智能生成标准的图表配置代码,确保数据可视化的专业性与可扩展性。支持配置导出与图表导出功能,便于后续编辑与团队协作。</p>
              </div>
              <div class="flex items-start space-x-3">
                <div class="w-6 h-6 rounded-full bg-primary/10 flex items-center justify-center flex-shrink-0 mt-0.5">
                  <i class="fas fa-brain text-sm text-primary"></i>
                </div>
                <p>后端集成通义千问大语言模型,结合优化的提示词策略,精准理解用户意图,将自然语言需求转化为规范的SQL语句。支持复杂的数据分析场景,为决策提供可靠的数据支持。</p>
              </div>
            </div>
          </div>
        </div>
      </main>
    </div>

    <!-- 设置弹框 -->
    <Dialog
      v-model:visible="showSettings"
      title="系统设置"
      @confirm="handleSettingsSave"
      class="max-w-3xl"
      style="margin: 0 auto"
    >
      <form @submit.prevent="handleSettingsSave" class="space-y-4">
        <div>
          <label class="block text-sm font-medium text-gray-700 mb-1">数据库主机</label>
          <input
            v-model="settings.dbHost"
            type="text"
            class="w-full px-3 py-2 border rounded-md focus:outline-none focus:ring-2 focus:ring-primary/20 focus:border-primary"
            placeholder="请输入数据库主机地址"
            autocomplete="off"
          >
        </div>
        <div>
          <label class="block text-sm font-medium text-gray-700 mb-1">端口</label>
          <input
            v-model="settings.dbPort"
            type="text"
            class="w-full px-3 py-2 border rounded-md focus:outline-none focus:ring-2 focus:ring-primary/20 focus:border-primary"
            placeholder="请输入数据库端口"
            autocomplete="off"
          >
        </div>
        <div>
          <label class="block text-sm font-medium text-gray-700 mb-1">数据库名称</label>
          <input
            v-model="settings.dbName"
            type="text"
            class="w-full px-3 py-2 border rounded-md focus:outline-none focus:ring-2 focus:ring-primary/20 focus:border-primary"
            placeholder="请输入数据库名称"
            autocomplete="off"
          >
        </div>
        <div>
          <label class="block text-sm font-medium text-gray-700 mb-1">用户名</label>
          <input
            v-model="settings.dbUsername"
            type="text"
            class="w-full px-3 py-2 border rounded-md focus:outline-none focus:ring-2 focus:ring-primary/20 focus:border-primary"
            placeholder="请输入数据库用户名"
            autocomplete="username"
          >
        </div>
        <div>
          <label class="block text-sm font-medium text-gray-700 mb-1">密码</label>
          <input
            v-model="settings.dbPassword"
            type="password"
            class="w-full px-3 py-2 border rounded-md focus:outline-none focus:ring-2 focus:ring-primary/20 focus:border-primary"
            placeholder="请输入数据库密码"
            autocomplete="new-password"
          >
        </div>
        <div>
          <label class="block text-sm font-medium text-gray-700 mb-1">API密钥</label>
          <input
            v-model="settings.apiKey"
            type="password"
            class="w-full px-3 py-2 border rounded-md focus:outline-none focus:ring-2 focus:ring-primary/20 focus:border-primary"
            placeholder="请输入API密钥"
            autocomplete="off"
          >
        </div>
      </form>
    </Dialog>

    <!-- 添加脚本生成预览弹框 -->
    <Dialog
        v-model:visible="showScriptPreview"
        title="环境初始化脚本生成"
        :showFooter="false"
        class="w-full max-w-6xl"
        style="margin: 0 auto"
    >
      <div class="min-h-[400px] max-h-[600px]">
        <v-md-editor
            v-model="scriptContent"
            mode="preview"
            :disabled="true"
            height="100%"
        ></v-md-editor>
      </div>
    </Dialog>

    <!-- 添加分析结果预览弹框 -->
    <Dialog
        v-model:visible="showAnalysisResult"
        title="数据分析结果"
        class="w-full max-w-6xl"
        style="margin: 0 auto"
    >
      <div class="min-h-[400px] max-h-[600px]">
        <div class="analysis-container">
          <v-md-editor
              v-model="analysisContent"
              mode="preview"
              :disabled="true"
              height="100%"
              v-show="analysisContent"
          ></v-md-editor>
        </div>
        <DataVisualization
          v-if="sqlQuery"
          :sql="sqlQuery"
          :description="description"
        />
      </div>
    </Dialog>
  </div>
</template>

<script setup>
import {ref, onMounted, nextTick} from 'vue';
import Dialog from '@/components/Dialog.vue';
import Message from '@/utils/message.js';
import {baseURL, callGpt} from '@/utils/util.js';
import { confirm } from '@/utils/confirm.js';
import DataVisualization from "@/components/DataVisualization.vue";
import {testSql, testChartConfig} from "@/utils/config";

const description = ref('');
const showSettings = ref(false);
const settings = ref({
  dbHost: '',
  dbPort: '',
  dbName: '',
  dbUsername: '',
  dbPassword: '',
  apiKey: ''
});

// 从localStorage加载设置
const loadSettings = () => {
  const savedSettings = localStorage.getItem('sqlviz-settings');
  if (savedSettings) {
    try {
      const parsed = JSON.parse(savedSettings);
      settings.value = { ...settings.value, ...parsed };
    } catch (e) {
      console.error('加载设置失败:', e);
    }
  }
};

// 保存设置到localStorage
const handleSettingsSave = () => {
  // 验证必填项
  if (!settings.value.dbHost || !settings.value.dbPort || !settings.value.dbUsername) {
    Message.warning('请填写必要的数据库配置信息');
    return;
  }

  try {
    localStorage.setItem('sqlviz-settings', JSON.stringify(settings.value));
    Message.success('设置保存成功');
    showSettings.value = false;
  } catch (e) {
    console.error('保存设置失败:', e);
    Message.error('设置保存失败');
  }
};

// 组件挂载时加载设置
onMounted(() => {
  loadSettings();
});

const handleClear = () => {
  description.value = '';
};

const showScriptPreview = ref(false);
const scriptContent = ref('');
let processingGenerateEnv = false;
let isFirstGenerateEnv = true;

const handleViewGenerateEnv = () => {
  showScriptPreview.value = true;
};

// 处理生成环境初始化脚本
const handleGenerateEnv = async () => {
  if (!description.value) {
    Message.warning('请先输入数据分析需求描述');
    return;
  }
  if (!localStorage.getItem("sqlviz-settings")) {
    Message.warning('请先配置apiKey');
    return;
  }
  const sk = JSON.parse(localStorage.getItem("sqlviz-settings")).apiKey;
  if (!sk) {
    Message.warning('请先配置apiKey');
    return;
  }

  if (processingGenerateEnv) {
    showScriptPreview.value = true;
    return;
  }

  if (!isFirstGenerateEnv) {
    const confirmed = await confirm({
      title: '操作提示',
      message: '本次操作会刷新之前的生成记录,是否继续?',
      confirmText: '确认',
      cancelText: '取消'
    });

    if (!confirmed) {
      return;
    }
  }
  isFirstGenerateEnv = false;
  processingGenerateEnv = true;

  showScriptPreview.value = true;
  scriptContent.value = '正在分析需求,生成初始化脚本...';

  const prompt = `基于以下数据分析需求,请生成相应的MySQL数据库初始化脚本,包括建表语句和示例数据:
${description.value}

请按照以下格式输出:
1. 首先分析需求,确定需要创建的表
2. 生成建表SQL语句
3. 生成插入示例数据的SQL语句
4. 提供简要说明`;

  callGpt(sk, prompt,
      (text) => {
        scriptContent.value = text;
        // 自动滚动到底部
        scrollToBottom();
      },
      (finalText) => {
        scriptContent.value = finalText;
        processingGenerateEnv = false;
        Message.success('脚本生成完成');
      }
  );
};

const scrollToBottom = () => {
  nextTick(() => {
    const containers = document.querySelectorAll('.preview-container');
    containers.forEach(container => {
      if (container.offsetParent !== null) {  // 判断元素是否可见
        container.scrollTop = container.scrollHeight;
      }
    });

    const copyBtnList = document.getElementsByClassName("v-md-copy-code-btn");
    for (let i = 0; i < copyBtnList.length; i++) {
      copyBtnList[i].onclick = function () {
        // 添加复制成功的类
        copyBtnList[i].classList.add('copied');
        // 1.5秒后恢复原状
        setTimeout(() => {
          copyBtnList[i].classList.remove('copied');
        }, 1500);
      }
    }
  });
};

let processingAnalyze = false;
let isFirstAnalyze = true;

// 添加新的响应式变量
const sqlQuery = ref('');
const chartConfig = ref(null);

// 修改 handleAnalyze 中的回调处理
const handleAnalyze = async () => {
  if (!description.value) {
    Message.warning('请先输入数据分析需求描述');
    return;
  }

  if (!localStorage.getItem("sqlviz-settings")) {
    Message.warning('请先配置数据库连接信息和API密钥');
    return;
  }
  const settings = JSON.parse(localStorage.getItem("sqlviz-settings"));

  if (processingAnalyze) {
    showAnalysisResult.value = true;
    return;
  }

  if (!isFirstAnalyze) {
    const confirmed = await confirm({
      title: '操作提示',
      message: '本次操作会刷新之前的分析记录,是否继续?',
      confirmText: '确认',
      cancelText: '取消'
    });

    if (!confirmed) {
      return;
    }
  }
  isFirstAnalyze = false;
  processingAnalyze = true;

  showAnalysisResult.value = true;
  analysisContent.value = '正在分析数据,生成可视化结果...';
  sqlQuery.value = "";
  chartConfig.value = null;

  const dbStructure = await getDbStructure();

  const prompt = `基于以下信息,请生成SQL查询语句:

1. 数据分析需求:
${description.value}

2. 当前数据库表结构和示例数据:
${dbStructure}

请按照以下格式输出:
1. 需求分析:分析用户需求,确定查询思路
2. SQL查询:生成符合需求的SQL语句
3. 可视化分析:选择合适的图表类型,并给出原因

注意:
- SQL查询需要基于已有的表结构
- 不能使用with语句
- SQL需要是标准的MySQL语法
`;

  callGpt(settings.apiKey, prompt,
    (text) => {
      analysisContent.value = text;
      // 自动滚动到底部
      scrollToBottom();
    },
    (finalText) => {
      analysisContent.value = finalText;
      processingAnalyze = false;
      Message.success('分析完成');

      // 解析 GPT 返回的内容
      try {
        // 使用正则表达式提取 SQL 和 ECharts 配置
        const analysisContainer = document.getElementsByClassName("analysis-container")[0];
        const sqlElem = analysisContainer.getElementsByClassName("v-md-prism-sql")[0];
        const sqlText = sqlElem.textContent;

        if (sqlText) {
          sqlQuery.value = sqlText.trim();

          nextTick(() => {
            // 自动滚动到底部
            scrollToBottom();
          });
        } else {
          Message.warning('无法解析返回的配置信息');
        }
      } catch (error) {
        console.error('解析配置失败:', error);
        Message.error('解析配置失败');
      }
    }
  );
};

const showAnalysisResult = ref(false);
const analysisContent = ref('');

const handleViewAnalyze = () => {
  // sqlQuery.value = testSql;
  // chartConfig.value = testChartConfig;
  showAnalysisResult.value = true;
};

const getDbStructure = async () => {
  // 获取数据库结构
  const settings = JSON.parse(localStorage.getItem('sqlviz-settings'));
  const response = await fetch(baseURL + '/api/schema', {
    method: 'POST',
    headers: {
      'Content-Type': 'application/json'
    },
    body: JSON.stringify({
      dbConfig: {
        host: settings.dbHost,
        port: settings.dbPort,
        database: settings.dbName,
        user: settings.dbUsername,
        password: settings.dbPassword
      }
    })
  });

  if (!response.ok) {
    throw new Error('获取数据库结构失败');
  }

  const schemaData = await response.json();

  // 格式化数据库结构信息
  let dbStructure = '当前数据库表结构:\n\n';
  schemaData.tables.forEach(table => {
    dbStructure += `### ${table.name}\n\n`;
    dbStructure += '```sql\n' + table.createSql + '\n```\n\n';
    dbStructure += '示例数据:\n```json\n' +
        JSON.stringify(table.sampleData, null, 2) +
        '\n```\n\n';
  });
  return dbStructure;
}
</script>

<style>
body {
  min-height: 100vh;
}

#app {
  min-height: 100vh;
}

body::-webkit-scrollbar {
  width: 15px;
}

body::-webkit-scrollbar-track {
  background: #f1f5f9;
  border-radius: 8px;
}

body::-webkit-scrollbar-thumb {
  background: #6366f1;
  border-radius: 8px;
  border: 2px solid #f1f5f9;
}

body::-webkit-scrollbar-thumb:hover {
  background: #4f46e5;
}

textarea {
  border: 1px solid #e5e7eb;
  padding: 1rem 1.25rem;
  margin: 0.75rem 0;
  line-height: 1.6;
  font-size: 0.975rem;
  transition: all 0.2s ease-in-out;
  background-color: #f9fafb;
}

textarea:focus {
  outline: none;
  border-color: #4F46E5;
  box-shadow: 0 0 0 3px rgba(79, 70, 229, 0.1);
  background-color: #ffffff;
}

textarea::placeholder {
  color: #9ca3af;
  font-size: 0.875rem;
}

.vuepress-markdown-body:not(.custom) {
  padding: 0 !important;
}

.v-md-editor--preview {
  padding-bottom: 1.5rem;
}

/* 自定义复制按钮样式 */
.v-md-copy-code-btn {
  color: white !important;
  padding: 4px 8px !important;
  font-size: 12px !important;
  border-radius: 4px !important;
  opacity: 0.9 !important;
  transition: all 0.3s ease !important;
  cursor: pointer !important;
}

.v-md-copy-code-btn:hover {
  opacity: 1 !important;
}

.v-md-copy-code-btn.copied {
  background-color: #10b981 !important;
}

/* 调整代码块样式以适应复制按钮 */
.v-md-editor .code-block {
  position: relative;
  padding-top: 2.5em !important;
}

#chartContainer {
  width: 100%;
  background: #fff;
  border-radius: 0.375rem;
  padding: 1rem;
}

.v-md-prism-sql::-webkit-scrollbar {
  width: 15px;
  height: 15px;
}

.v-md-prism-sql::-webkit-scrollbar-track {
  background: #f1f5f9;
  border-radius: 8px;
}

.v-md-prism-sql::-webkit-scrollbar-thumb {
  background: #6366f1;
  border-radius: 8px;
  border: 2px solid #f1f5f9;
}

.v-md-prism-sql::-webkit-scrollbar-thumb:hover {
  background: #4f46e5;
}
</style>


 1012
1012

 被折叠的 条评论
为什么被折叠?
被折叠的 条评论
为什么被折叠?
 到【灌水乐园】发言


