


OSWatch是Oracle提供的一个轻量级的操作系统监控工具,之所以说轻量级,一方面是因为无需安装,开箱即用,另一方面,他调用的都是一些系统级的命令,例如top、iostat、netstat,控制好调用频率,消耗就可控。
可以支持主流的操作系统(AIX、LINUX、Solaris、HP-UX、WINDOWS)。
OSWatch的安装文件可以从这篇MOS下载,
OSWatcher (Includes: [Video]) (Doc ID 301137.1)。
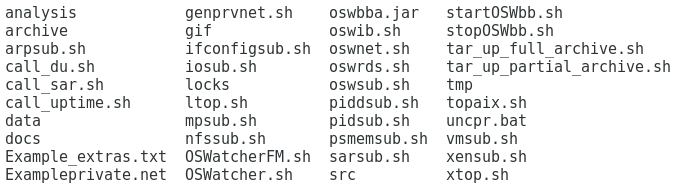
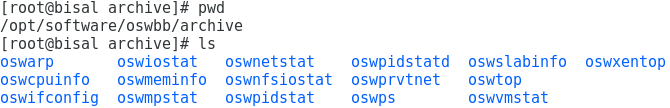
下载的最新版,解压后,目录结构如下,
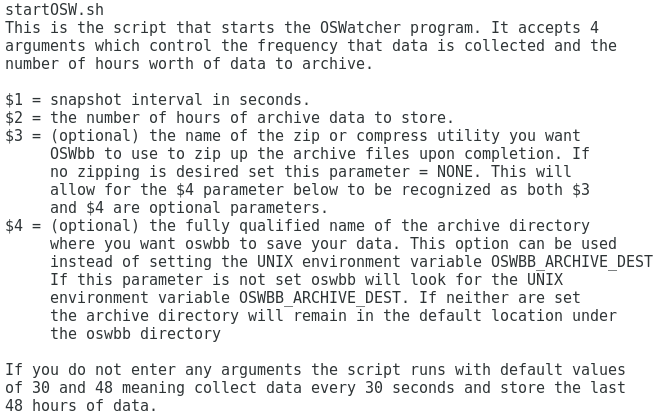
运行OSWatch,只需要执行startOSWbb.sh,根据这个脚本的内容注释,他可以接4个参数,
$1,采集快照的间隔,单位是秒。
$2,数据存储的时间,单位是小时。
$3和$4是可选的参数,压缩命令和归档文件夹名称。
其实这些参数,都可不输入,默认按照30秒采集一次存储2天的数据,
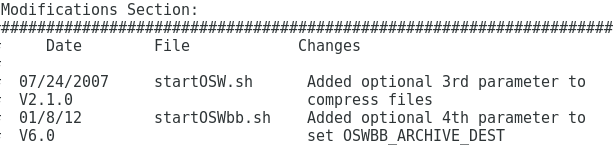
可以看到,以前这个脚本,叫startOSW.sh,从6.0开始,改为startOSWbb.sh,并且支持第四个参数,
脚本内容很简单,判断下当前是否存在正运行的OSWatch,然后就调用OSWatcher.sh,
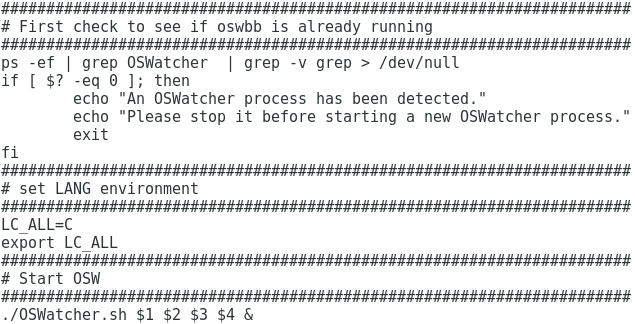
真正的精髓就是OSWatcher.sh,一共1700多行,各种判断调用,考虑了各种环境,风格和细节上,还是很值得学习。
启动这个脚本,他会验证各种要执行的指令,然后就开始30秒一次的采集,
P.S. 可选择后台执行,nohup sh startOSWbb.sh 30 1&
[root@bisal oswbb]# ./startOSWbb.sh 30 1
[root@bisal oswbb]# Setting the archive log directory to/opt/software/oswbb/archive


Testing for discovery of OS Utilities...
VMSTAT found on your system.
IOSTAT found on your system.
MPSTAT found on your system.
IP found on your system.
TOP found on your system.
PIDSTAT found on your system.
NFSIOSTAT found on your system.
TRACEROUTE found on your system.


Discovery of CPU CORE COUNT
CPU CORE COUNT will be used by oswbba to automatically look for cpu problems


CPU CORE COUNT = 1
VCPUS/THREADS = 1


Discovery completed.


Starting OSWatcher v8.4.0  on Wed Jun 2 09:32:06 CST 2021
With SnapshotInterval = 30
With ArchiveInterval = 1


OSWatcher - Written by Carl Davis, Center of Expertise,
Oracle Corporation
For questions on install/usage please go to MOS (Note:301137.1)


Data is stored in directory: /opt/software/oswbb/archive


Starting Data Collection...


oswbb heartbeat:Wed Jun 2 21:32:11 CST 2021
oswbb heartbeat:Wed Jun 2 21:32:41 CST 2021
如果停止脚本,可以杀进程,或者执行stopOSW.sh
[root@bisal oswbb]# ./stopOSW.sh
采集完成,数据会存在archive,
oswatch支持数据分析,看起来更直观,执行这个oswbba.jar,就进入了交互模式,最新版本要求java版本在8以上,
[root@bisal oswbb]# java -jar oswbba.jar -i /opt/software/oswbb/archive/


Starting OSW Analyzer V8.4.0
OSWatcher Analyzer Written by Oracle Center of Expertise
Copyright (c)  2019 by Oracle Corporation


Parsing Data. Please Wait...


Scanning file headers for version and platform info...


Parsing file bisal_pidstat_21.06.02.0900.dat ...


Parsing file bisal_iostat_21.06.02.0900.dat ...
This directory already exists. Rewriting...


Parsing file bisal_vmstat_21.06.02.0900.dat ...


Parsing file bisal_netstat_21.06.02.0900.dat ...


Parsing file bisal_top_21.06.02.0900.dat ...


Parsing file bisal_ps_21.06.02.0900.dat ...


Parsing Completed.


Enter 1 to Display CPU Process Queue Graphs
Enter 2 to Display CPU Utilization Graphs
Enter 3 to Display CPU Other Graphs
Enter 4 to Display Memory Graphs
Enter 5 to Display Disk IO Graphs
Enter 61 to Display Individual OS Process I/O RPS Graphs
Enter 62 to Display Individual OS Process I/O WPS Graphs
Enter 63 to Display Individual OS Process Percent User CPU Graphs
Enter 64 to Display Individual OS Process Percent System CPU Graphs
Enter 65 to Display Individual OS Process Percent Total CPU (User + System) Graphs
Enter 66 to Display Individual OS Process Percent Memory Graphs


Enter GP to Generate Individual Process Profile
Enter GC to Generate All CPU Gif Files
Enter GM to Generate All Memory Gif Files
Enter GD to Generate All Disk Gif Files
Enter GN to Generate All Network Gif Files


Enter L to Specify Alternate Location of Gif Directory
Enter Z to Zoom Graph Time Scale (Does not change analysis dataset)
Enter B to Returns to Baseline Graph Time Scale (Does not change analysis dataset)
Enter R to Remove Currently Displayed Graphs


Enter X to Export Parsed Data to Flat File
Enter S to Analyze Subset of Data(Changes analysis dataset including graph time scale)
Enter A to Analyze Data
Enter D to Generate DashBoard


Enter Q to Quit Program


Please Select an Option:
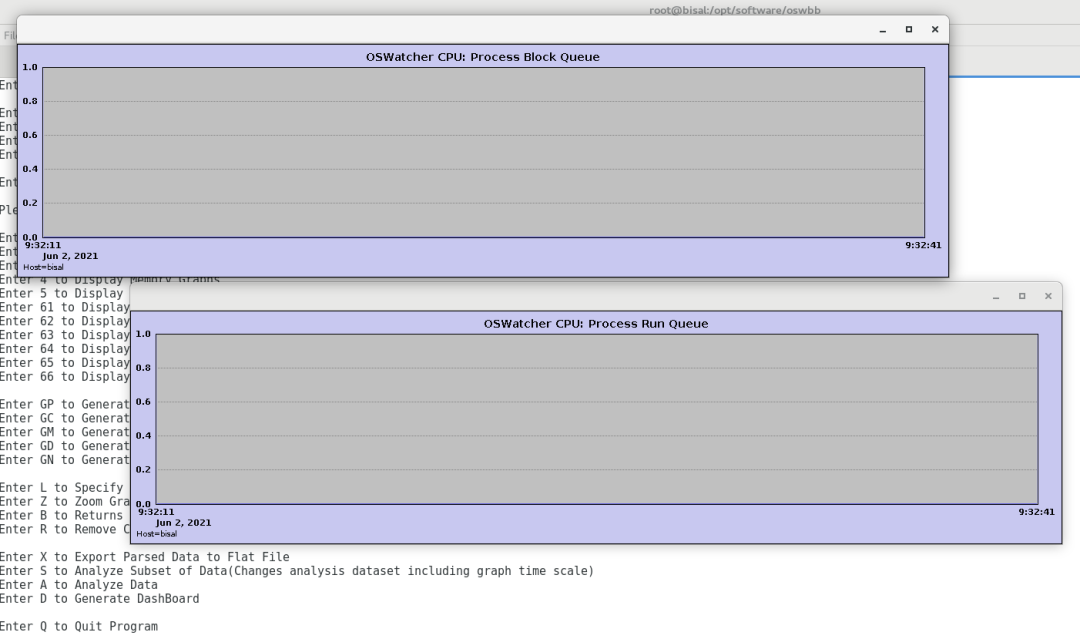
提供了很多选项,不同选项,会对应了不同的数据结果集,例如选择1,会展示CPU进程队列的图示信息,
Please Select an Option:1
应该就是java AWT,
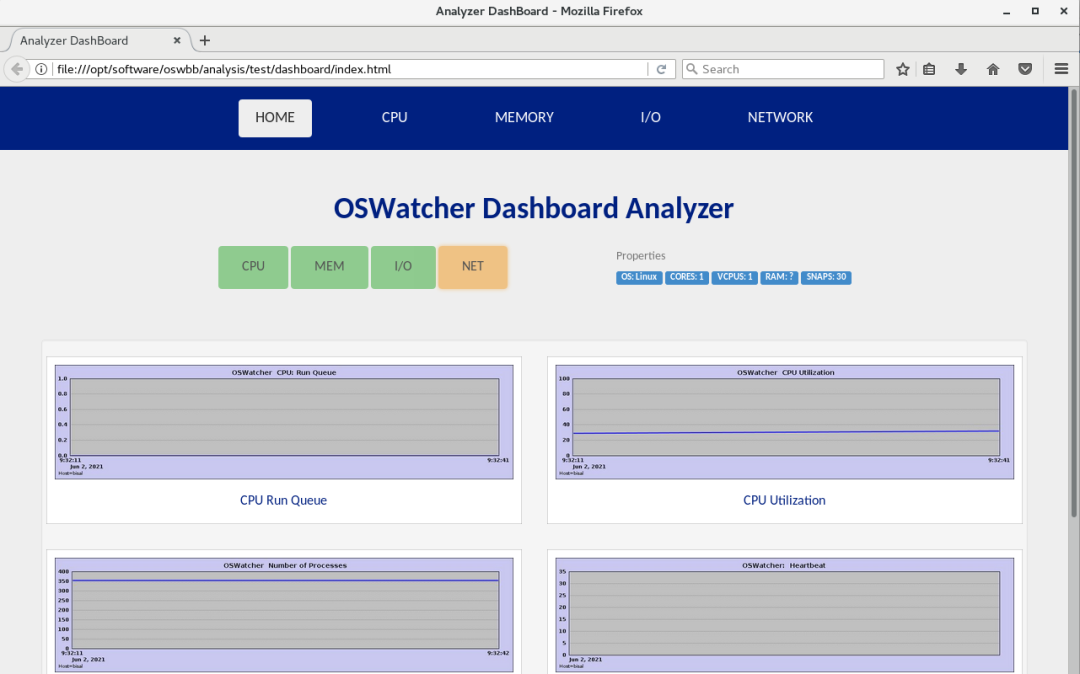
另外一个实用的功能,就是能生成dashboard,相当于汇总数据,输入D,可指定他存储的文件夹名称,
Please Select an Option:D
Enter a unique analysis/dashboard directory name or enter <CR> to accept default name:test


A new analysis file analysis/test/analysis.txt has been created.
Generating file analysis/test/dashboard/generated_files/OSWg_OS_Run_Queue.jpg
Generating file analysis/test/dashboard/generated_files/OSWg_OS_Run_Adjusted_Queue.jpg
Generating file analysis/test/dashboard/generated_files/OSWg_OS_Block_Queue.jpg
Generating file analysis/test/dashboard/generated_files/OSWg_OS_HB.jpg
Generating file analysis/test/dashboard/generated_files/OSWg_PS_Processes.jpg
Generating file analysis/test/dashboard/generated_files/OSWg_OS_Cpu_Idle.jpg
Generating file analysis/test/dashboard/generated_files/OSWg_OS_Cpu_Util.jpg
Generating file analysis/test/dashboard/generated_files/OSWg_OS_Cpu_System.jpg
Generating file analysis/test/dashboard/generated_files/OSWg_OS_Cpu_User.jpg
Generating file analysis/test/dashboard/generated_files/OSWg_OS_Cpu_Wa.jpg
Generating file analysis/test/dashboard/generated_files/OSWg_OS_Cpu_Interrupts.jpg
Generating file analysis/test/dashboard/generated_files/OSWg_OS_Context_Switches.jpg
Generating file analysis/test/dashboard/generated_files/OSWg_OS_Memory_Swap.jpg
Generating file analysis/test/dashboard/generated_files/OSWg_OS_Memory_Free.jpg
Generating file analysis/test/dashboard/generated_files/OSWg_OS_Memory_Page_In_Rate.jpg
Generating file analysis/test/dashboard/generated_files/OSWg_OS_Memory_Page_Out_Rate.jpg
Generating file analysis/test/dashboard/generated_files/OSWg_OS_Cpu_Wa.jpg
Generating file analysis/test/dashboard/generated_files/OSWg_OS_Block_Queue.jpg
Generating file analysis/test/dashboard/generated_files/OSWg_OS_IO_ST.jpg
Generating file analysis/test/dashboard/generated_files/OSWg_OS_IO_AW.jpg
Generating file analysis/test/dashboard/generated_files/OSWg_OS_IO_PB.jpg
Generating file analysis/test/dashboard/generated_files/OSWg_OS_IO_RPS.jpg
Generating file analysis/test/dashboard/generated_files/OSWg_OS_IO_WPS.jpg
Generating file analysis/test/dashboard/generated_files/OSWg_OS_IO_TPS.jpg
Generating file analysis/test/dashboard/generated_files/OSWg_link_ virbr0_rx_ok.jpg
Generating file analysis/test/dashboard/generated_files/OSWg_link_ virbr0_rx_err.jpg
Generating file analysis/test/dashboard/generated_files/OSWg_link_ virbr0_rx_drp.jpg
Generating file analysis/test/dashboard/generated_files/OSWg_link_ virbr0_rx_ovr.jpg
Generating file analysis/test/dashboard/generated_files/OSWg_link_ virbr0_tx_ok.jpg
Generating file analysis/test/dashboard/generated_files/OSWg_link_ virbr0_tx_err.jpg
Generating file analysis/test/dashboard/generated_files/OSWg_link_ virbr0_tx_drp.jpg
Generating file analysis/test/dashboard/generated_files/OSWg_link_ virbr0_tx_ovr.jpg
Generating file analysis/test/dashboard/generated_files/OSWg_link_ virbr0-nic_rx_ok.jpg
Generating file analysis/test/dashboard/generated_files/OSWg_link_ virbr0-nic_rx_err.jpg
Generating file analysis/test/dashboard/generated_files/OSWg_link_ virbr0-nic_rx_drp.jpg
Generating file analysis/test/dashboard/generated_files/OSWg_link_ virbr0-nic_rx_ovr.jpg
Generating file analysis/test/dashboard/generated_files/OSWg_link_ virbr0-nic_tx_ok.jpg
Generating file analysis/test/dashboard/generated_files/OSWg_link_ virbr0-nic_tx_err.jpg
Generating file analysis/test/dashboard/generated_files/OSWg_link_ virbr0-nic_tx_drp.jpg
Generating file analysis/test/dashboard/generated_files/OSWg_link_ virbr0-nic_tx_ovr.jpg
Generating file analysis/test/dashboard/generated_files/OSWg_link_ lo_rx_ok.jpg
Generating file analysis/test/dashboard/generated_files/OSWg_link_ lo_rx_err.jpg
Generating file analysis/test/dashboard/generated_files/OSWg_link_ lo_rx_drp.jpg
Generating file analysis/test/dashboard/generated_files/OSWg_link_ lo_rx_ovr.jpg
Generating file analysis/test/dashboard/generated_files/OSWg_link_ lo_tx_ok.jpg
Generating file analysis/test/dashboard/generated_files/OSWg_link_ lo_tx_err.jpg
Generating file analysis/test/dashboard/generated_files/OSWg_link_ lo_tx_drp.jpg
Generating file analysis/test/dashboard/generated_files/OSWg_link_ lo_tx_ovr.jpg
Generating file analysis/test/dashboard/generated_files/OSWg_link_ ens33_rx_ok.jpg
Generating file analysis/test/dashboard/generated_files/OSWg_link_ ens33_rx_err.jpg
Generating file analysis/test/dashboard/generated_files/OSWg_link_ ens33_rx_drp.jpg
Generating file analysis/test/dashboard/generated_files/OSWg_link_ ens33_rx_ovr.jpg
Generating file analysis/test/dashboard/generated_files/OSWg_link_ ens33_tx_ok.jpg
Generating file analysis/test/dashboard/generated_files/OSWg_link_ ens33_tx_err.jpg
Generating file analysis/test/dashboard/generated_files/OSWg_link_ ens33_tx_drp.jpg
Generating file analysis/test/dashboard/generated_files/OSWg_link_ ens33_tx_ovr.jpg
Generating file analysis/test/dashboard/generated_files/OSWg_IpOutRequests.jpg
Generating file analysis/test/dashboard/generated_files/OSWg_IpInReceives.jpg
Generating file analysis/test/dashboard/generated_files/OSWg_IpFragCreates.jpg
Generating file analysis/test/dashboard/generated_files/OSWg_IpFragOKs.jpg
Generating file analysis/test/dashboard/generated_files/OSWg_IpInDiscards.jpg
Generating file analysis/test/dashboard/generated_files/OSWg_IpReasmFails.jpg
Generating file analysis/test/dashboard/generated_files/OSWg_ip_fragments_in_rate.jpg
Generating file analysis/test/dashboard/generated_files/OSWg_ip_fragments_out_rate.jpg
Generating file analysis/test/dashboard/generated_files/OSWg_UdpInDatagrams.jpg
Generating file analysis/test/dashboard/generated_files/OSWg_UdpOutDatagrams.jpg
Generating file analysis/test/dashboard/generated_files/OSWg_UdpInErrors.jpg
Generating file analysis/test/dashboard/generated_files/OSWg_UdpInCsumErrors.jpg
Generating file analysis/test/dashboard/generated_files/OSWg_UdpRcvbufErrors.jpg
Generating file analysis/test/dashboard/generated_files/OSWg_UdpSndbufErrors.jpg
Generating file analysis/test/dashboard/generated_files/OSWg_TcpInSegs.jpg
Generating file analysis/test/dashboard/generated_files/OSWg_TcpOutSegs.jpg
Generating file analysis/test/dashboard/generated_files/OSWg_TcpRetransSegs.jpg
Generating file analysis/test/dashboard/generated_files/OSWg_TcpOutRsts.jpg
Generating file analysis/test/dashboard/generated_files/OSWg_TcpEstabResets.jpg
Generating file analysis/test/dashboard/generated_files/OSWg_TcpAttemptFails.jpg
Generating file analysis/test/dashboard/generated_files/OSWg_tcp_retran_error_rate.jpg
Files written to the analysis directory.
从输出可以看到,生成一系列HTML文件,文件夹中会生成两个文件,
[root@bisal oswbb]# cd analysis/test/
[root@bisal test]# ls
analysis.txt  dashboard
一个是文本文件,汇总了相关数据,如下是章节,
############################################################################
# Contents of This Report:
#
# Section 1: System Status
# Section 2: System Slowdowns
#   Section 2.1: System Slowdown RCA Process Level Ordered By Impact
# Section 3: System General Findings
# Section 4: CPU Detailed Findings
#   Section 4.1: CPU Run Queue:
#   Section 4.2: CPU Utilization: Percent Busy
#   Section 4.3: CPU Utilization: Percent Sys
# Section 5: Memory Detailed Findings
#   Section 5.1: Memory: Process Swap Queue
#   Section 5.2: Memory: Scan Rate
#   Section 5.3  Memory: Page In:
#   Section 5.4  Memory: Page Out:
#   Section 5.5  Memory: Page Tables (Linux only):
#   Section 5.6: Top 5 Memory Consuming Processes Beginning
#   Section 5.7: Top 5 Memory Consuming Processes Ending
# Section 6: Disk Detailed Findings
#   Section 6.1: Disk Percent Utilization Findings
#   Section 6.2: Disk Service Times Findings
#   Section 6.3: Disk Wait Queue Times Findings
#   Section 6.4: Disk Throughput Findings
#   Section 6.5: Disk Reads per Second
#   Section 6.6: Disk Writes per Second
#   Section 6.7: Disk Percent CPU waiting on I/O
# Section 7: Network Detailed Findings
#   Section 7.1  Network Data Link Findings
#   Section 7.2: Network IP Findings
#   Section 7.3: Network UDP Findings
#   Section 7.4: Network TCP Findings
#   Section 7.5: Network Private Interconnect Findings
# Section 8: Process Detailed Findings
#   Section 8.1: PS Process Summary Ordered By Time
#   Section 8.2: PS for Processes with Status = D or T Ordered By Time
#   Section 8.3: PS for (Processes with CPU > 0) When System Idle CPU < 30% Ordered By Time
#   Section 8.4: Top VSZ Processes Increasing Memory per Snapshot
#   Section 8.5: Top RSS Processes Increasing Memory per Snapshot
#   Section 8.6: New Processes Created Since Last Snapshot
#   Section 8.7: Exiting Processes since Last Snapshot
#
另外一个就是HTML的文件,可以打开index.html,
[root@bisal oswbb]# cd dashboard
[root@bisal dashboard]# ls
css  fonts  generated_files  images  index.html  js
图形化展示了采集到的数据,可以点击不同的维度,查看不同的数据,方便且直观,还是比较有用的,
参考文献,
OSWatcher (Includes: [Video]) (Doc ID 301137.1)
OSWatcher Analyzer User Guide (Doc ID 461053.1)
近期更新的文章:
文章分类和索引:


 1960
1960

 被折叠的 条评论
为什么被折叠?
被折叠的 条评论
为什么被折叠?
 到【灌水乐园】发言


