


完整代码
import numpy as np
import logging
import sys
import pandas as pd
class CyrusMIC(object):
logger = logging.getLogger()
logger.setLevel(logging.INFO)
screen_handler = logging.StreamHandler(sys.stdout)
screen_handler.setLevel(logging.INFO)
formatter = logging.Formatter('%(asctime)s - %(module)s.%(funcName)s:%(lineno)d - %(levelname)s - %(message)s')
screen_handler.setFormatter(formatter)
logger.addHandler(screen_handler)
def __init__(self,x_num=[None,None],y_num=[None,None]):
self.x_max_num = x_num[1]
self.x_min_num = x_num[0]
self.y_min_num = y_num[0]
self.y_max_num = y_num[1]
self.x = None
self.y = None
def cal_mut_info(self,p_matrix):
"""
计算互信息值
:param p_matrix: 变量X和Y的构成的概率矩阵
:return: 互信息值
"""
mut_info = 0
p_matrix = np.array(p_matrix)
for i in range(p_matrix.shape[0]):
for j in range(p_matrix.shape[1]):
if p_matrix[i,j] != 0:
mut_info += p_matrix[i,j]*np.log2(p_matrix[i,j]/(p_matrix[i,:].sum()*p_matrix[:,j].sum()))
self.logger.info("信息系数为:{}".format(mut_info/np.log2(min(p_matrix.shape[0],p_matrix.shape[1]))))
return mut_info/np.log2(min(p_matrix.shape[0],p_matrix.shape[1]))
def divide_bin(self,x_num,y_num):
"""
指定在两个变量方向上需划分的网格数,返回概率矩阵
:param x_num:
:param y_num:
:return: p_matrix
"""
p_matrix = np.zeros([x_num,y_num])
x_bin = np.linspace(self.x.min(),self.x.max()+1,x_num+1)
y_bin = np.linspace(self.y.min(),self.y.max()+1,y_num+1)
for i in range(x_num):
for j in range(y_num):
p_matrix[i,j] = sum([1 if (self.x[value] < x_bin[i + 1] and self.x[value] >= x_bin[i] and self.y[value] < y_bin[j + 1] and
self.y[value] >= y_bin[j]) else 0 for value in range(self.x.shape[0])])/self.x.shape[0]
return p_matrix
def cal_MIC(self,x,y):
self.x = np.array(x).reshape((-1,))
self.y = np.array(y).reshape((-1,))
if not self.x_max_num:
self.x_max_num = int(round(self.x.shape[0]**0.3,0))
self.y_max_num = self.x_max_num
self.x_min_num = 2
self.y_min_num = 2
mics = []
for i in range(self.x_min_num,self.x_max_num+1):
for j in range(self.y_min_num,self.x_max_num+1):
self.logger.info("划分区间数量为:[{},{}]".format(i,j))
mics.append(self.cal_mut_info(self.divide_bin(i,j)))
self.logger.info("最大信息系数为:{}".format(max(mics)))
return max(mics)
if __name__ == '__main__':
import matplotlib.pyplot as plt
from matplotlib.font_manager import FontProperties
font_set = FontProperties(fname=r"c:\windows\fonts\simsun.ttc", size=15)
df = pd.read_excel("xxx.xls")
x = df['a']
y = df['b']
fig = plt.figure(figsize=(5, 5))
ax = fig.add_subplot(1, 1, 1)
ax.set_title('xxx', fontsize=11, fontstyle='oblique', fontproperties=font_set)
ax.set_xlabel('xxx', fontsize=11, fontfamily='sans-serif', fontstyle='italic', fontproperties=font_set)
ax.set_ylabel('xxx', fontsize=11, fontstyle='oblique', fontproperties=font_set)
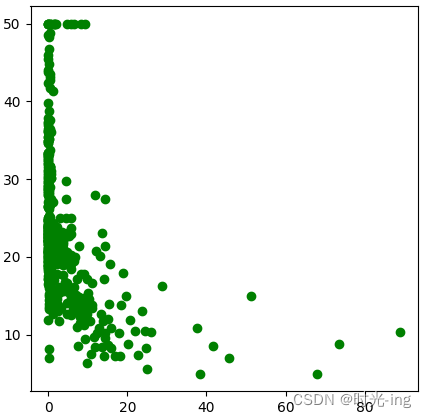
plt.scatter(x, y, c='g')
mic_tool = CyrusMIC()
mic_tool.cal_MIC(x, y)
plt.show()
效果展示


 6374
6374


 被折叠的 条评论
为什么被折叠?
被折叠的 条评论
为什么被折叠?
 到【灌水乐园】发言


