


MyPerf4J的官方接入文档:https://github.com/LinShunKang/MyPerf4J。
一 MyPerf4J配置
# MyPerf4J 所有配置请参考:https://github.com/LinShunKang/MyPerf4J/wiki/%E9%85%8D%E7%BD%AE

# 配置监控应用的名称
app_name = MyApp

debug = true

###############################################################################
#                           Metrics Configuration                             #
###############################################################################

# 配置 MetricsExporter 类型
#	log.stdout: 	以标准格式化结构输出到 stdout.log
#	log.standard: 	以标准格式化结构输出到磁盘
#	log.influxdb: 	以 InfluxDB LineProtocol 格式输出到磁盘
#	http.influxdb: 	以 InfluxDB LineProtocol 格式发送至 InfluxDB server,需要另行增加 influxdb 的配置
metrics.exporter = http.influxdb

# 配置各项监控指标日志的文件路径
# 如果 metrics.exporter 配置为 log.influxdb,建议把所有的 metrics.log.* 路径配置成一样以方便 Telegraf 收集
metrics.log.method = /data/logs/MyPerf4J/metrics.log
metrics.log.class_loading = /data/logs/MyPerf4J/metrics.log
metrics.log.gc = /data/logs/MyPerf4J/metrics.log
metrics.log.memory = /data/logs/MyPerf4J/metrics.log
metrics.log.buff_pool = /data/logs/MyPerf4J/metrics.log
metrics.log.thread = /data/logs/MyPerf4J/metrics.log
metrics.log.file_desc = /data/logs/MyPerf4J/metrics.log
metrics.log.compilation = /data/logs/MyPerf4J/metrics.log


###############################################################################
#                           Filter Configuration                              #
###############################################################################

# 配置需要监控的package,可配置多个,用英文';'分隔
#   com.demo.p1 代表包含以 com.demo.p1 为前缀的所有包和类
#   [] 表示集合的概念:例如,com.demo.[p1,p2,p3] 代表包含以 com.demo.p1、com.demo.p2 和 com.demo.p3 为前缀的所有包和类,等价于 com.demo.p1;com.demo.p2;com.demo.p3
#   * 表示通配符:可以指代零个或多个字符,例如,com.*.demo.*
filter.packages.include = cn.perf4j.demo;com.midea.*;

# 配置不需要监控的package,可配置多个,用英文';'分隔
filter.packages.exclude = cn.perf4j.demo.dao.DemoDAOImpl


###############################################################################
#                           InfluxDB Configuration                              #
###############################################################################
influxdb.version=2.7.1
influxdb.orgName=root
influxdb.host = 127.0.0.1
influxdb.port = 8086
influxdb.database = MyPerf4J
influxdb.username = root
influxdb.password = 12345678
influxdb.conn_timeout =	3000
influxdb.read_timeout = 5000
- metrics.exporter配置成
http.influxdb,注意后面别带冒号,我把后面的冒号复制过来后,排查了很久 - influxdb.database务必配置成
MyPerf4J,否则grafana要改动的地方很多 - debug = true,方便排查问题
二 应用程序配置
应用启动参数添加两项配置
-javaagent:/Users/**/work/develop_tools/MyPerf4J-ASM-3.4.0-SNAPSHOT/MyPerf4J-ASM-3.4.0-SNAPSHOT.jar
-DMyPerf4JPropFile=/Users/**/work/develop_tools/MyPerf4J-ASM-3.4.0-SNAPSHOT/MyPerf4J.properties
启动应用程序, 通过respStatus判断跟influxDB交互是否成功
2023-10-20 09:55:00.147 [MyPerf4J] DEBUG [MyPerf4J-InfluxDbV2Client_0] InfluxDbV2Client.writeMetricsSync(): respStatus='204 No Content', reqBody=jvm_thread_metrics,AppName=MyApp,host=lvsheng1-Mac666.local TotalStarted=178i,Active=112i,Peak=112i,Daemon=81i,New=0i,Runnable=20i,Blocked=0i,Waiting=58i,TimedWaiting=34i,Terminated=0i 1697766840008000000
2023-10-20 09:55:00.172 [MyPerf4J] DEBUG [MyPerf4J-InfluxDbV2Client_0] InfluxDbV2Client.writeMetricsSync(): respStatus='204 No Content', reqBody=jvm_compilation_metrics,AppName=MyApp,host=lvsheng1-Mac666.local Time=606i,TotalTime=29697i 1697766840008000000
2023-10-20 09:55:00.197 [MyPerf4J] DEBUG [MyPerf4J-InfluxDbV2Client_0] InfluxDbV2Client.writeMetricsSync(): respStatus='204 No Content', reqBody=jvm_file_descriptor_metrics,AppName=MyApp,host=lvsheng1-Mac666.local OpenCount=416i,OpenPercent=4.0625 1697766840008000000
2023-10-20 09:55:00.226 [MyPerf4J] DEBUG [MyPerf4J-InfluxDbV2Client_0] InfluxDbV2Client.writeMetricsSync(): respStatus='204 No Content', reqBody=method_metrics,AppName=MyApp,ClassName=Scheduler,Method=Scheduler.run(),Type=General,Level=Others,host=lvsheng1-Mac666.local TotalTimePercent=0.0011666666666666668,RPS=0i,Avg=11.67,Min=3i,Max=39i,StdDev=13.19,Count=6i,TP50=4i,TP90=39i,TP95=39i,TP99=39i,TP999=39i,TP9999=39i 1697766840014000000
method_metrics,AppName=MyApp,ClassName=JvmInfo,Method=JvmInfo.getInstance(),Type=General,Level=Others,host=lvsheng1-Mac666.local TotalTimePercent=0.0,RPS=0i,Avg=0.00,Min=0i,Max=0i,StdDev=0.00,Count=1i,TP50=0i,TP90=0i,TP95=0i,TP99=0i,TP999=0i,TP9999=0i 1697766840014000000
method_metrics,AppName=MyApp,ClassName=HttpUtils,Method=HttpUtils.post(String\,\ Object),Type=General,Level=Utils,host=lvsheng1-Mac666.local TotalTimePercent=5.833333333333334E-4,RPS=0i,Avg=35.00,Min=35i,Max=35i,StdDev=0.00,Count=1i,TP50=35i,TP90=35i,TP95=35i,TP99=35i,TP999=35i,TP9999=35i 1697766840014000000
method_metrics,AppName=MyApp,ClassName=InfluxdbUtils,Method=InfluxdbUtils.writeJVM(MBeanServer\,\ Vector\,\ Vector),Type=General,Level=Utils,host=lvsheng1-Mac666.local TotalTimePercent=4.0E-4,RPS=0i,Avg=4.00,Min=2i,Max=8i,StdDev=1.91,Count=6i,TP50=3i,TP90=8i,TP95=8i,TP99=8i,TP999=8i,TP9999=8i 1697766840014000000
method_metrics,AppName=MyApp,ClassName=InfluxdbUtils,Method=InfluxdbUtils.handleCpuStatics(MBeanServer\,\ Vector),Type=General,Level=Utils,host=lvsheng1-Mac666.local TotalTimePercent=1.5E-4,RPS=0i,Avg=1.50,Min=0i,Max=9i,StdDev=3.35,Count=6i,TP50=0i,TP90=9i,TP95=9i,TP99=9i,TP999=9i,TP9999=9i 1697766840014000000
method_metrics,AppName=MyApp,ClassName=InfluxdbUtils,Method=InfluxdbUtils.formatSize(Object),Type=General,Level=Utils,host=lvsheng1-Mac666.local TotalTimePercent=0.0,RPS=2i,Avg=0.00,Min=0i,Max=0i,StdDev=0.00,Count=156i,TP50=0i,TP90=0i,TP95=0i,TP99=0i,TP999=0i,TP9999=0i 1697766840014000000
method_metrics,AppName=MyApp,ClassName=InfluxdbUtils,Method=InfluxdbUtils.formatTime(Object\,\ boolean),Type=General,Level=Utils,host=lvsheng1-Mac666.local TotalTimePercent=0.0,RPS=0i,Avg=0.00,Min=0i,Max=0i,StdDev=0.00,Count=6i,TP50=0i,TP90=0i,TP95=0i,TP99=0i,TP999=0i,TP9999=0i 1697766840014000000
method_metrics,AppName=MyApp,ClassName=InfluxdbUtils,Method=InfluxdbUtils.formaStr(String),Type=General,Level=Utils,host=lvsheng1-Mac666.local TotalTimePercent=0.0,RPS=0i,Avg=0.00,Min=0i,Max=0i,StdDev=0.00,Count=36i,TP50=0i,TP90=0i,TP95=0i,TP99=0i,TP999=0i,TP9999=0i 1697766840014000000
method_metrics,AppName=MyApp,ClassName=HeartBeatHelper,Method=HeartBeatHelper.startHeartBeat(),Type=General,Level=Others,host=lvsheng1-Mac666.local TotalTimePercent=0.0,RPS=0i,Avg=0.00,Min=0i,Max=0i,StdDev=0.00,Count=1i,TP50=0i,TP90=0i,TP95=0i,TP99=0i,TP999=0i,TP9999=0i 1697766840014000000
2023-10-20 09:56:00.001 [MyPerf4J] DEBUG [MyPerf4J-LightWeightScheduler-1] LightWeightScheduler.runTask(ProfilingFileGenerator, 1697766900000) cost: 1ms
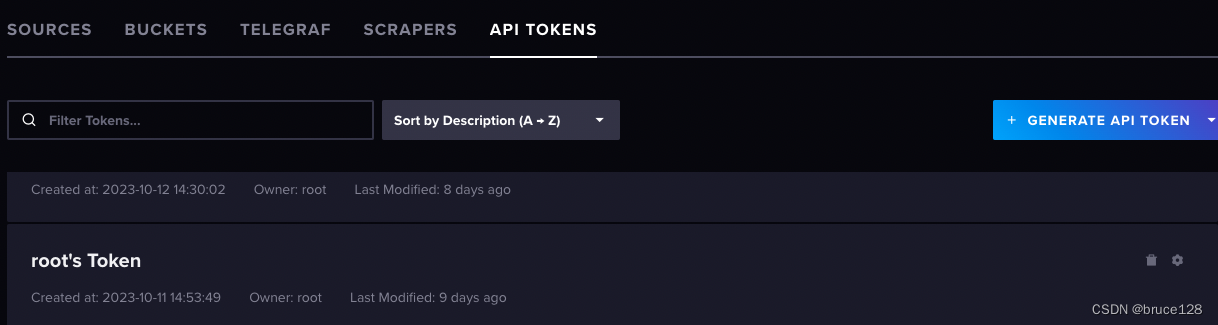
InfluxDB
下载最新版本后启动influxdb,登陆界面后会告诉你一个token,这个token需要记录下来。grafana配置的时候需要用。
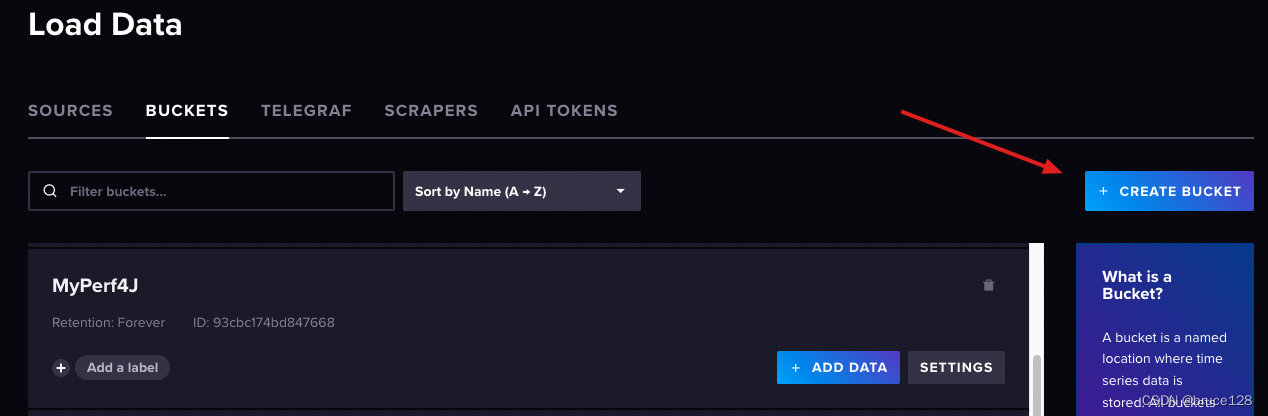
创建一个id为 MyPerf4J 的bucket,用于存储MyPerf4J的监控数据
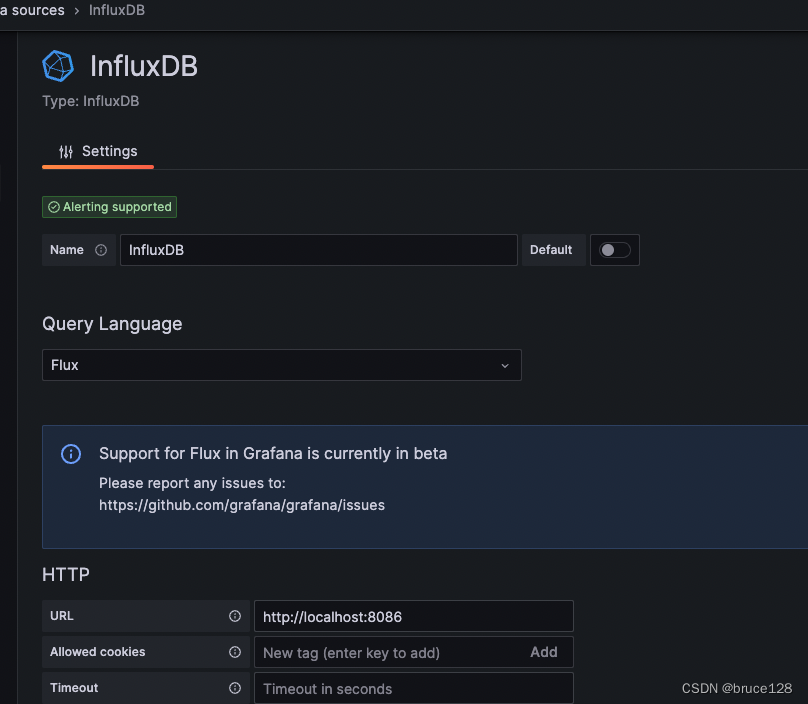
grafana
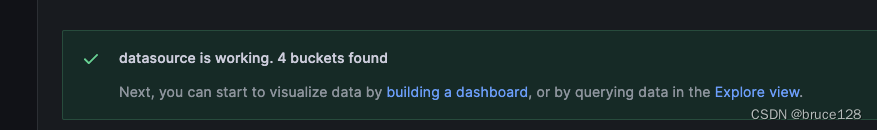
创建InfluxDB数据源, QueryLanguage选择Flux
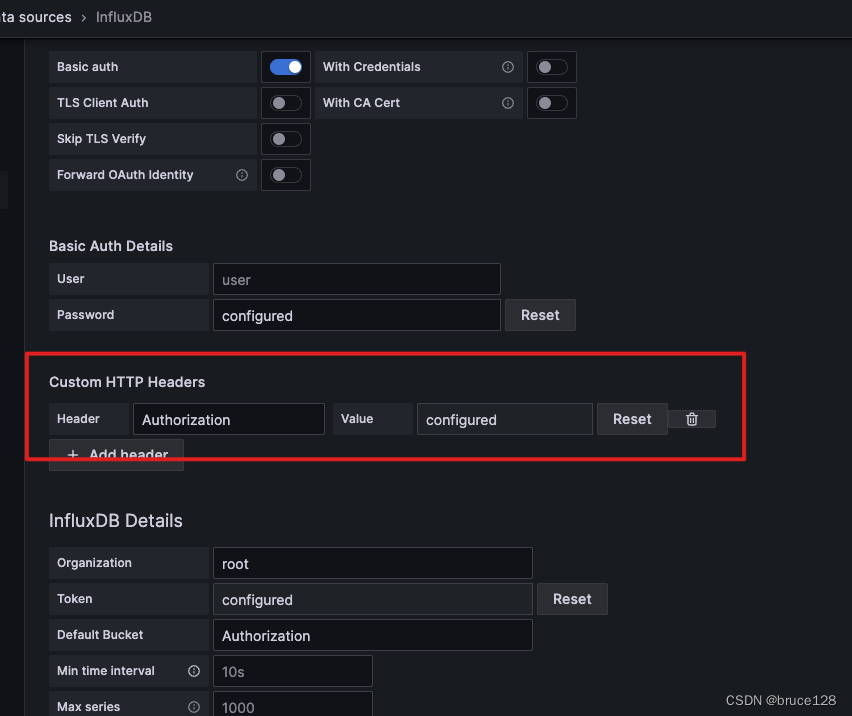
点击 Save & Test ,提示报这个,表示接入成功
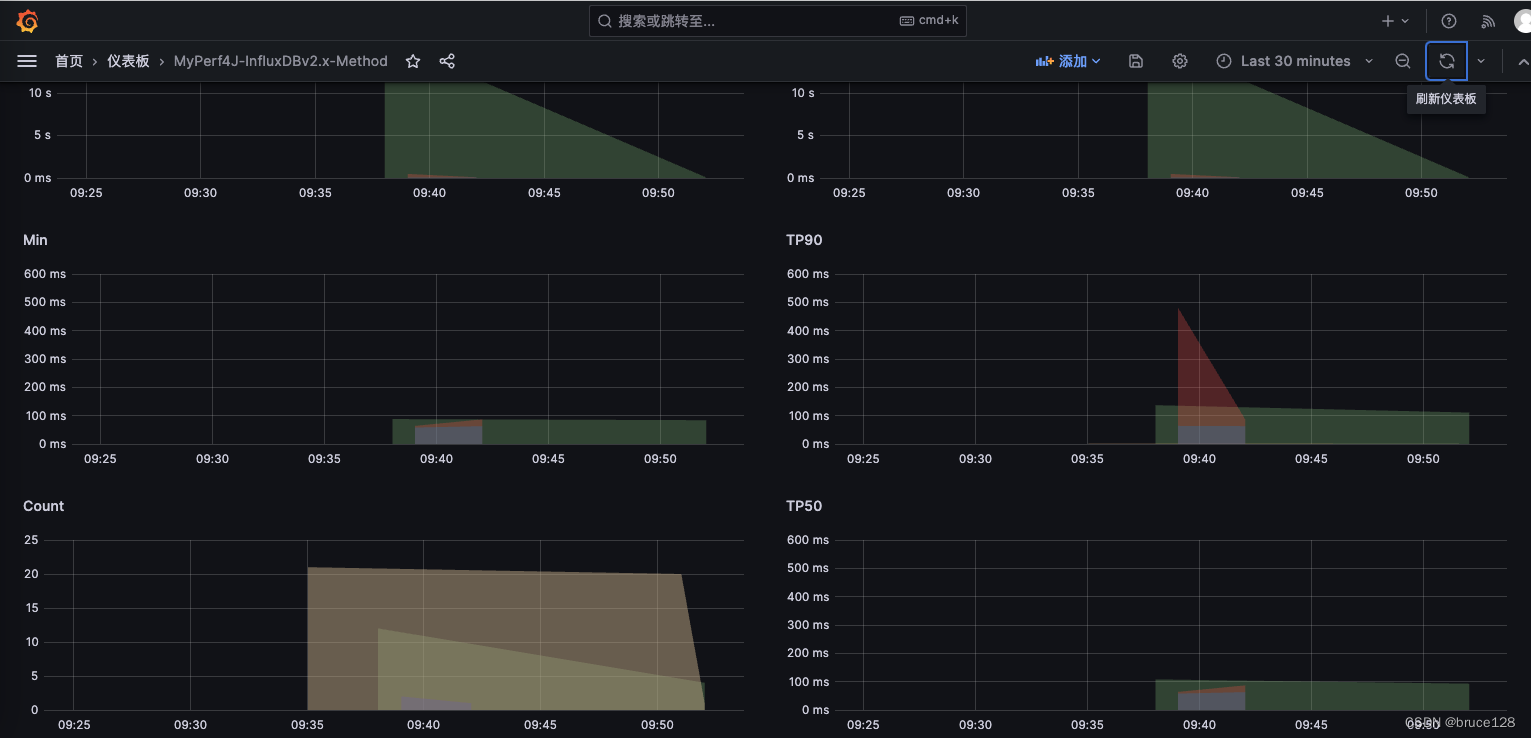
然后导入方法监控大盘 https://grafana.com/grafana/dashboards/15672-myperf4j-influxdbv2-0-method/,导入的时候选择刚刚创建好的influxdb数据源
方法监控效果


 被折叠的 条评论
为什么被折叠?
被折叠的 条评论
为什么被折叠?
 到【灌水乐园】发言


