


目录
1.用pandas的DataFrame写数据,然后写入Excile文件
1.用pandas的DataFrame写数据,然后写入Excile文件
如果报错的话检查一下自己的pip是否下载了openpyxl,用命令pip list 检查
import pandas as pd
pd.set_option('display.unicode.ambiguous_as_wide', True)
pd.set_option('display.unicode.east_asian_width', True)
place=['001','002','003','004']
mouth=['二月','四月','六月','八月','十月','十二月','地区']
count=[[10,30,15,55,40,20,'山东'],[20,37,8,23,19,10,'重庆'],
[23,19,10,37,12,19,'广东'],[26,8,41,33,15,35,'北京']]
news=pd.DataFrame(count)
news.index=place
news.columns=mouth
news=news.dropna()
df=news.to_excel('D:\PYtext\dailytest\date11_26\ews.xlsx')#将内容写入文件
file='D:\PYtext\dailytest\date11_26\ews.xlsx'
f=open(file,'rb')#打开相应文件
rf=pd.read_excel(f,index_col=0)
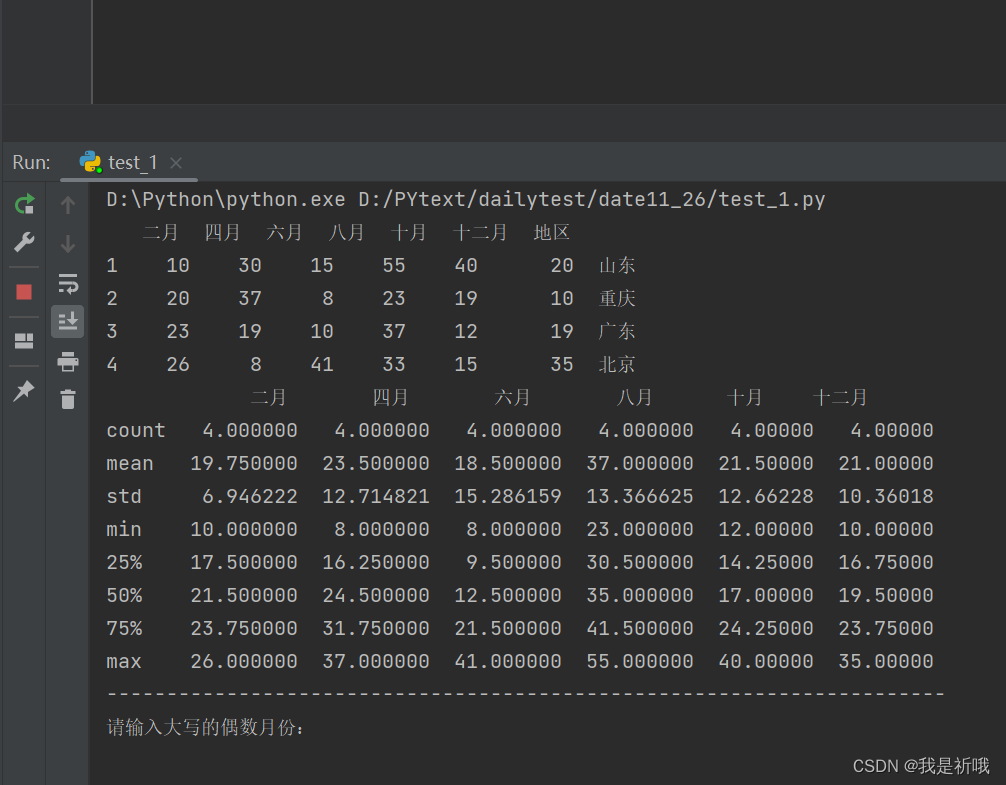
print(rf)
运行结果为:

得到的Excile文件是:

2.再使用matplotlib写出相应的代码
import numpy as np
import pandas as pd
import matplotlib.pyplot as plt
pd.set_option('display.unicode.ambiguous_as_wide', True)
pd.set_option('display.unicode.east_asian_width', True)
df=pd.read_excel('D:\PYtext\dailytest\date11_26\ews.xlsx',index_col=0)
print(df)
print(df.describe())
print('----------------------------------------------------------------------')
plt.rcParams['font.sans-serif']='FangSong'
plt.rcParams['axes.unicode_minus']=False
put=str(input('请输入大写的偶数月份:'))
er=df[f'{put}月']#输入相应的月份,显示相应月份的图表
print(er)
address=['山东','重庆','广东','北京']
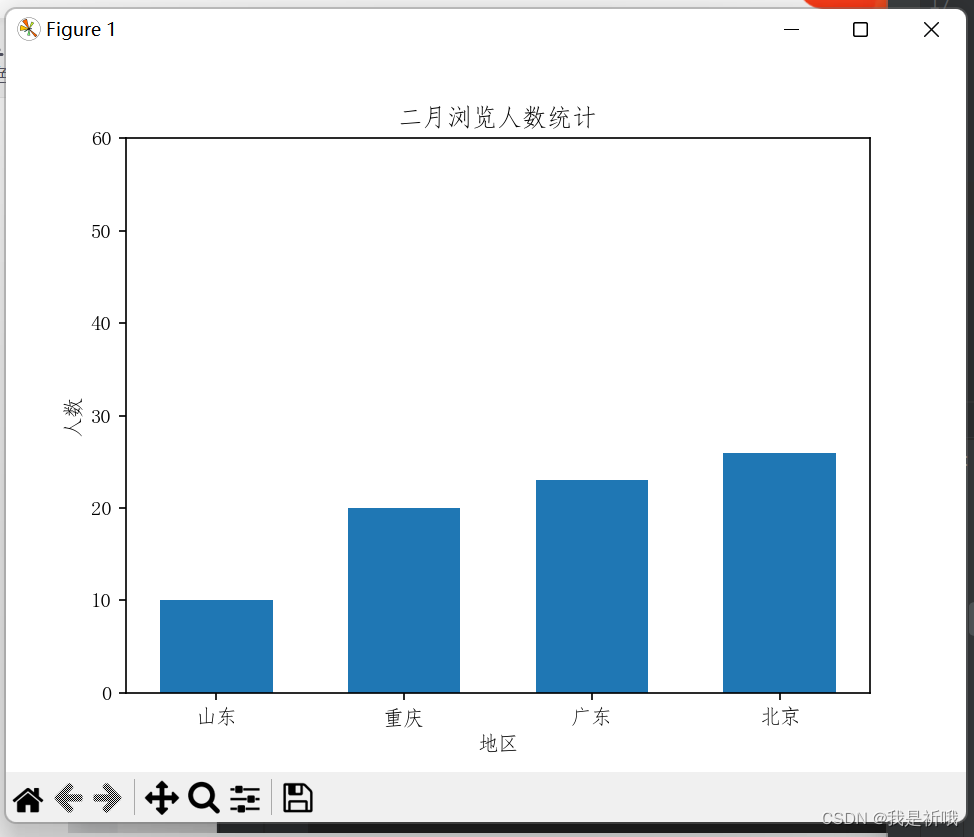
plt.title(f'{put}月浏览人数统计')
plt.ylabel('人数')
plt.xlabel('地区')
plt.bar(er.index,er.values,width=0.6)
plt.ylim(np.array([0,60]))
plt.xticks(range(1,5,1),address)#替换横坐标
plt.show()结果为:
根据条件输入月份,比如输入四,就可以得到以下结果:(以统计图的形式表示)

再比如输入二,可以得到:
主要就是对学过的东西的一个混合使用,也可以练一下


 506
506


 被折叠的 条评论
为什么被折叠?
被折叠的 条评论
为什么被折叠?
 到【灌水乐园】发言


