


1.概念
引力波:物理学中,引力波是因为时空弯曲对外以辐射形式传播的能量
爱因斯坦基于广义相对论预言了引力波的存在
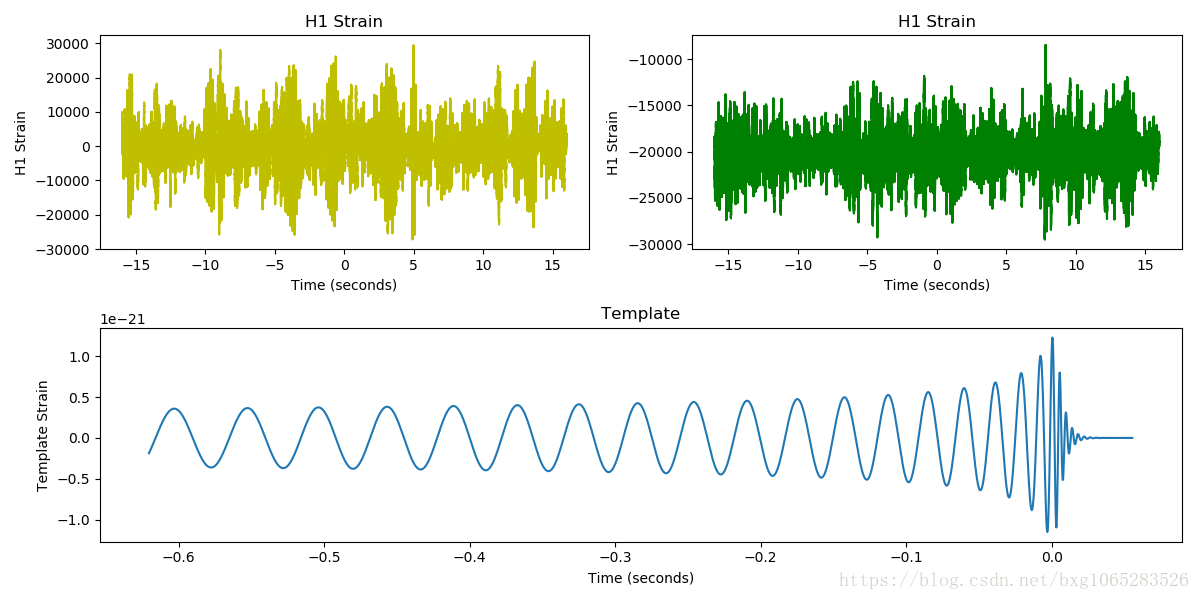
2015年9月14日,LIGO合作组宣布探测到首个引力波信号。 2016年6月16日,LIGO合作组宣布2015年12月26日03:38:53(UTC),两台不同位置的引力波探测器同时探测到了一个引力波信号。
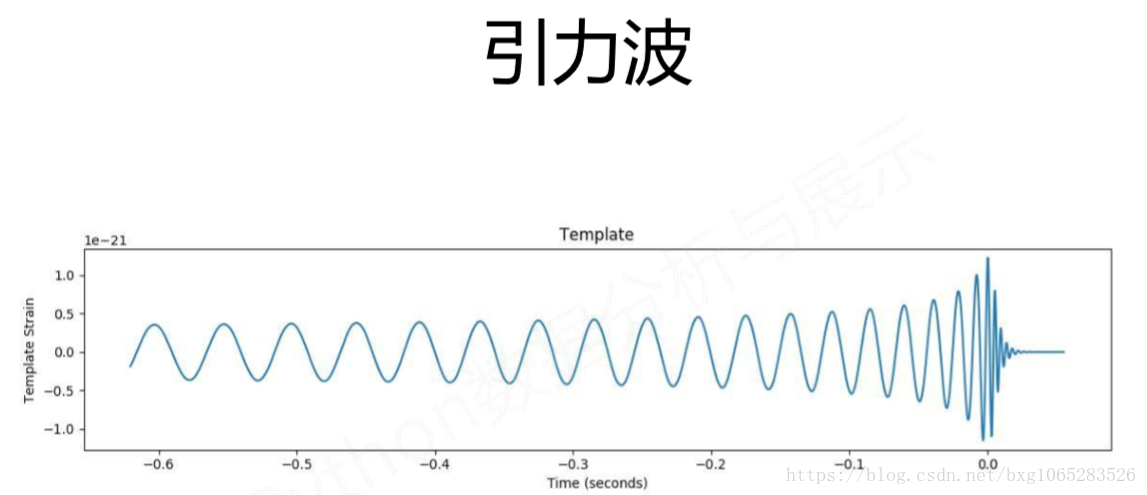
import numpy as np
import matplotlib.pyplot as plt
from scipy.io import wavfile
#从配置文档中读取时间相关数据
rate_h,hstrain =wavfile.read(r'H1_Strain.wav','rb')
rate_l,lstrain=wavfile.read(r'L1_Strain.wav','rb')
reftime,ref_H1=np.genfromtxt('wf_template.txt').transpose()

#读取应变数据
htime_interval =1/rate_h
ltime_interval =1/rate_l
htime_len =hstrain.shape[0]/rate_h
htime=np.arange(-htime_len/2,htime_len/2,htime_interval)
ltime_len=lstrain.shape[0]/rate_l
ltime=np.arange(-ltime_len/2,ltime_len/2,ltime_interval)

#使用来自“H1”探测器的数据作图
#创建一个大小为12*6的绘图空间
fig=plt.figure(figsize=(12,6))
#画出以时间为X轴,应变数据为Y轴的图像 并设置标题和坐标轴的标签
plth =fig.add_subplot(221)
plth.plot(htime,hstrain,'y')
plth.set_xlabel('Time (seconds)')
plth.set_ylabel('H1 Strain')
plth.set_title('H1 Strain')

pltl =fig.add_subplot(222)
pltl.plot(ltime,lstrain,'g')
pltl.set_xlabel('Time (seconds)')
pltl.set_ylabel('L1 Strain')
pltl.set_title('L1 Strain')

pltl =fig.add_subplot(222)
pltl.plot(ltime,lstrain,'g')
pltl.set_xlabel('Time (seconds)')
pltl.set_ylabel('H1 Strain')
pltl.set_title('H1 Strain')

pltlref =fig.add_subplot(212)
pltlref.plot(reftime,ref_H1)
pltlref.set_xlabel('Time (seconds)')
pltlref.set_ylabel('Template Strain')
pltlref.set_title('Template')
#自动调整图像外部边缘
fig.tight_layout()
#保存图像为PNG格式
plt.savefig("Gravitational_Waves_Original.png")
plt.show()
plt.close(fig)


 2177
2177

 被折叠的 条评论
为什么被折叠?
被折叠的 条评论
为什么被折叠?
 到【灌水乐园】发言


