


Matlab 绘图 曲线颜色自定义 同时组合图内间距小
- 确定绘制曲线的RGB颜色
- 根据RGB颜色将其除以255归一化到0-1,plot中选择属性’color’为RGB值即可。
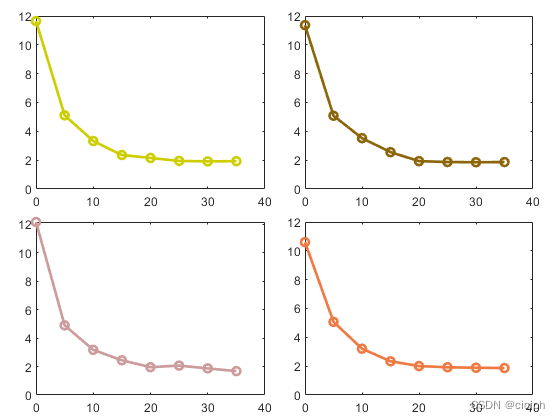
- 示例如下
rn = 2;  % The number of rows
cn = 2;  % The number of columns

% color1 = [34 139 34];
% color2 = [255 215 0];
% color3 = [205 92 92];
% color4 = [210 105 30];

color1 = [205 205 0];
color2 = [139 101 8];
color3 = [205 155 155];
color4 = [238 121 66];
linewidth1 = 2;
figure;
ha = tiledlayout(rn,cn,'TileSpacing','Compact','Padding','Compact');

X=[0	5	10	15	20 25 30 35];
Y=[11.6468	5.1099	3.326	2.3581	2.1535	1.9456	1.916	1.931;
11.364	5.0842	3.5273	2.5558	1.9321	1.8705	1.8567	1.8674;
12.1578	4.8974	3.1736	2.4388	1.9552	2.0668	1.8699	1.6778;
10.6016	5.0739	3.2126	2.3368	2.007	1.9236	1.8906	1.8702];

nexttile
plot(X,Y(1,:),'o-','color',color1/255,'linewidth',linewidth1)
nexttile
plot(X,Y(2,:),'o-','color',color2/255,'linewidth',linewidth1)
nexttile
plot(X,Y(3,:),'o-','color',color3/255,'linewidth',linewidth1)
nexttile
plot(X,Y(4,:),'o-','color',color4/255,'linewidth',linewidth1)
颜色截取自链接
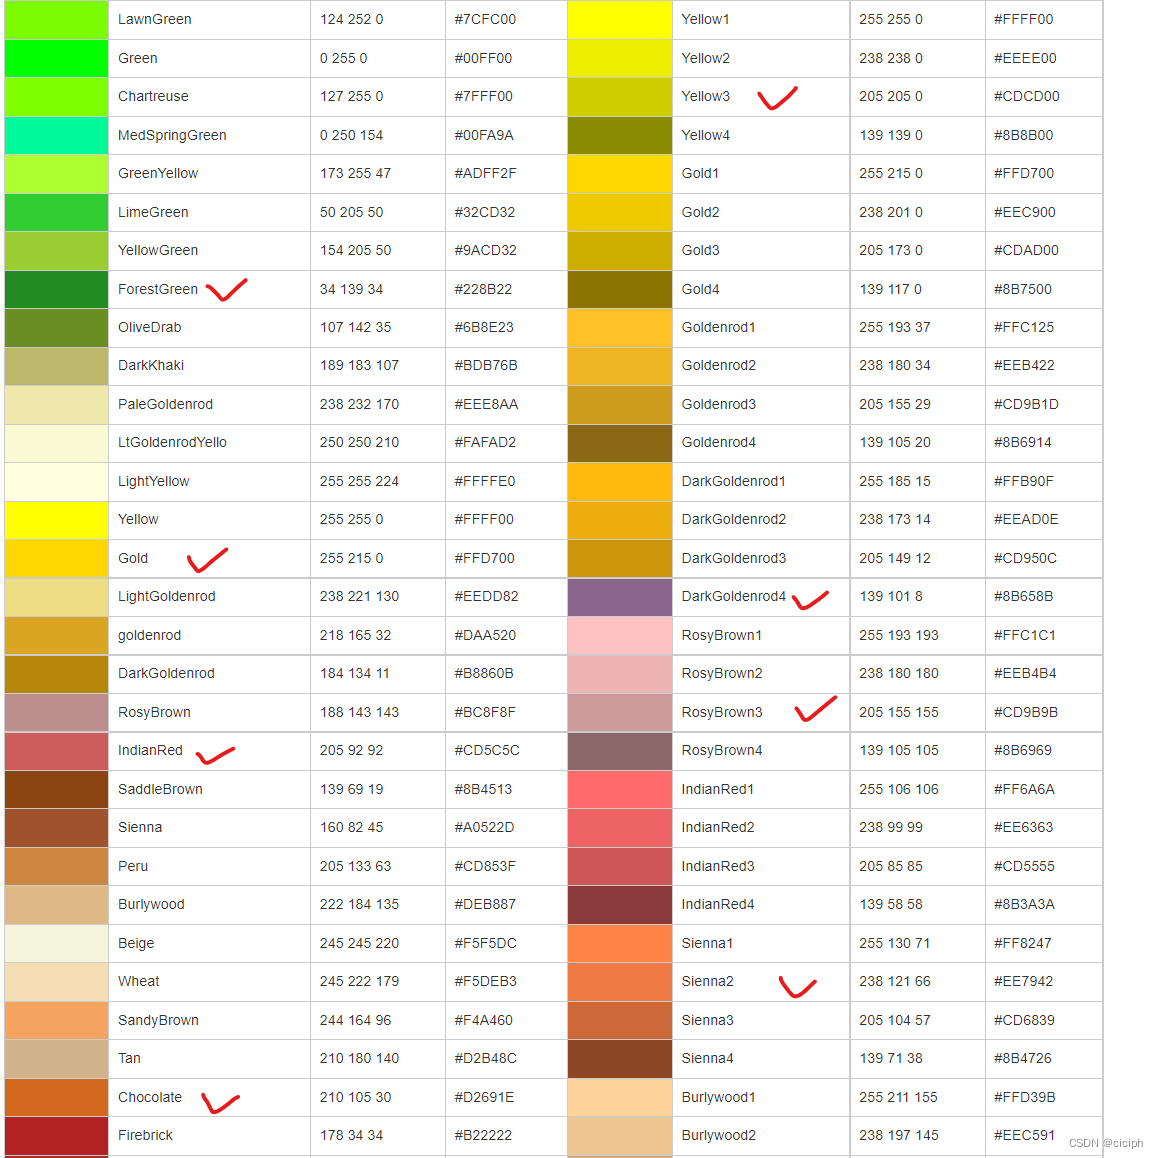 
- 右边颜色绘制如下


 3502
3502


 被折叠的 条评论
为什么被折叠?
被折叠的 条评论
为什么被折叠?
 到【灌水乐园】发言


