


MAtlab 绘制竖线,组合图中子图位置确定, Matlab绘制小间距组合图方法,设置图片不显示直接保存
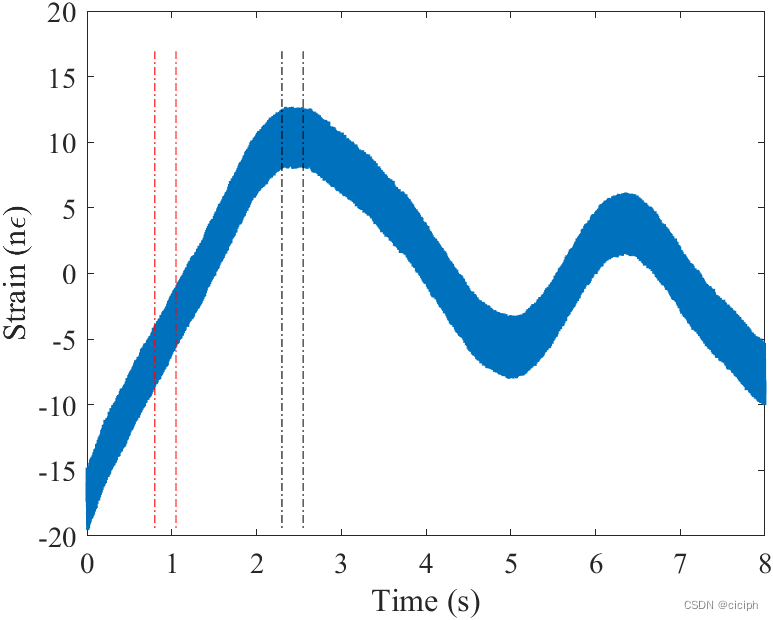
一、 Matlab 绘制竖线
	a1 = find(T == min(T((T - cut1 / 1e3) > 0)));
    b1 = find(T == min(T((T - (cut1 + 250) / 1e3) > 0)));
    data1 = StrainTemp(a1:b1);
    a = find(T == min(T((T - cut2 / 1e3) > 0)));
    b = find(T == min(T((T - (cut2 + 250) / 1e3) > 0)));
    data2 = StrainTemp(a:b);

	plot(T, 1e9*squeeze(Strain(n, 1, :)), 'linewidth', 1.5);
	hold on; plot([T(a1), T(a1)], [top, dow], 'k-.')
	hold on; plot([T(b1), T(b1)], [top, dow], 'k-.')
	hold on; plot([T(a), T(a)], [top, dow], 'r-.')
	hold on; plot([T(b), T(b)], [top, dow], 'r-.')
	xlabel('Time (s)', 'FontName', 'Times New Roman', 'FontSize', 14);
	ylabel('Strain (n\epsilon)', 'FontName', 'Times New Roman', 'FontSize', 14);
	set(gca, 'FontName', 'Times New Roman', 'FontSize', 14);
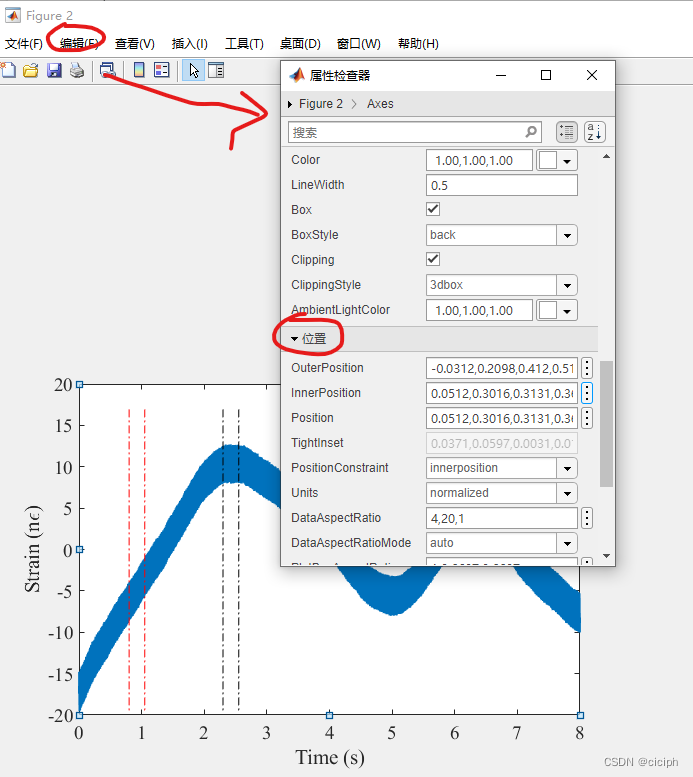
二、确定子图在框图中的位置
-
subolot绘制2*3草图,大致确定子图位置
-
手动调整子图在匡图中的位置
-
如果只需要一张图,结束;如果需要批量绘制类似框图,点击编辑–>图窗属性–>位置
-
选择任意位置信息即可;例如获取InnerPosition的值,代码中加入
subplot('position', [0.05125, 0.301615, 0.313125, 0.367274]);即可。 -
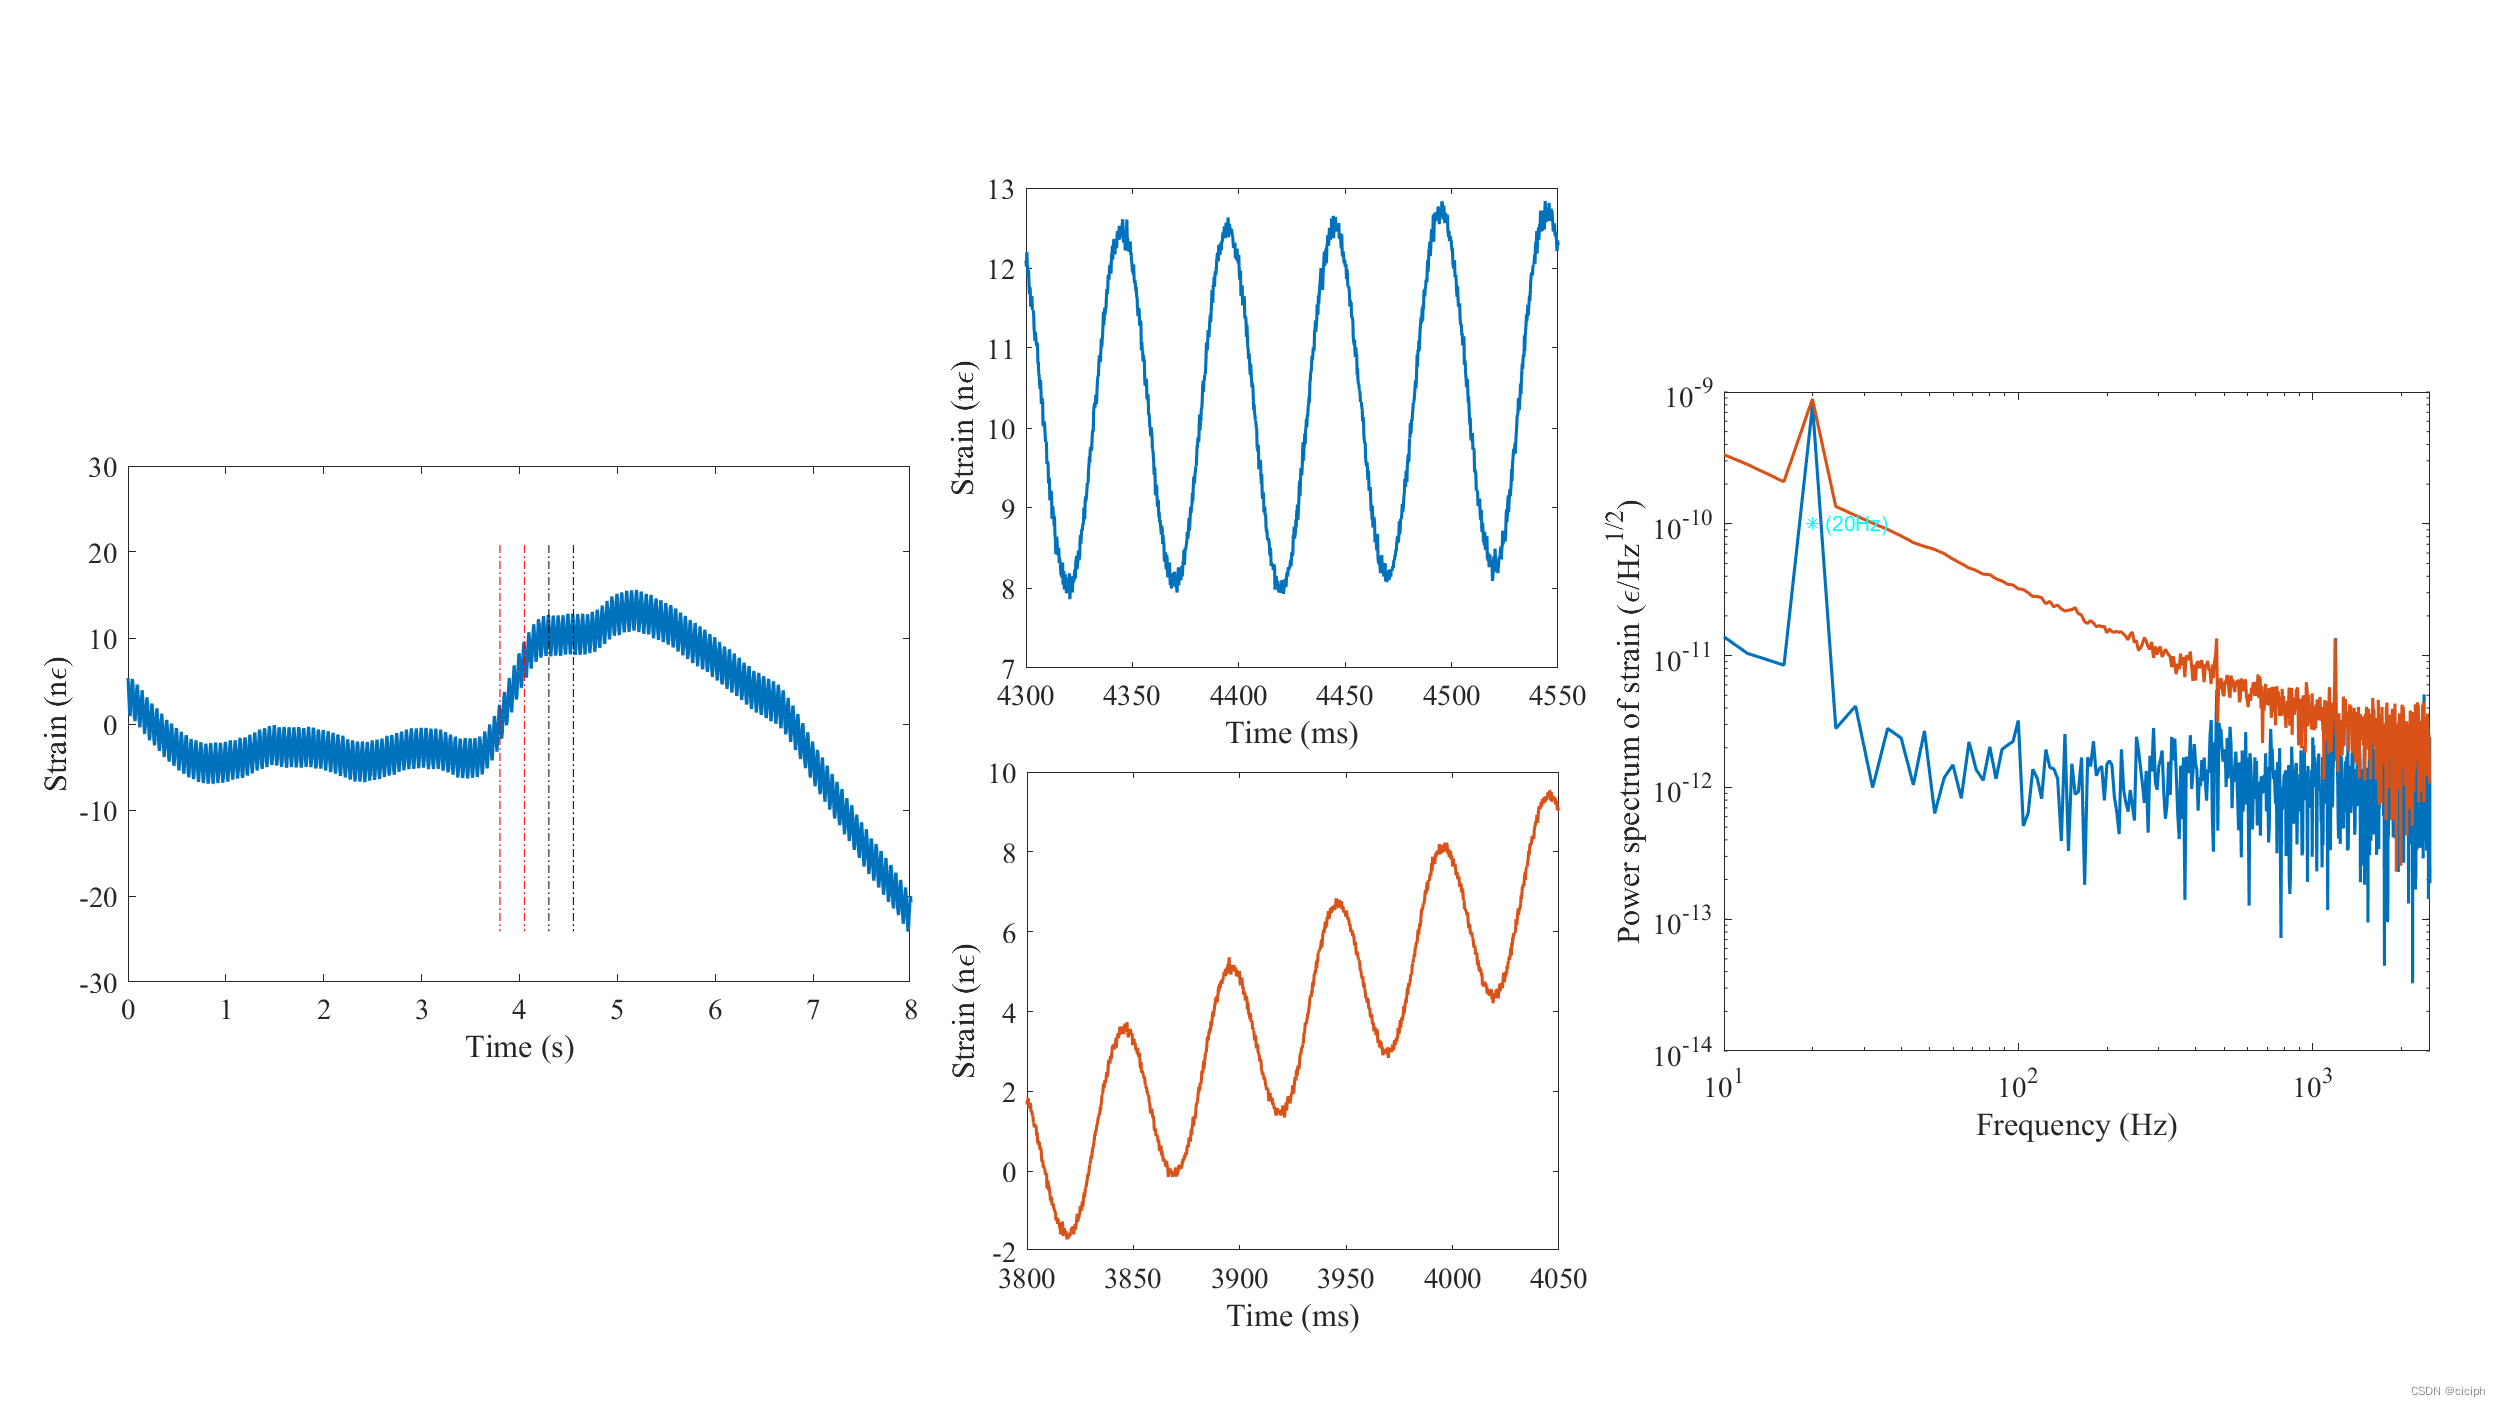
完整代码如下:
 	h1 = figure(n);
    set(h1, 'Position', [10, 10, 1600, 900]);  % 设置图框大小
    subplot(2, 3, 1);
    subplot('position', [0.05125, 0.301615, 0.313125, 0.367274]); % 该子图在图框的位置
    plot(T, 1e9*squeeze(Strain(n, 1, :)), 'linewidth', 1.5);
    hold on; plot([T(a1), T(a1)], [top, dow], 'k-.')
    hold on; plot([T(b1), T(b1)], [top, dow], 'k-.')
    hold on; plot([T(a), T(a)], [top, dow], 'r-.')
    hold on; plot([T(b), T(b)], [top, dow], 'r-.')
    xlabel('Time (s)', 'FontName', 'Times New Roman', 'FontSize', 14);
    ylabel('Strain (n\epsilon)', 'FontName', 'Times New Roman', 'FontSize', 14);
    set(gca, 'FontName', 'Times New Roman', 'FontSize', 14);

    subplot(2, 3, 2);
    subplot('position', [0.4102, 0.5250, 0.2128, 0.3412]); % 该子图在图框的位置
    plot(T*1e3, 1e9*squeeze(Strain(n, 1, :)), 'linewidth', 1.5);
    xlabel('Time (ms)', 'FontName', 'Times New Roman', 'FontSize', 14);
    ylabel('Strain (n\epsilon)', 'FontName', 'Times New Roman', 'FontSize', 14);
    set(gca, 'FontName', 'Times New Roman', 'FontSize', 14);
    xlim([cut1, cut1 + 250])
    subplot(2, 3, 5);
    subplot('position', [0.4108, 0.11, 0.2128, 0.3412]);% 该子图在图框的位置
    plot(T*1e3, 1e9*squeeze(Strain(n, 1, :)), 'linewidth', 1.5);
    hold on;
    plot(T*1e3, 1e9*squeeze(Strain(n, 1, :)), 'linewidth', 1.5);
    xlabel('Time (ms)', 'FontName', 'Times New Roman', 'FontSize', 14);
    ylabel('Strain (n\epsilon)', 'FontName', 'Times New Roman', 'FontSize', 14);
    set(gca, 'FontName', 'Times New Roman', 'FontSize', 14);
    xlim([cut2, cut2 + 250])


    subplot(2, 3, 3);
    subplot('position', [0.6897, 0.2527, 0.2822, 0.4684]); % 该子图在图框的位置
    loglog(Freq1, Psd1, 'linewidth', 1.5)

    hold on; loglog(Freq2, Psd2, 'linewidth', 1.5)
    hold on; plot(fs_Strain, squeeze(PsdStrain(n, 1, Near_fs)), 'c*')
    xlim([10, max(Freq)])
    text(fs_Strain+2, PsdStrain(n, 1, Near_fs), ['(', num2str(fs_Strain), 'Hz)'], 'color', 'c');
    xlabel('Frequency (Hz)', 'FontName', 'Times New Roman', 'FontSize', 14);
    ylabel('Power spectrum of strain (\epsilon/Hz^{1/2})', 'FontName', 'Times New Roman', 'FontSize', 14);
    %     legend('','')
    set(gca, 'FontName', 'Times New Roman', 'FontSize', 14);
    saveas(h1, [PlotsFolder, 'Noise', Files(n).name(1:end-8), '.png'], 'png');
三、 Matlab绘制小间距组合图方法
假设绘制2*2组合图,使用tiledlayout()函数。
Example
rn = 2;  % The number of rows
cn = 2;  % The number of columns
figure;
ha = tiledlayout(rn,cn,'TileSpacing','Compact','Padding','Compact');

X=[0	5	10	15	20 25 30 35];
Y=[11.6468	5.1099	3.326	2.3581	2.1535	1.9456	1.916	1.931;
11.364	5.0842	3.5273	2.5558	1.9321	1.8705	1.8567	1.8674;
12.1578	4.8974	3.1736	2.4388	1.9552	2.0668	1.8699	1.6778;
10.6016	5.0739	3.2126	2.3368	2.007	1.9236	1.8906	1.8702];

nexttile
plot(X,Y(1,:),'ko-','linewidth',linewidth1)
nexttile
plot(X,Y(2,:),'bo-','linewidth',linewidth1)
nexttile
plot(X,Y(3,:),'co-','linewidth',linewidth1)
nexttile
plot(X,Y(4,:),'ro-','linewidth',linewidth1)
设置tiledlayout(?行数,?列数,'TileSpacing','Compact','Padding','Compact');后的间距实例

不做tiledlayout()设置时的间距示例:

四、设置图片不显示直接保存
set(0,'DefaultFigureVisible','on');
set(0,'DefaultFigureVisible','off');


 2155
2155


 被折叠的 条评论
为什么被折叠?
被折叠的 条评论
为什么被折叠?
 到【灌水乐园】发言


