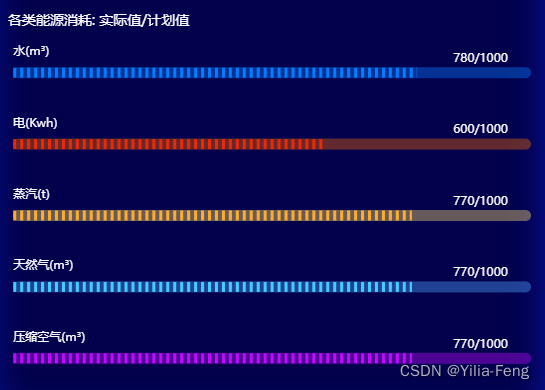
echarts绘制进度条

效果图
在这里插入图片描述
代码

const datalist = [780, 600, 770, 770, 770];
const namelist = ['水(m³)', '电(Kwh)', '蒸汽(t)', '天然气(m³)', '压缩空气(m³)'];
option = {
          grid: {
            top: '0',
            left: '1%',
            right: '10%',
            bottom: '0'
          },
          xAxis: {
            axisLine: {
              show: false
            },
            axisTick: {
              show: false
            },
            axisLabel: {
              show: false
            },
            splitLine: {
              show: false
            }
          },
          yAxis: [{
            data: ['水', '电', '蒸汽','天然气','压缩空气'],
            inverse: true,
            splitLine: {
              show: false
            },
            axisTick: {
              show: false
            },
            axisLine: {
              show: false
            },
            axisLabel: {
              color: '#fff',
              fontSize: 18
            }
          },
          {
            type: 'category',
            axisTick: { show: false }, // 不显示刻度线
            axisLabel: {
              color: '#000',
            },
            axisLine: {
              show: false,
            },
            inverse: true,
          }
          ],
          series: [
            {
              name: '进度条',
              yAxisIndex: 0,
              type: 'pictorialBar',
              symbol: 'rect', // 长方形
              symbolRepeat: 'fixed',
              symbolMargin: '2', // 缝隙
              symbolClip: true,
              symbolSize: ['3', '16'],
              barCategoryGap: 5,
              label: {
                show: true,
                position: [0,50],
                fontSize: 14,
                formatter: (name) => namelist[name.dataIndex]
              },
              zlevel: 1, //  zlevel 大的 Canvas 会放在 zlevel 小的 Canvas 的上面
              data: [
                {
                  value: 780,
                  itemStyle: {
                    normal: {
                      color: '#047CFF'
                    }
                  }
                },
                {
                  value: 600,
                  itemStyle: {
                    normal: {
                      color: '#EE2800'
                    }
                  }
                },
                {
                  value: 770,
                  itemStyle: {
                    normal: {
                      color: '#FFAD27'
                    }
                  }
                },
                {
                  value: 770,
                  itemStyle: {
                    normal: {
                      color: '#42CEFF'
                    }
                  }
                },
                {
                  value: 770,
                  itemStyle: {
                    normal: {
                      color: '#BF0AFF'
                    }
                  }
                }
              ]
            },
            {
              name: '进度条背景',
              type: 'bar',
              yAxisIndex: 1,
              barGap: '-100%', // 不同系列的柱间距离,为百分比。
              barCategoryGap: 5,
              barWidth: 20,
              left: '50',
              data: [1000, 1000, 1000, 1000, 1000],
              color: 'rgba(152, 144, 238, 0.12)', // 柱条颜色
              itemStyle: {
                normal: {
                    color: function(params) {
                        var colorList = ['rgba(4,124,255,0.4)','rgba(242,104,0,0.4)','rgb(255,224,117,0.4)','	rgb(79,163,255,0.4)','rgb(191,10,255,0.4)'];
                            return colorList[params.dataIndex]
                    },
                    barBorderRadius: [10]//设置圆角
                }
              },
              label: {
                    normal: {
                      show: true, // 是否显示进度条上方的百分比
                      formatter: (series) => datalist[series.dataIndex]+'/1000',
                      position: [913,-20],
                      textStyle: {
                          color: '#000', // 进度条上方百分比字体颜色
                          fontSize: 14
                      }
                    }
                }
            }
          ]
};
  • 2
    点赞
  • 19
    收藏
    觉得还不错? 一键收藏
  • 0
    评论
以下是一个使用 ECharts 实现横向进度条的示例代码: ```html <!DOCTYPE html> <html> <head> <meta charset="utf-8"> <title>ECharts 横向进度条示例</title> <!-- 引入 ECharts --> <script src="https://cdn.jsdelivr.net/npm/echarts@4.9.0/dist/echarts.min.js"></script> </head> <body> <!-- 绘制进度条的容器 --> <div id="progress" style="width: 500px; height: 50px;"></div> <script> // 初始化 ECharts 实例 var myChart = echarts.init(document.getElementById('progress')); // 配置项 var option = { // 横向进度条 xAxis: { type: 'value', max: 100, // 进度条最大值 axisLine: { show: false }, // 隐藏坐标轴线 axisTick: { show: false }, // 隐藏刻度线 axisLabel: { show: false }, // 隐藏刻度标签 splitLine: { show: false }, // 隐藏分隔线 splitArea: { show: false } // 隐藏分隔区域 }, yAxis: { type: 'category', axisLine: { show: false }, // 隐藏坐标轴线 axisTick: { show: false }, // 隐藏刻度线 axisLabel: { show: false }, // 隐藏刻度标签 data: ['进度'] // 数据 }, series: [ { type: 'bar', itemStyle: { color: '#1e90ff' // 进度条颜色 }, barWidth: 30, // 进度条宽度 barMaxWidth: 30, // 进度条最大宽度 barMinHeight: 20, // 进度条最小高度 label: { show: true, // 显示数据标签 position: 'right', // 数据标签位置 formatter: '{c}%' }, data: [70] // 进度条数据 } ] }; // 使用刚指定的配置项和数据显示图表 myChart.setOption(option); </script> </body> </html> ``` 该示例中,我们使用 ECharts 绘制了一个横向进度条进度条的进度为 70%。你可以根据需要修改配置项和数据来实现不同的进度条效果。

“相关推荐”对你有帮助么?

  • 非常没帮助
  • 没帮助
  • 一般
  • 有帮助
  • 非常有帮助
提交
评论
添加红包

请填写红包祝福语或标题

红包个数最小为10个

红包金额最低5元

当前余额3.43前往充值 >
需支付:10.00
成就一亿技术人!
领取后你会自动成为博主和红包主的粉丝 规则
hope_wisdom
发出的红包
实付
使用余额支付
点击重新获取
扫码支付
钱包余额 0

抵扣说明:

1.余额是钱包充值的虚拟货币,按照1:1的比例进行支付金额的抵扣。
2.余额无法直接购买下载,可以购买VIP、付费专栏及课程。

余额充值