


版权声明:本文为博主原创文章,遵循 CC 4.0 BY-SA 版权协议,转载请附上原文出处链接和本声明。
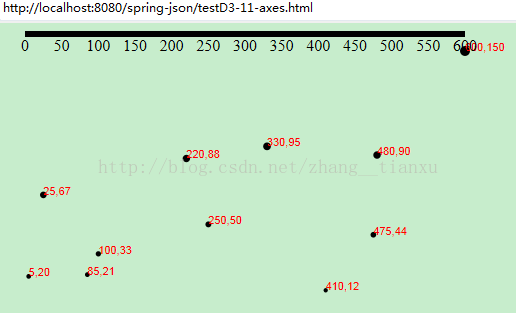
1. 定义和创建X轴
-
//定义X轴
-
var xAxis = d3.svg.axis()
-
.scale(xScale)
-
.orient(
"bottom");
-
-
//创建X轴
-
svg.
append(
"g").call(xAxis);
其中:
- scale函数用来指定坐标轴的比例尺。
- orient函数用来指定坐标轴的方位,可取值有
left,right,top,bottom。 - 调用的时候任意的选择器call调用轴,或者xAxis(选择器)均可。
效果:
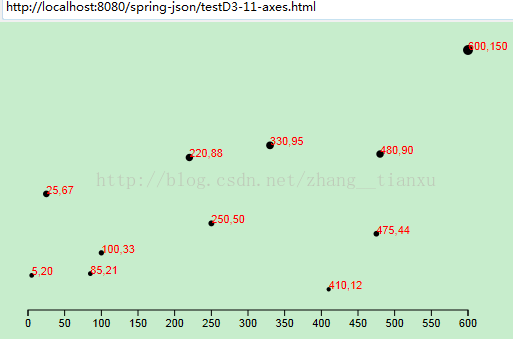
2. 调整X轴的样式
为显示刻度尺可以设置样式为:
-
.axis path,
-
.axis line {
-
fill:
none;
-
stroke: black;
-
shape-
rendering: crispEdges;
//这个属性用来显示轴
-
}
-
-
.axis text {
-
font-
family: sans-serif;
-
font-
size:
11px;
-
}
并且把坐标轴平移到下面:
-
svg.
append(
"g")
-
.attr(
"class",
"axis")
-
.attr(
"transform",
"translate(0," + (h - padding) +
")")
-
.
call(xAxis);
效果:
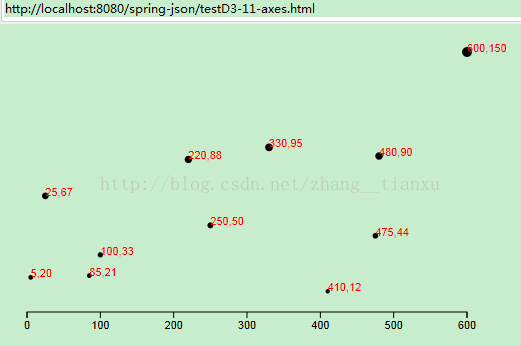
3. 设置刻度数
-
var xAxis = d3.svg.axis()
-
.scale(xScale)
-
.orient(
"bottom")
-
.ticks(
5);
//设置刻度数
- 注意这个ticks函数指定的数字只是一个大概的数量,具体生成多少D3会自动调整。
效果:
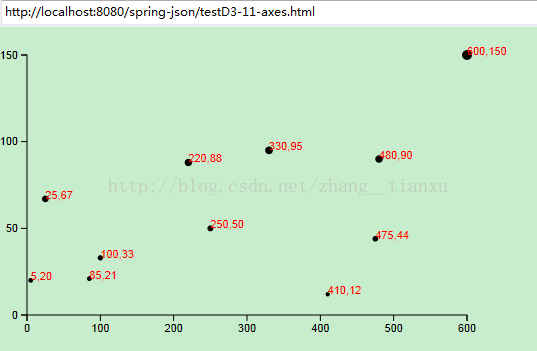
4. Y轴
-
//定义Y轴
-
var yAxis = d3.svg.axis()
-
.scale(yScale)
-
.orient(
"left")
-
.ticks(
5);
同样设置起始坐标
-
//创建Y轴
-
svg.
append(
"g")
-
.attr(
"class",
"axis")
-
.attr(
"transform",
"translate(" + padding +
",0)")
-
.call(yAxis);
效果:
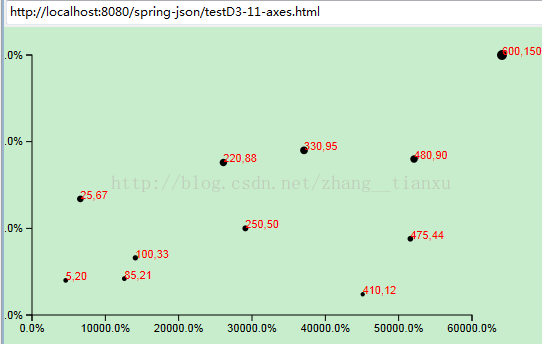
5. 设置刻度的格式
-
var format = d3.format(
".1%");
-
xAxis.tickFormat(format);
6. 最后的源码
-
<!DOCTYPE html>
-
<html>
-
<head>
-
<meta charset="utf-8">
-
<title>testD3-11-axes.html
</title>
-
<script type="text/javascript" src="d3.js">
</script>
-
<style type="text/css">
-
.axis
path
,
-
.axis
line
{
-
fill: none
;
-
stroke: black
;
-
shape-rendering: crispEdges
;
-
}
-
.axis
text
{
-
font-family: sans-serif
;
-
font-size: 11px
;
-
}
-
</style>
-
</head>
-
<body>
-
<script type="text/javascript">
-
// 高宽
-
var
w =
500
;
-
var
h =
300
;
-
var
padding =
20
;
-
-
var
dataset = [
-
[
5
,
20
], [
480
,
90
], [
250
,
50
], [
100
,
33
], [
330
,
95
],
-
[
410
,
12
], [
475
,
44
], [
25
,
67
], [
85
,
21
], [
220
,
88
],
-
[
600
,
150
]
-
];
-
-
// 创建比例尺
-
var
xScale = d3.scale.linear()
-
.domain([
0
, d3.max(dataset,
function(d)
{
return
d[
0
]; })])
-
.range([padding, w - padding *
2
]);
-
var
yScale = d3.scale.linear()
-
.domain([
0
, d3.max(dataset,
function(d)
{
return
d[
1
]; })])
-
.range([h - padding, padding]);
-
var
rScale = d3.scale.linear()
-
.domain([
0
, d3.max(dataset,
function(d)
{
return
d[
1
]; })])
-
.range([
2
,
5
]);
-
-
var
formatAsPercentage = d3.format(
".1%"
);
//设置刻度的格式
-
-
// 创建SVG
-
var
svg = d3.select(
"body"
)
-
.append(
"svg"
)
-
.attr(
"width"
, w)
-
.attr(
"height"
, h);
-
-
svg.selectAll(
"circle"
)
-
.data(dataset)
-
.enter()
-
.append(
"circle"
)
-
.attr(
"cx"
,
function(d)
{
-
return
xScale(d[
0
])+
30
;
//设置原点坐标,以及横轴位移量
-
})
-
.attr(
"cy"
,
function(d)
{
-
return
yScale(d[
1
]);
-
})
-
.attr(
"r"
,
function(d)
{
-
return
rScale(d[
1
]);
-
});
-
-
svg.selectAll(
"text"
)
-
.data(dataset)
-
.enter()
-
.append(
"text"
)
-
.text(
function(d)
{
-
return
d[
0
] +
","
+ d[
1
];
-
})
-
.attr(
"x"
,
function(d)
{
-
return
xScale(d[
0
])+
30
;
-
})
-
.attr(
"y"
,
function(d)
{
-
return
yScale(d[
1
]);
-
})
-
.attr(
"font-family"
,
"sans-serif"
)
-
.attr(
"font-size"
,
"11px"
)
-
.attr(
"fill"
,
"red"
);
-
-
// 定义X轴
-
var
xAxis = d3.svg.axis()
-
.scale(xScale)
-
.ticks(
5
)
//最多刻度数,连上原点
-
.orient(
"bottom"
)
-
.tickFormat(format);
//添加刻度格式
-
// 定义Y轴
-
var
yAxis = d3.svg.axis()
-
.scale(yScale)
-
.orient(
"left"
)
-
.ticks(
5
)
-
.tickFormat(format);
-
-
// 创建X轴
-
svg.append(
"g"
)
-
.attr(
"class"
,
"axis"
)
-
.attr(
"transform"
,
"translate(0,"
+ (h - padding) +
")"
)
//设置据下边界的距离
-
.call(xAxis);
-
-
// 创建Y轴
-
svg.append(
"g"
)
-
.attr(
"class"
,
"axis"
)
-
.attr(
"transform"
,
"translate("
+ padding +
",0)"
)
//设置轴据左边界的距离
-
.call(yAxis);
-
-
</script>
-
-
</body>
-
</html>


 6万+
6万+


 被折叠的 条评论
为什么被折叠?
被折叠的 条评论
为什么被折叠?
 到【灌水乐园】发言


