Numpy+Pandas+Matplotlib_demo
调包
import pandas as pd
import numpy as np
import matplotlib.pyplot as plt
%matplotlib inline
用Numpy生成不同方差的高斯随机序列
L = 2**10
sigma_list = [3, 2, 1]
gs_1 = np.round(np.random.randn(L, 1) * sigma_list[0], 1)
gs_2 = np.round(np.random.randn(L, 1) * sigma_list[1], 1)
gs_3 = np.round(np.random.randn(L, 1) * sigma_list[2], 1)
使用np.std(ddof = 1)对总体方差进行无偏估计
print("序列1方差理论值 = {},统计估计值 = {}".format(sigma_list[0], np.std(gs_1, ddof = 1)))
print("序列2方差理论值 = {},统计估计值 = {}".format(sigma_list[1], np.std(gs_2, ddof = 1)))
print("序列3方差理论值 = {},统计估计值 = {}".format(sigma_list[2], np.std(gs_3, ddof = 1)))
序列1方差理论值 = 3,统计估计值 = 2.9569623663023257
序列2方差理论值 = 2,统计估计值 = 1.9519132091240838
序列3方差理论值 = 1,统计估计值 = 0.9764453436567503
使用np.hstack()将三个随机序列水平连接
ga = np.hstack((gs_1, gs_2, gs_3))
print("连接后矩阵的维度 = {}".format(ga.shape))
连接后矩阵的维度 = (1024, 3)
生成一个DataFrame数据类型
gdf = pd.DataFrame(ga, columns = ['A', 'B', 'C'])
print(gdf[0:10])
     A    B    C
0 -0.3  0.7  0.3
1  3.5 -1.0 -0.8
2 -3.2 -0.2  1.4
3  0.3  4.8 -0.2
4 -0.2  0.3 -0.2
5  3.5 -1.5 -1.3
6 -0.6  0.6  0.3
7  1.2 -0.2 -0.8
8  0.1 -0.1  0.9
9 -2.7 -0.2 -0.3
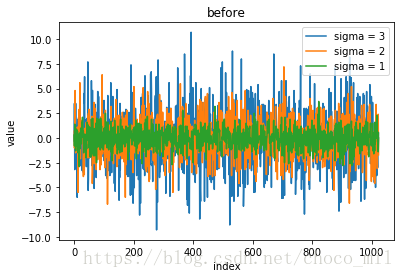
plt.plot()显示结果
plt.plot(gdf)
plt.xlabel("index")
plt.ylabel("value")
plt.title("before")
plt.legend(("sigma = "+str(sigma_list[0]),"sigma = "+str(sigma_list[1]),"sigma = "+str(sigma_list[2])))
<matplotlib.legend.Legend at 0x19c92220b70>

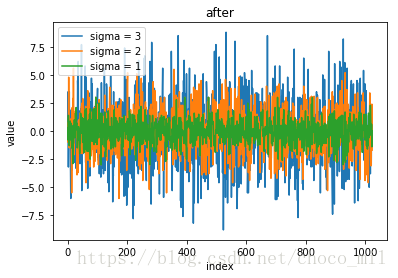
利用条件选择将高斯序列变为截断高斯序列
gdf[gdf.A > 3*sigma_list[0]] = 3*sigma_list[0]
gdf[gdf.A < -3*sigma_list[0]] = -3*sigma_list[0]
gdf[gdf.B > 3*sigma_list[1]] = 3*sigma_list[1]
gdf[gdf.B < -3*sigma_list[1]] = -3*sigma_list[1]
gdf[gdf.C > 3*sigma_list[2]] = 3*sigma_list[2]
gdf[gdf.C < -3*sigma_list[2]] = -3*sigma_list[2]
print(gdf[0:10])
     A    B    C
0 -0.3  0.7  0.3
1  3.5 -1.0 -0.8
2 -3.2 -0.2  1.4
3  0.3  4.8 -0.2
4 -0.2  0.3 -0.2
5  3.5 -1.5 -1.3
6 -0.6  0.6  0.3
7  1.2 -0.2 -0.8
8  0.1 -0.1  0.9
9 -2.7 -0.2 -0.3
plt.plot()显示结果
plt.plot(gdf)
plt.xlabel("index")
plt.ylabel("value")
plt.title("after")
plt.legend(("sigma = "+str(sigma_list[0]),"sigma = "+str(sigma_list[1]),"sigma = "+str(sigma_list[2])))
<matplotlib.legend.Legend at 0x19c92337748>


 1021
1021

 被折叠的 条评论
为什么被折叠?


