


需求分析
葡萄牙某银行拟根据现有客户资料建立预测模型,以配合其数据库营销策略,营销方式为电话直销,销售产品为某金融产品(term deposit),数据分析的目标为通过预测模型识别对该金融产品有较高购买意愿的用户群。
数据形式:从数据库中导出的excel文件
数据内容:
# bank client data:
1 - age (numeric)
2 - job : type of job (categorical: "admin.","unknown","unemployed","management","housemaid","entrepreneur","student",
"blue-collar","self-employed","retired","technician","services")
3 - marital : marital status (categorical: "married","divorced","single"; note: "divorced" means divorced or widowed)
4 - education (categorical: "unknown","secondary","primary","tertiary")
5 - default: has credit in default? (binary: "yes","no")
6 - balance: average yearly balance, in euros (numeric)
7 - housing: has housing loan? (binary: "yes","no")
8 - loan: has personal loan? (binary: "yes","no")
# related with the last contact of the current campaign:
9 - contact: contact communication type (categorical: "unknown","telephone","cellular")
10 - day: last contact day of the month (numeric)
11 - month: last contact month of year (categorical: "jan", "feb", "mar", ..., "nov", "dec")
12 - duration: last contact duration, in seconds (numeric)
# other attributes:
13 - campaign: number of contacts performed during this campaign and for this client (numeric, includes last contact)
14 - pdays: number of days that passed by after the client was last contacted from a previous campaign (numeric, -1 means client was not previously contacted)
15 - previous: number of contacts performed before this campaign and for this client (numeric)
16 - poutcome: outcome of the previous marketing campaign (categorical: "unknown","other","failure","success")
Output variable (desired target):
17 - y - has the client subscribed a term deposit? (binary: "yes","no")
下面用R语言进行数据分析及可视化
> bank <- read.csv("H:/bank/bank-full.csv", sep = ";", header = T) //载入数据
> summary(bank) //对数据进行分析汇总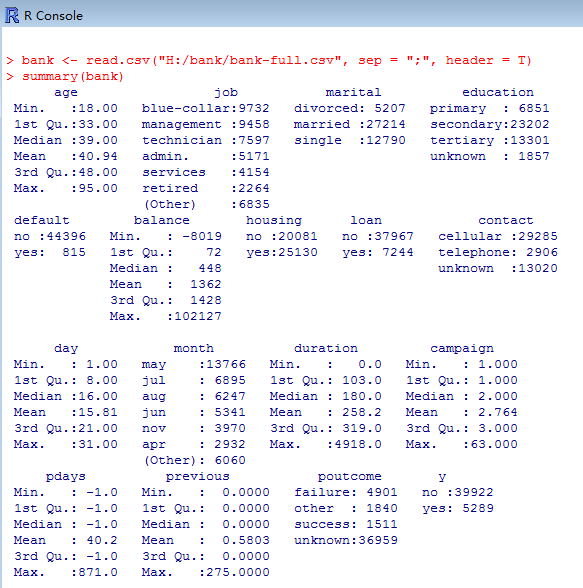
//导入要用到的包
> library(caret)
> library(ggplot2)
> library(gplots)

> require(rpart)
> require(caret)
> require(ggplot2)
> require(gplots)
//运用决策树模型对数据做初步分类建模和变量选择
> bank.tree <- rpart(y ~ ., data = bank, method = "class", cp = 0.001)
> treeImp <- varImp(bank.tree, scale = TRUE, surrogates = FALSE, competes = TRUE)
> treeImp$Variable <- rownames(treeImp)
> treeImp.sort <- treeImp[order(-treeImp$Overall), ]
> ggplot(treeImp, aes(Variable, Overall)) + geom_bar(stat = "identity") + coord_flip()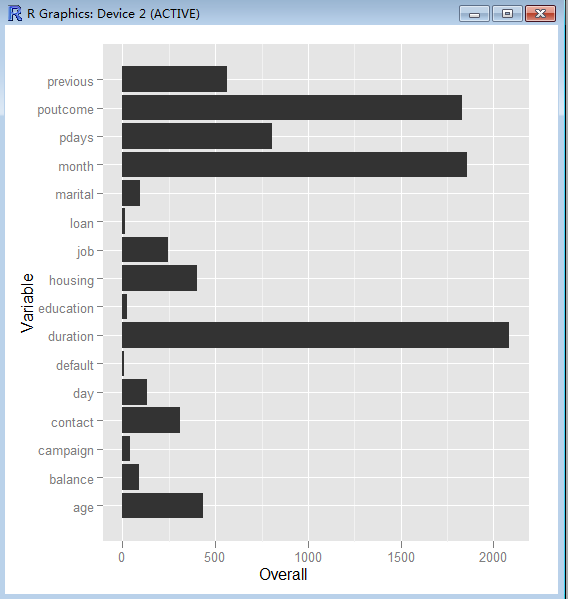
//根据cpplot对树做裁剪
plotcp(bank.tree)
//输出
> printcp(bank.tree)
Classification tree:
rpart(formula = y ~ ., data = bank, method = "class", cp = 0.001)
Variables actually used in tree construction:
[1] age balance contact day duration education housing job marital
[10] month pdays poutcome previous
Root node error: 5289/45211 = 0.11698
n= 45211
CP nsplit rel error xerror xstd
1 0.0380034 0 1.00000 1.00000 0.012921
2 0.0253356 3 0.88599 0.89147 0.012287
3 0.0170164 4 0.86065 0.86425 0.012120
4
 最低0.47元/天 解锁文章


 1812
1812


 被折叠的 条评论
为什么被折叠?
被折叠的 条评论
为什么被折叠?
 到【灌水乐园】发言


