


1、引入js;
<script type="text/javascript" src="echarts.js" ></script>
2、设置显示的div大小;
<div id="main" style="width: 80%; height: 400px;"></div>
3、<script>
// 基于准备好的dom,初始化echarts实例
var myChart = echarts.init(document.getElementById('main'));
option = {
tooltip : {
trigger: 'axis',
axisPointer : { // 坐标轴指示器,坐标轴触发有效
type : 'shadow' // 默认为直线,可选为:'line' | 'shadow'
}
},
toolbox: {
feature: {
dataView: {show: true, readOnly: false},
magicType: {show: true, type: ['line', 'bar']},
restore: {show: true},
saveAsImage: {show: true}
}
},
legend:{
data:['军费支出','军费占支出比']
},
grid: {
left: '3%',
right: '4%',
bottom: '3%',
containLabel: true
},
xAxis : [
{
type : 'category',
name:'年',
data : ['2008', '2009', '2010', '2011', '2012', '2013', '2014'],
axisTick: {
alignWithLabel: true
}
}
],
yAxis : [
{
type : 'value',
name:'亿美元'
}
],
series : [
{
name:'军费支出',
type:'bar',
barWidth: '20%',
itemStyle:{
normal:{
color:' #4169E1' //柱子的颜色
}
},
data:[480, 550, 590, 700, 810, 850, 840]
},
{
name:'军费占支出比',
type:'line',
symbol:'star',/*拐点样式*/
symbolSize:8, //拐点大小
itemStyle:{
normal:{
color:'#D2691E' //拐点颜色
}
},
lineStyle:{
normal:{
color:'#D2691E' //折线颜色
}
},
data:[480, 750, 610, 588, 620, 650, 760]
}
]
};
// 使用刚指定的配置项和数据显示图表。
myChart.setOption(option);
</script>
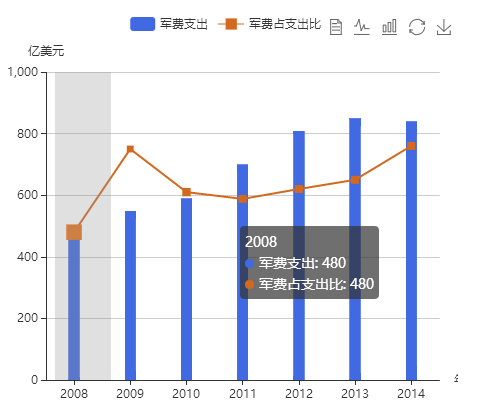
结果显示:


 1万+
1万+

 被折叠的 条评论
为什么被折叠?
被折叠的 条评论
为什么被折叠?
 到【灌水乐园】发言


