echarts 折线图和柱状图组合示例

本文介绍了一种使用ECharts创建组合图表的方法,包括柱状图和折线图的结合展示。通过具体代码示例,展示了如何配置图表的各项参数,如颜色、网格、提示框、图例、坐标轴等,实现数据的直观比较。

摘要生成于 C知道 ,由 DeepSeek-R1 满血版支持, 前往体验 >

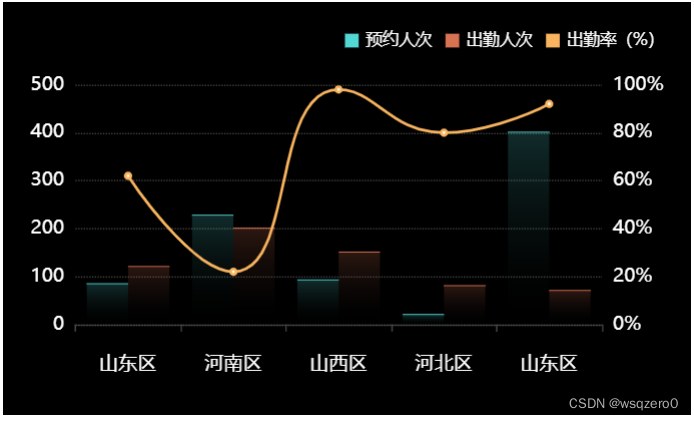
记录一次echarts 组合图的实现方案
效果如下:
效果图
具体代码如下:

<!DOCTYPE html>
<html>

<head>
    <meta charset="utf-8">
    <title>ECharts</title>
    <!-- 引入 echarts.js -->
    <script src="https://lib.baomitu.com/echarts/5.2.2/echarts.min.js"></script>
</head>

<body>
    <!-- 为ECharts准备一个具备大小(宽高)的Dom -->
    <div id="main" style="width: 500px;height:300px;background: #000;"></div>
    <script type="text/javascript">
        // 基于准备好的dom,初始化echarts实例
        var myChart = echarts.init(document.getElementById('main'));
        const colorList = ["#9E87FF", '#73DDFF', '#fe9a8b', '#F56948', '#9E87FF']
        let option = {
            grid: {
                left: "20",
                right: "20",
                bottom: "30",
                containLabel: true,
            },
            tooltip: {
                trigger: "axis",
                formatter: '{b0}<br/>{a0}: {c0}<br/>{a2}: {c2}<br/>{a4}: {c4}'
            },
            legend: {
                x: "right",
                y: "top",
                icon: "react",
                padding: [22, 20, 20, 20],
                itemWidth: 10, // 标志图形的长度
                itemHeight: 10, // 标志图形的宽度
                orient: "horizontal",
                textStyle: {
                    color: "#fff"
                },
                data: [{
                    name: "预约人次", itemStyle: {
                        color: "#53D7D5"
                    }
                }, {
                    itemStyle: {
                        opacity: 0,

                    }
                }, {
                    name: "出勤人次", itemStyle: {
                        color: "#D77353"
                    }
                }, {
                    itemStyle: {
                        opacity: 0
                    }
                }, {
                    name: "出勤率(%)", itemStyle: {
                        color: "#F8B45F"
                    }
                }],
            },
            xAxis: {
                type: "category",
                data: ['山东区', "河南区", "山西区", "河北区", "山东区"],
                axisLine: {
                    lineStyle: {
                        color: "#464646",
                        width: 1,
                        type: "dotted",
                    },
                },
                axisLabel: {
                    interval: 0,
                    show: true,
                    textStyle: {
                        color: "#fff", //坐标值得具体的颜色
                        fontSize: 14,
                    },
                    margin: 22,
                },
            },
            yAxis: [
                {
                    position: "left",
                    type: "value",
                    id: 0,
                    splitLine: {
                        // 分隔线
                        show: true, // 默认显示,属性show控制显示与否
                        // onGap: null,
                        lineStyle: {
                            // 属性lineStyle(详见lineStyle)控制线条样式
                            color: ["#464646"],
                            width: 1,
                            type: "dotted",
                        },
                    },
                    axisLabel: {
                        textStyle: {
                            color: "#fff", //坐标值得具体的颜色
                            fontSize: 14,
                        },
                    },
                    axisLine: {
                        show: false,
                    },
                },
                {
                    position: "right",
                    type: "value",
                    id: 1,
                    min: 0,
                    max: 100,
                    splitLine: {
                        // 分隔线
                        show: false, // 默认显示,属性show控制显示与否
                        // onGap: null,
                        lineStyle: {
                            // 属性lineStyle(详见lineStyle)控制线条样式
                            color: ["#464646"],
                            width: 1,
                            type: "dotted",
                        },
                    },
                    axisLine: {
                        show: false,
                    },
                    axisLabel: {
                        textStyle: {
                            color: "#fff", //坐标值得具体的颜色
                            fontSize: 14,
                        },
                        formatter: "{value}%",
                    },
                },
            ],
            series: [
                {
                    type: "bar",
                    name: "预约人次",
                    stack: "1",
                    barGap: 0,
                    barWidth: 30,
                    yAxisIndex: 0,
                    data: [84, 227, 92, 20, 400],
                    itemStyle: {
                        color: {
                            type: "linear",
                            x: 0, //右
                            y: 0, //下
                            x2: 0, //左
                            y2: 1, //上
                            colorStops: [
                                {
                                    offset: 0.01,
                                    color: "rgba(83, 215, 213, 0.2)",
                                },
                                {
                                    offset: 1,
                                    color: "rgba(34, 34, 34, 0)", // 100% 处的颜色
                                },
                            ],
                        },
                    },
                },
                {
                    stack: "1",
                    // name: "测试",
                    type: "bar",
                    data: [2, 2, 2, 2, 2],
                    itemStyle: {
                        normal: {
                            label: {
                                show: false
                            },
                            color: "#53D7D5",
                        },
                    },
                },
                {
                    type: "bar",
                    name: "出勤人次",
                    barGap: 0,
                    stack: "2",
                    barWidth: 30,
                    yAxisIndex: 0,
                    data: [120, 200, 150, 80, 70],
                    itemStyle: {
                        color: {
                            type: "linear",
                            x: 0, //右
                            y: 0, //下
                            x2: 0, //左
                            y2: 1, //上
                            colorStops: [
                                {
                                    offset: 0.01,
                                    color: "rgba(215, 115, 83, 0.2)",
                                },
                                {
                                    offset: 1,
                                    color: "rgba(34, 34, 34, 0)", // 100% 处的颜色
                                },
                            ],
                        },
                    },
                },
                {
                    stack: "2",
                    type: "bar",
                    // name: "效率",
                    data: [2, 2, 2, 2, 2],
                    itemStyle: {
                        label: {
                            show: false
                        },
                        normal: {
                            color: "#D77353",
                        },
                    },
                },
                {
                    type: "line",
                    name: "出勤率(%)",
                    smooth: true, //加这个
                    yAxisIndex: 1,
                    data: [62, 22, 98, 80, 92],
                    itemStyle: {
                        normal: {
                            color: "#F8B45F",
                            lineStyle: {
                                color: "#F8B45F",
                            },
                        },
                    },
                },
            ],
        };
        if (option) {
            myChart.setOption(option);
        }
    </script>
</body>

</html>
评论 1
添加红包

请填写红包祝福语或标题

红包个数最小为10个

红包金额最低5元

当前余额3.43前往充值 >
需支付:10.00
成就一亿技术人!
领取后你会自动成为博主和红包主的粉丝 规则
hope_wisdom
发出的红包
实付
使用余额支付
点击重新获取
扫码支付
钱包余额 0

抵扣说明:

1.余额是钱包充值的虚拟货币,按照1:1的比例进行支付金额的抵扣。
2.余额无法直接购买下载,可以购买VIP、付费专栏及课程。

余额充值