


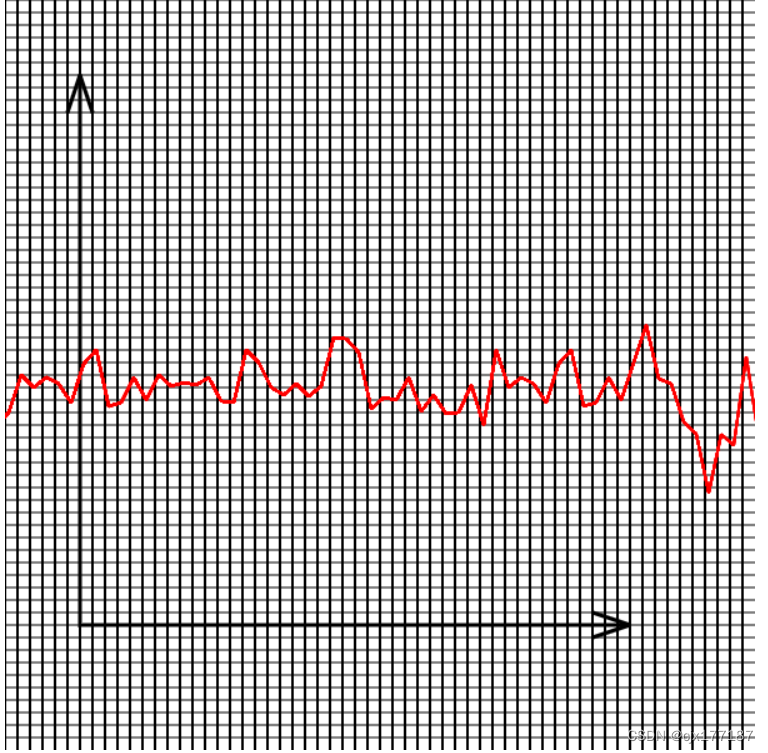
心电图
利用连接起点到终点,将上一个的终点当作下一个线条的起点,再次连接,重复直至遍历所有的数据,就成为了折线图。所以我们要将上一个线条的lineTo设置为下一个线条的moveTo。
举例:
做一个简易的心电图
1.画一个60×60的网格图
利用for循环画出横线和竖线
2.图中画出坐标
3.添加假数据,画出折线图
利用for循环遍历假数据,将假数据作为点的Y坐标添加到网格图中
4.利用计时器在加数据中添加数据
5.使折线图动态的向左移动
利用计时器每次刷新时都将坐标的x值减少相同的值,从而达到向左移动的视觉效果。
<body>
<canvas id="box" width="600" height="600"></canvas>
<script>
var canvas = document.querySelector("#box")
var pen = canvas.getContext("2d")
function struction() {
//画一个60×60的网格图
pen.beginPath()
for (let i = 0; i < 60; i++) {
pen.moveTo(0, 10 * i)
pen.lineTo(600, 10 * i)
for (let j = 0; j < 60; j++) {
pen.moveTo(10 * i, 0)
pen.lineTo(10 * i, 600)
}
}
pen.stroke()
console.log(666)
//画出X-Y坐标轴
pen.beginPath(60, 60)
pen.lineWidth = 3
pen.moveTo(60, 60)
pen.lineTo(60, 500)
pen.lineTo(500, 500)
pen.stroke()
pen.beginPath(500, 500)
pen.moveTo(500, 500)
pen.lineTo(470, 510)
pen.moveTo(500, 500)
pen.lineTo(470, 490)
pen.stroke()
//坐标轴上的箭头
pen.beginPath(60, 60)
pen.moveTo(60, 60)
pen.lineTo(50, 90)
pen.moveTo(60, 60)
pen.lineTo(70, 90)
pen.stroke()
}
//假数据
arr1 = [70, 60, 70, 100, 90, 98, 93, 78, 109, 120, 75, 78, 98, 80, 100, 91, 94, 92, 98, 79, 78, 120, 110,
90,
84, 93, 83, 91, 130, 129, 118, 73, 82, 80, 98, 71, 84, 69, 70, 92, 60, 120,90, 98, 93, 78, 109, 120, 75, 78, 98, 80, 110, 140, 97, 93
]
var a = 0
function drow() {
var x = 70
pen.beginPath(60, 500)
pen.lineWidth = 2
pen.strokeStyle = "red"
//遍历数组画出折线图,将数组中的数据当作y坐标画出来
for (let i = 0; i < arr1.length; i++) {
var x1 = x
var y1 = 400 - arr1[i]
var x2 = x + 10
var y2 = 400 - arr1[i + 1]
// console.log(x1, y1, x2, y2)
pen.moveTo(x1+a, y1)
pen.lineTo(x2+a, y2)
x += 10
pen.stroke()
}
}
//添加计时器,定时往数组中添加一个130-70的随机数
setInterval(function () {
var add = Math.random() * ((130 - 70) + 70)
arr1.push(add)
}, 300)
//添加计时器,定时清楚线条和重新画图【网格图和折线图】
setInterval(function () {
//清空线条
canvas.width = 600 //重新修改canvas宽度,相当于canvas重写,因为修改了canvas的宽度在js中相当于修改了canvas的编码,所以相当于重写
a-=3
struction()
drow()
}, 100)
</script>
</body>


 650
650


 被折叠的 条评论
为什么被折叠?
被折叠的 条评论
为什么被折叠?
 到【灌水乐园】发言


