


 本文详细介绍了如何使用ECharts库创建自定义图形,如长方体侧面,通过API控制位置和渐变填充,并展示了如何在图表中应用这些图形以展示数据。
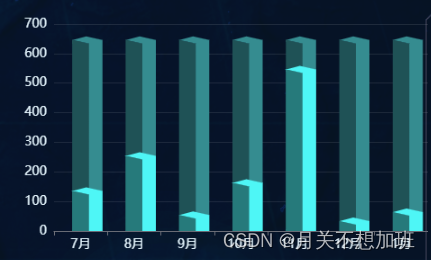
先上效果图
话不多说上参数
import * as echarts from 'echarts';

//长方体左侧面
const leftRect = echarts.graphic.extendShape({
    shape: {
      x: 0,
      y: 0,
      width: 19, //柱状图宽
      zWidth: 8, //阴影折角宽
      zHeight: 4 //阴影折角高
    },
    buildPath: function (ctx, shape) {
      const api = shape.api;
      const xAxisPoint = api.coord([shape.xValue, 0]);
      const p0 = [shape.x - shape.width / 2, shape.y - shape.zHeight];
      const p1 = [shape.x - shape.width / 2, shape.y - shape.zHeight];
      const p2 = [xAxisPoint[0] - shape.width / 2, xAxisPoint[1]];
      const p3 = [xAxisPoint[0] + shape.width / 2, xAxisPoint[1]];
      const p4 = [shape.x + shape.width / 2, shape.y];
      ctx.moveTo(p0[0], p0[1]);
      ctx.lineTo(p1[0], p1[1]);
      ctx.lineTo(p2[0], p2[1]);
      ctx.lineTo(p3[0], p3[1]);
      ctx.lineTo(p4[0], p4[1]);
      ctx.lineTo(p0[0], p0[1]);
      ctx.closePath();
    }
  });

//长方体右侧面以及顶部图形
const rightRect = echarts.graphic.extendShape({
    shape: {
      x: 0,
      y: 0,
      width: 18,
      zWidth: 15,
      zHeight: 8
    },
    buildPath: function (ctx, shape) {
      const api = shape.api;
      const xAxisPoint = api.coord([shape.xValue, 0]);
      const p1 = [shape.x - shape.width / 2, shape.y - shape.zHeight / 2];
      const p3 = [xAxisPoint[0] + shape.width / 2, xAxisPoint[1]];
      const p4 = [shape.x + shape.width / 2, shape.y];
      const p5 = [xAxisPoint[0] + shape.width / 2 + shape.zWidth, xAxisPoint[1]];
      const p6 = [
        shape.x + shape.width / 2 + shape.zWidth,
        shape.y - shape.zHeight / 2
      ];
      const p7 = [
        shape.x - shape.width / 2 + shape.zWidth,
        shape.y - shape.zHeight
      ];
      ctx.moveTo(p4[0], p4[1]);
      ctx.lineTo(p3[0], p3[1]);
      ctx.lineTo(p5[0], p5[1]);
      ctx.lineTo(p6[0], p6[1]);
      ctx.lineTo(p4[0], p4[1]);
      ctx.moveTo(p4[0], p4[1]);
      ctx.lineTo(p6[0], p6[1]);
      ctx.lineTo(p7[0], p7[1]);
      ctx.lineTo(p1[0], p1[1]);
      ctx.lineTo(p4[0], p4[1]);
      ctx.closePath();
    }
  });


 // 注册图形元素
  echarts.graphic.registerShape("leftRect", leftRect);
  echarts.graphic.registerShape("rightRect", rightRect);


//最后定义options
const options = {
    xAxis: {
      type: "category",
      data: ['111', '222', '333'],
      axisLabel: {
        textStyle: {
          color: "#AEC3DC",
          fontSize: "14px",
        },
      },
    },
    yAxis: {
      type: "value",
      axisLabel: {
        textStyle: {
          color: "#8FABBF",
          fontSize: "14px",
        },
      },
      splitLine: {
        lineStyle: {
          type: "solid",
          color: ["rgba(255,255,255,0.1)"],
        },
        show: true,
      },
    },
    grid: {
      left: "40px", // 左侧内边距
      right: 0, // 右侧内边距
      bottom: "50px", // 底部内边距
      top: "30px",
    },
    series: [
      {
        type: "custom",
        renderItem: function (params, api) {
          const index = 0;
          let location = api.coord([api.value(0) + index, api.value(1)]);
          return {
            type: "group",
            children: [
              {
                type: "leftRect",
                shape: {
                  api,
                  xValue: api.value(0) + index,
                  yValue: api.value(1),
                  x: location[0],
                  y: location[1],
                },
                style: {
                  fill: new echarts.graphic.LinearGradient(0, 0, 0, 1, [
                    {
                      offset: 0,
                      color: "#2DAEFF",
                    },
                    {
                      offset: 1,
                      color: "rgba(1,219,243,0)",
                    },
                  ]),
                },
              },
              {
                type: "rightRect",
                shape: {
                  api,
                  xValue: api.value(0) + index,
                  yValue: api.value(1),
                  x: location[0],
                  y: location[1],
                },
                style: {
                  fill: new echarts.graphic.LinearGradient(0, 0, 0, 1, [
                    {
                      offset: 0,
                      color: "#1C4667",
                    },
                    {
                      offset: 1,
                      color: "rgba(1,219,243,0)",
                    },
                  ]),
                },
              },
            ],
          };
        },
        data: [1,2,3],
      },
    ],
}


 被折叠的 条评论
为什么被折叠?
被折叠的 条评论
为什么被折叠?
 到【灌水乐园】发言


