


 本文详细展示了如何使用ECharts库创建一个带有类别轴和值轴的柱状图,以及如何添加分隔符,以直观地呈现种壕街道、广陈镇和新仓镇的数据值。
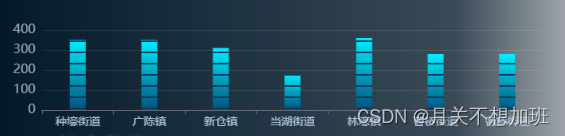
直接上效果图
再上参数
const value = [{
      type: "种壕街道",
      value: "350",
    },
    {
      type: "广陈镇",
      value: "350",
    },
    {
      type: "新仓镇",
      value: "310",
    }]
const options = {
    xAxis: {
      type: 'category',
      data: value.map(item => item.type),
      axisLabel: {
        textStyle: {
          color: '#AEC3DC',
          fontSize: '14px'
        }
      }
    },
    yAxis: {
      type: 'value',
      axisLabel: {
        textStyle: {
          color: '#8FABBF',
          fontSize: '16px'
        }
      },
      splitLine: {
        lineStyle: {
          type: "solid",
          color: ["rgba(255,255,255,0.1)"],
        },
        show: true,
      },
    },
    grid: {
      left: '40px',   // 左侧内边距
      right: 0,  // 右侧内边距
      bottom: '30px', // 底部内边距
      top: '30px',
    },
    series: [
      {
        type: "bar",
        barWidth: 20,
        itemStyle: {
          normal: {
            color: new echarts.graphic.LinearGradient(0, 0, 0, 1, [
              {
                offset: 0,
                color: "#00EFFF"
              },
              {
                offset: 1,
                color: "#00527D"
              }
            ])
          }
        },
        data: value,
        z: 10,
        zlevel: 0,
      },
      {
        // 分隔
        type: "pictorialBar",
        itemStyle: {
            normal:{
                color:"#0F375F"
            }
        },
        symbolRepeat: "fixed",
        symbolMargin: 6,
        symbol: "rect",
        symbolClip: true,
        symbolSize: [20, 2],
        symbolPosition: "start",
        symbolOffset: [0, -1],
        data: value,
        width: 25,
        z: 0,
        zlevel: 1,
      },
    ]
}


 1808
1808

 被折叠的 条评论
为什么被折叠?
被折叠的 条评论
为什么被折叠?
 到【灌水乐园】发言


