


1. 编写 docker-es-kibana.yml 文件,该文件所在位置:/data/log
version: '2.2'
services:
  es01:
    image: elasticsearch:7.8.0
    container_name: es01
    environment:
      - bootstrap.memory_lock=true
      - discovery.type=single-node
      - "ES_JAVA_OPTS=-Xms512m -Xmx512m"
    ulimits:
      memlock:
        soft: -1
        hard: -1
    volumes:
      - /data/log/es/data:/usr/share/elasticsearch/data
      - /data/logs/es/plugins:/usr/share/elasticsearch/plugins
      - /data/log/es/elasticsearch.yml:/usr/share/elasticsearch/config/elasticsearch.yml
    ports:
      - 9200:9200
    networks:
      - elastic

  kib01:
    image: kibana:7.8.0
    container_name: kib01
    ports:
      - 5601:5601
    environment:
      ELASTICSEARCH_URL: http://es01:9200
      ELASTICSEARCH_HOSTS: http://es01:9200
    networks:
      - elastic

volumes:
  data01:
    driver: local

networks:
  elastic:
    driver: bridge
2. elasticsearch.yml 文件配置,该文件所在位置:/data/log/es
cluster.name: es-docker-cluster
# 节点名称
node.name: es01
# 绑定host,0.0.0.0代表当前节点的ip
network.host: 0.0.0.0
# 设置其它节点和该节点交互的ip地址,如果不设置它会自动判断,值必须是个真实的ip地址(本机ip)
#network.publish_host: 192.168.200.135
# 设置对外服务的http端口,默认为9200
http.port: 9200
# 设置节点间交互的tcp端口,默认是9300
transport.tcp.port: 9300
# 是否支持跨域,默认为false
http.cors.enabled: true
# 当设置允许跨域,默认为*,表示支持所有域名,如果我们只是允许某些网站能访问,那么可以使用正则表达式。比如只允许本地地址。 /https?:\/\/localhost(:[0-9]+)?/
http.cors.allow-origin: "*"
# 表示这个节点是否可以充当主节点
node.master: true
# 是否充当数据节点
node.data: true
# 所有主从节点ip:port
#discovery.seed_hosts: ["192.168.200.135:9300"]  #本地只有一个节点,无法正常启动,先注释
# 这个参数决定了在选主过程中需要 有多少个节点通信  预防脑裂 N/2+1
discovery.zen.minimum_master_nodes: 1
#初始化主节点
#cluster.initial_master_nodes: ["es-node-1"]  #本地只有一个节点,无法正常启动,先注释
3. 运行es 、kibana
分配权限给es目录,进入目录: /data/log
# 进入 /data/log
cd /data/log

# 分配权限
chmod 777 es/**

# 启动 es kibana

docker-compose  -f docker-es-kibana.yml up -d
4. 在/data/log 下新建 apm目录,进入apm目录编辑文件:apm-server.yml
修改 output.elasticsearch 的地址
apm-server:
  host: "0.0.0.0:8200"
#queue:
  #mem:
    # Max number of events the queue can buffer.
    #events: 4096

#setup.template.pattern: "apm-%{[observer.version]}-*"
#setup.template.overwrite: false
#setup.template.settings:
  #index:
    #number_of_shards: 1
    #codec: best_compression
    #number_of_routing_shards: 30
    #mapping.total_fields.limit: 2000

output.elasticsearch:
  hosts: ["192.168.3.133:9200"]

  # Number of workers per Elasticsearch host.
  #worker: 1

  indices:
    - index: "apm-%{[observer.version]}-sourcemap"
      when.contains:
        processor.event: "sourcemap"

    - index: "apm-%{[observer.version]}-error-%{+yyyy.MM.dd}"
      when.contains:
        processor.event: "error"

    - index: "apm-%{[observer.version]}-transaction-%{+yyyy.MM.dd}"
      when.contains:
        processor.event: "transaction"

    - index: "apm-%{[observer.version]}-span-%{+yyyy.MM.dd}"
      when.contains:
        processor.event: "span"

    - index: "apm-%{[observer.version]}-metric-%{+yyyy.MM.dd}"
      when.contains:
        processor.event: "metric"

    - index: "apm-%{[observer.version]}-onboarding-%{+yyyy.MM.dd}"
      when.contains:
        processor.event: "onboarding"

  #max_retries: 3
  #bulk_max_size: 50
  #backoff.max: 60s
  #timeout: 90

#logging.level: info
#logging.to_syslog: true
#logging.metrics.enabled: false
#logging.metrics.period: 30s
#logging.to_files: true
#logging.files:
  #path: /var/log/apm-server
  #name: apm-server
  #rotateeverybytes: 10485760 # = 10MB
  #keepfiles: 7
  #permissions: 0600
  #interval: 0
#logging.json: false

#http.enabled: false
#http.host: localhost
#http.port: 5066
5. 在apm目录下执行命令
docker run -d --name=apm-server --user=apm-server --volume="$(pwd)/apm-server.yml:/usr/share/apm-server/apm-server.yml:ro" -p 8200:8200 docker.io/elastic/apm-server:7.9.06. 在kibana添加apm插件
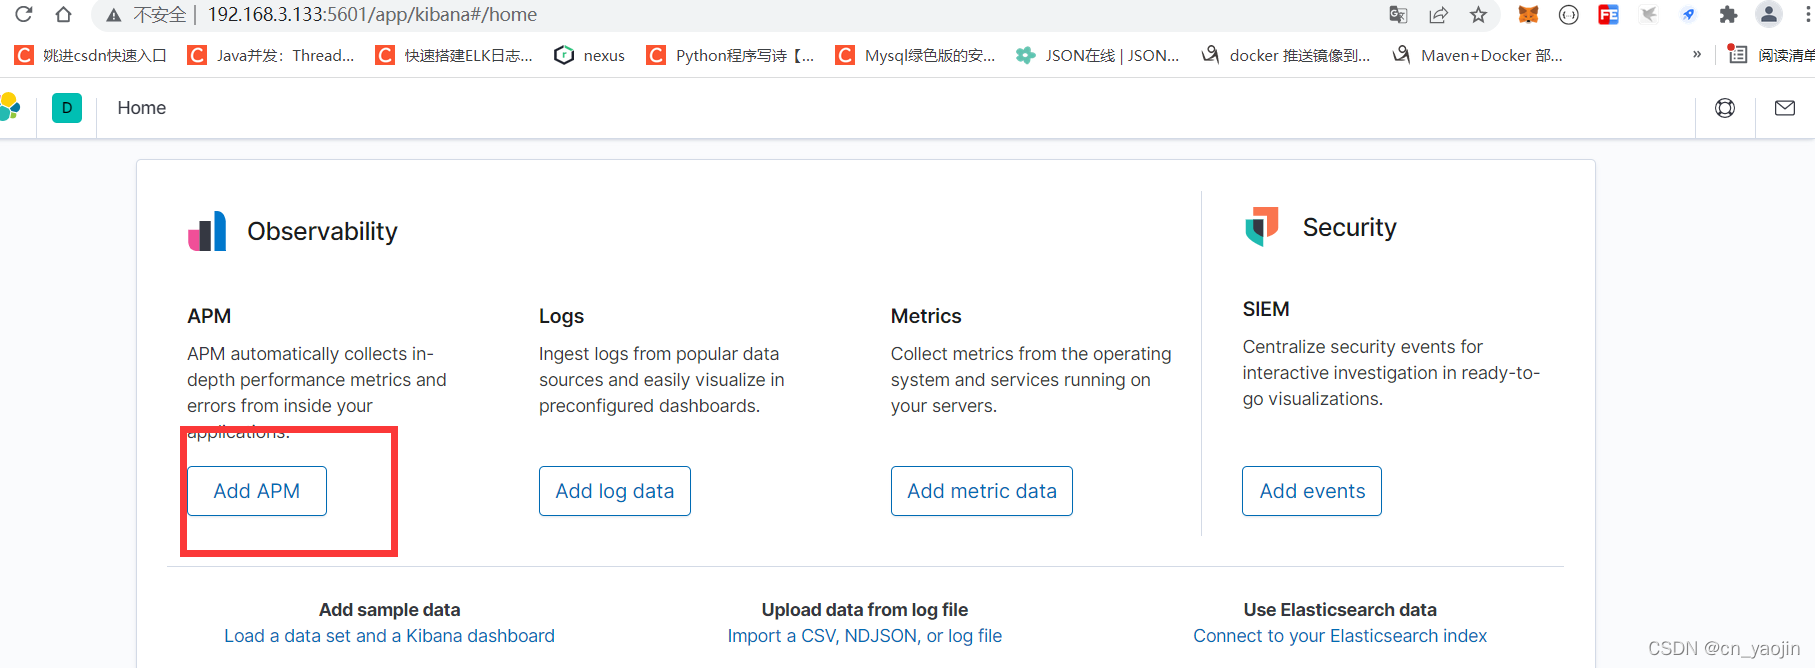
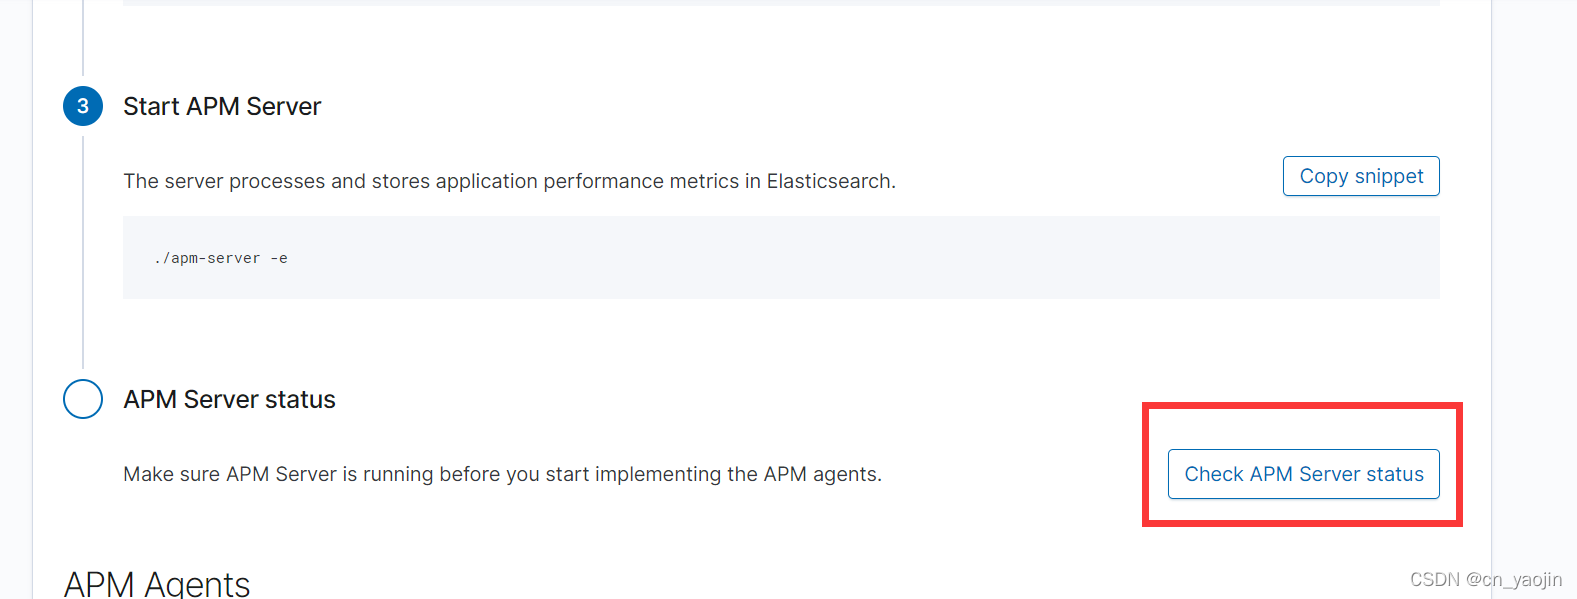
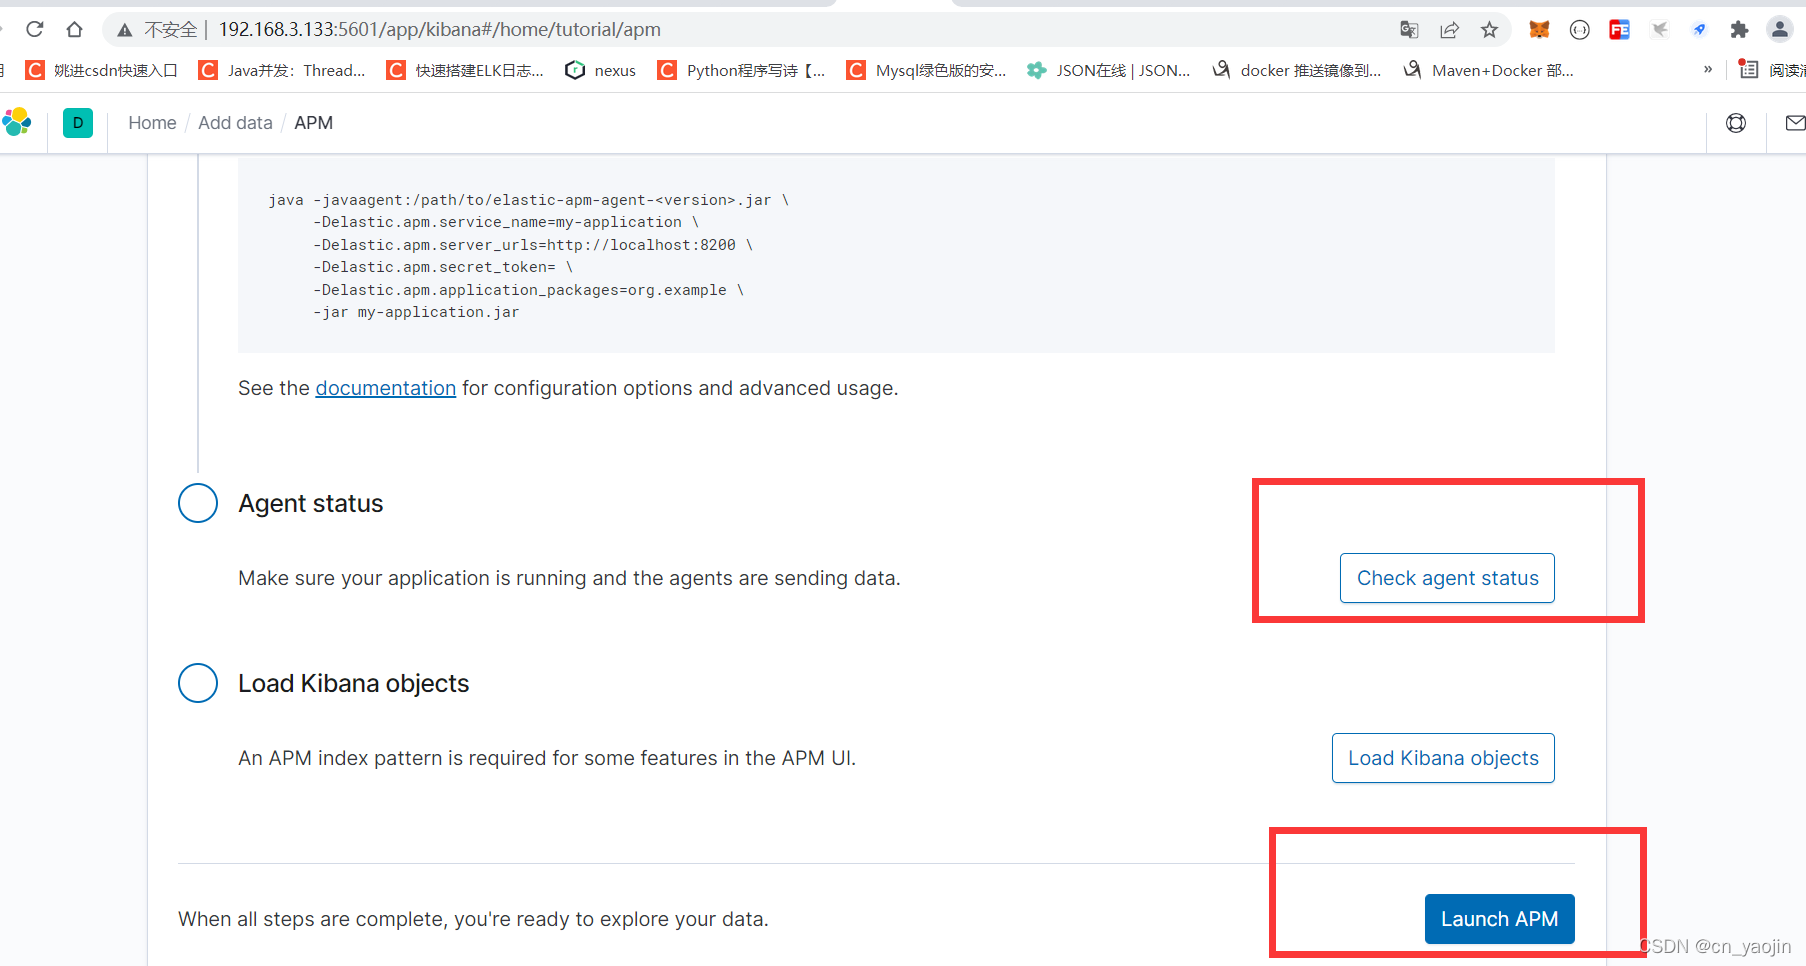
7. springboot项目中
引入maven依赖
 <!--链路监控-->
        <dependency>
            <groupId>co.elastic.apm</groupId>
            <artifactId>apm-agent-attach</artifactId>
            <version>1.17.0</version>
        </dependency>
在启动main方法中加入:ElasticApmAttacher.attach();
@EnableScheduling
public class FundMobileApplication {
    public static void main(String[] args) {

        ElasticApmAttacher.attach();
        SpringApplication.run(FundMobileApplication.class, args);
    }
}
在resources目录先新增:elasticapm.properties
# 配置服务名称
service_name=mobile-fund

# 配置应用所在基础包
application_packages=com.cn

# 配置APM Server的访问地址
server_urls=http://192.168.3.133:8200
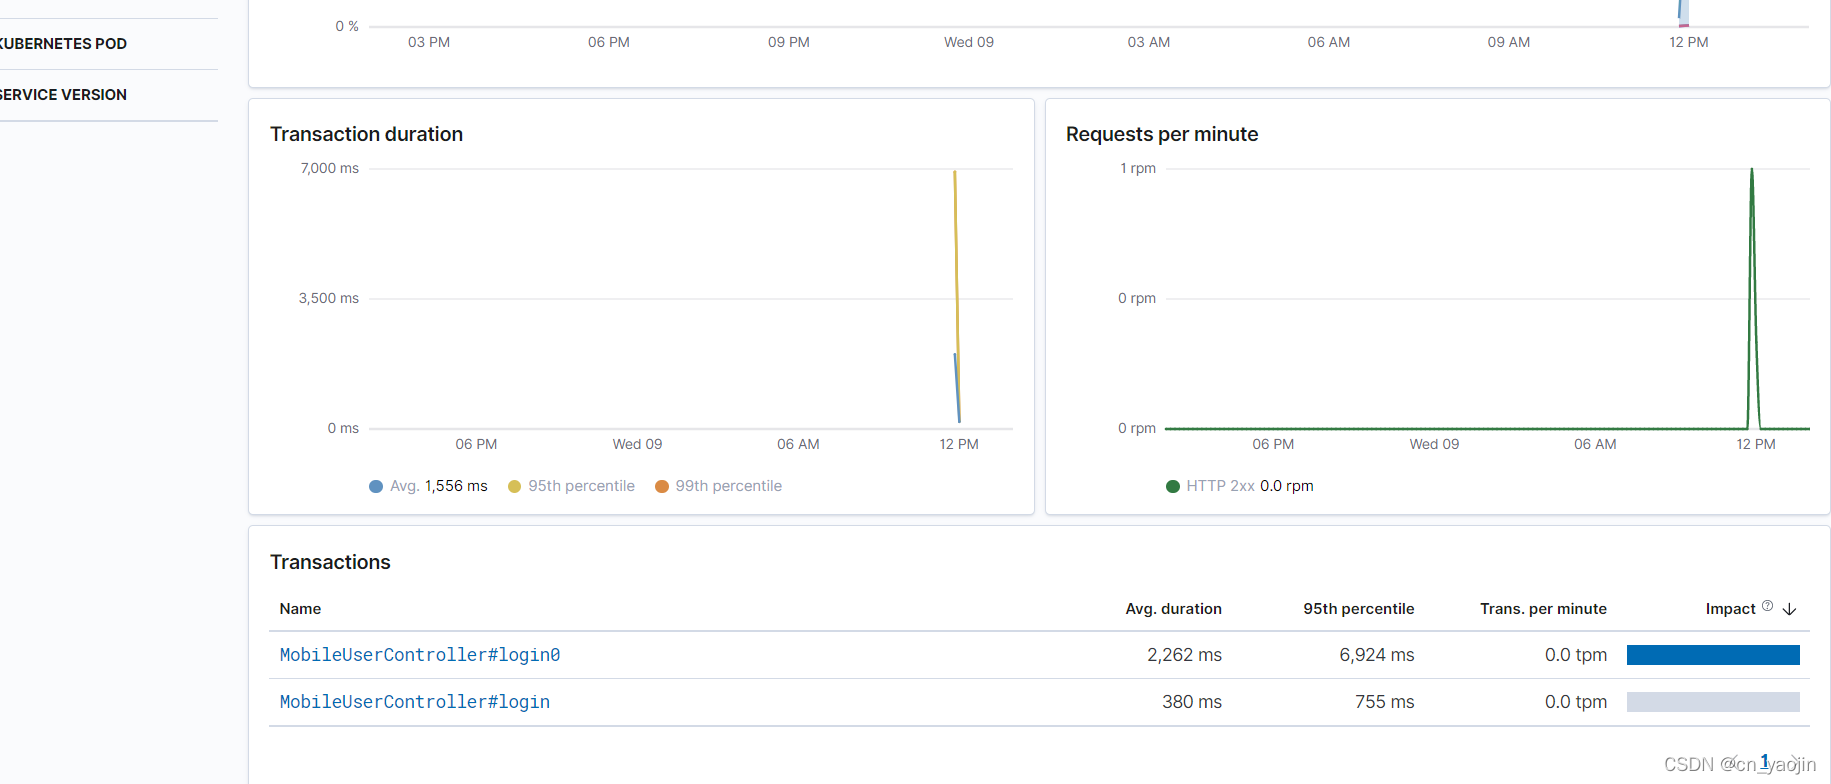
8. kibana查看效果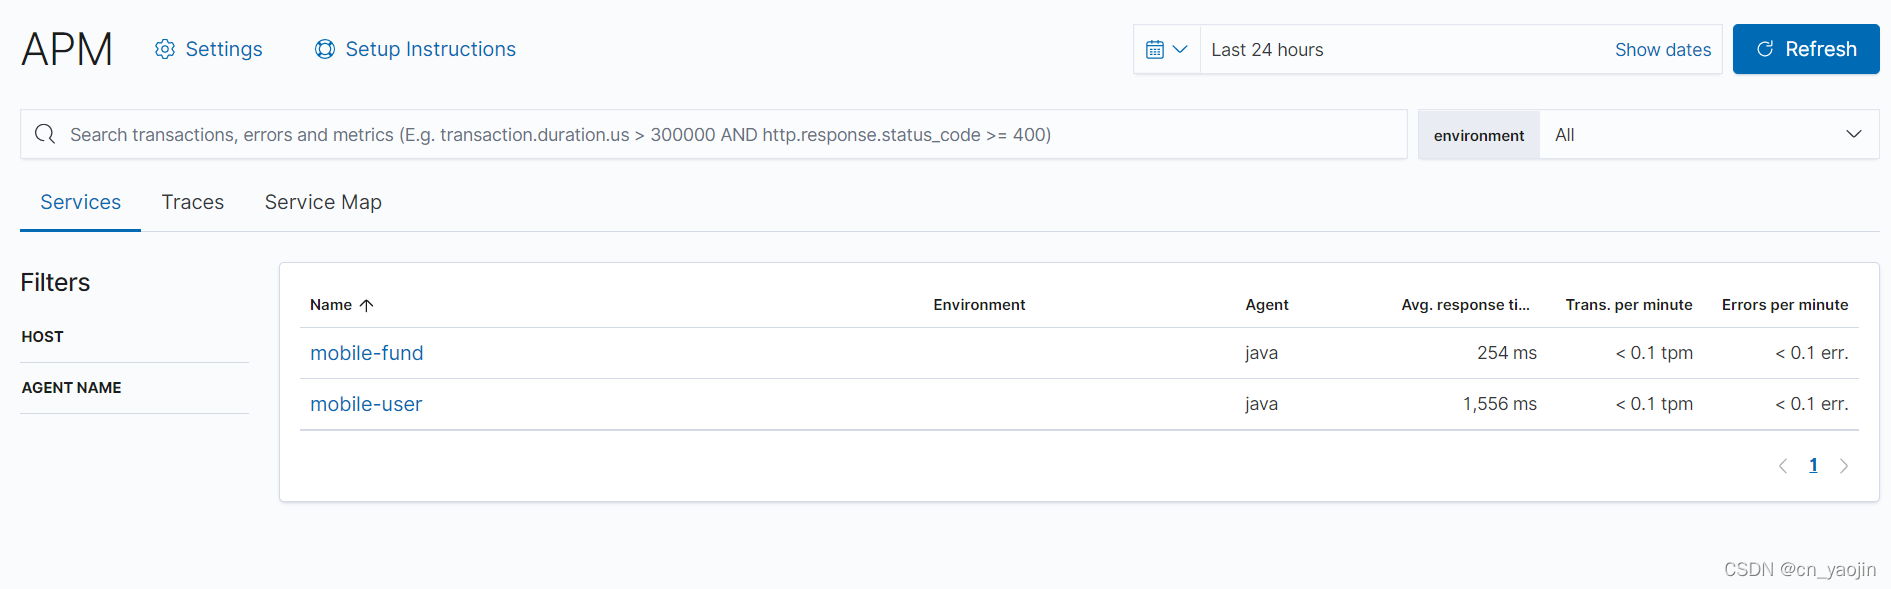


 4376
4376

 被折叠的 条评论
为什么被折叠?
被折叠的 条评论
为什么被折叠?
 到【灌水乐园】发言


