


一、简介
Prometheus是一个开源监控系统,Prometheus架构图如下:

我们在上一篇介绍了Prometheus Grafana 简介与安装Prometheus Grafana 安装_码农_程序员的博客-CSDN博客_grafana tar包安装,这遍介绍了采用exporter插件主动获取数据(默认采取pull拉取数据)。
我们有一些需要脚本、或者代码方式推送监控信息,这时就需要Pushgateway,Pushgateway也是prometheus的一个组件。Pushgateway需要把监控数据发送给Prometheus server
二、安装
https://github.com/prometheus/pushgateway/releases
1、 启动
./pushgateway &
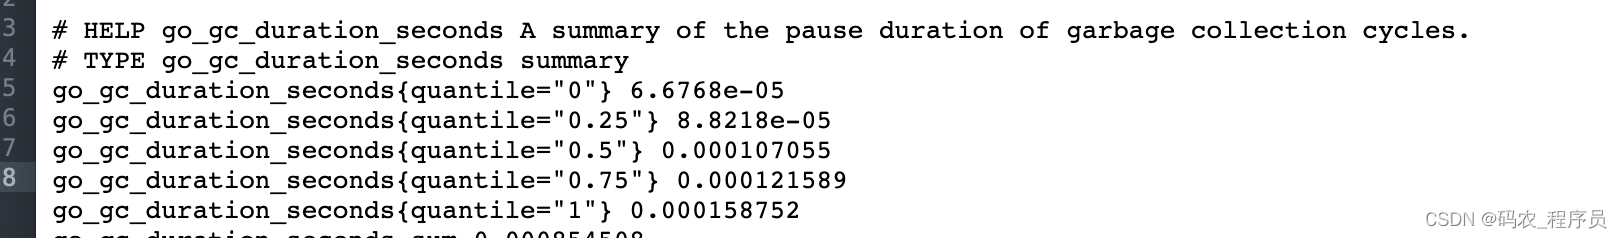
2、验证是否成功
http://xx.xx.xx.xx:9091/metric
3、pushgateway添加prometheus的prometheus.yml
 - job_name: pushgateway
    honor_labels: true
    static_configs:
    - targets: ['localhost:9091']
      labels:
        instance: pushgateway
        service: pushgatewayservice


 819
819


 被折叠的 条评论
为什么被折叠?
被折叠的 条评论
为什么被折叠?
 到【灌水乐园】发言


