


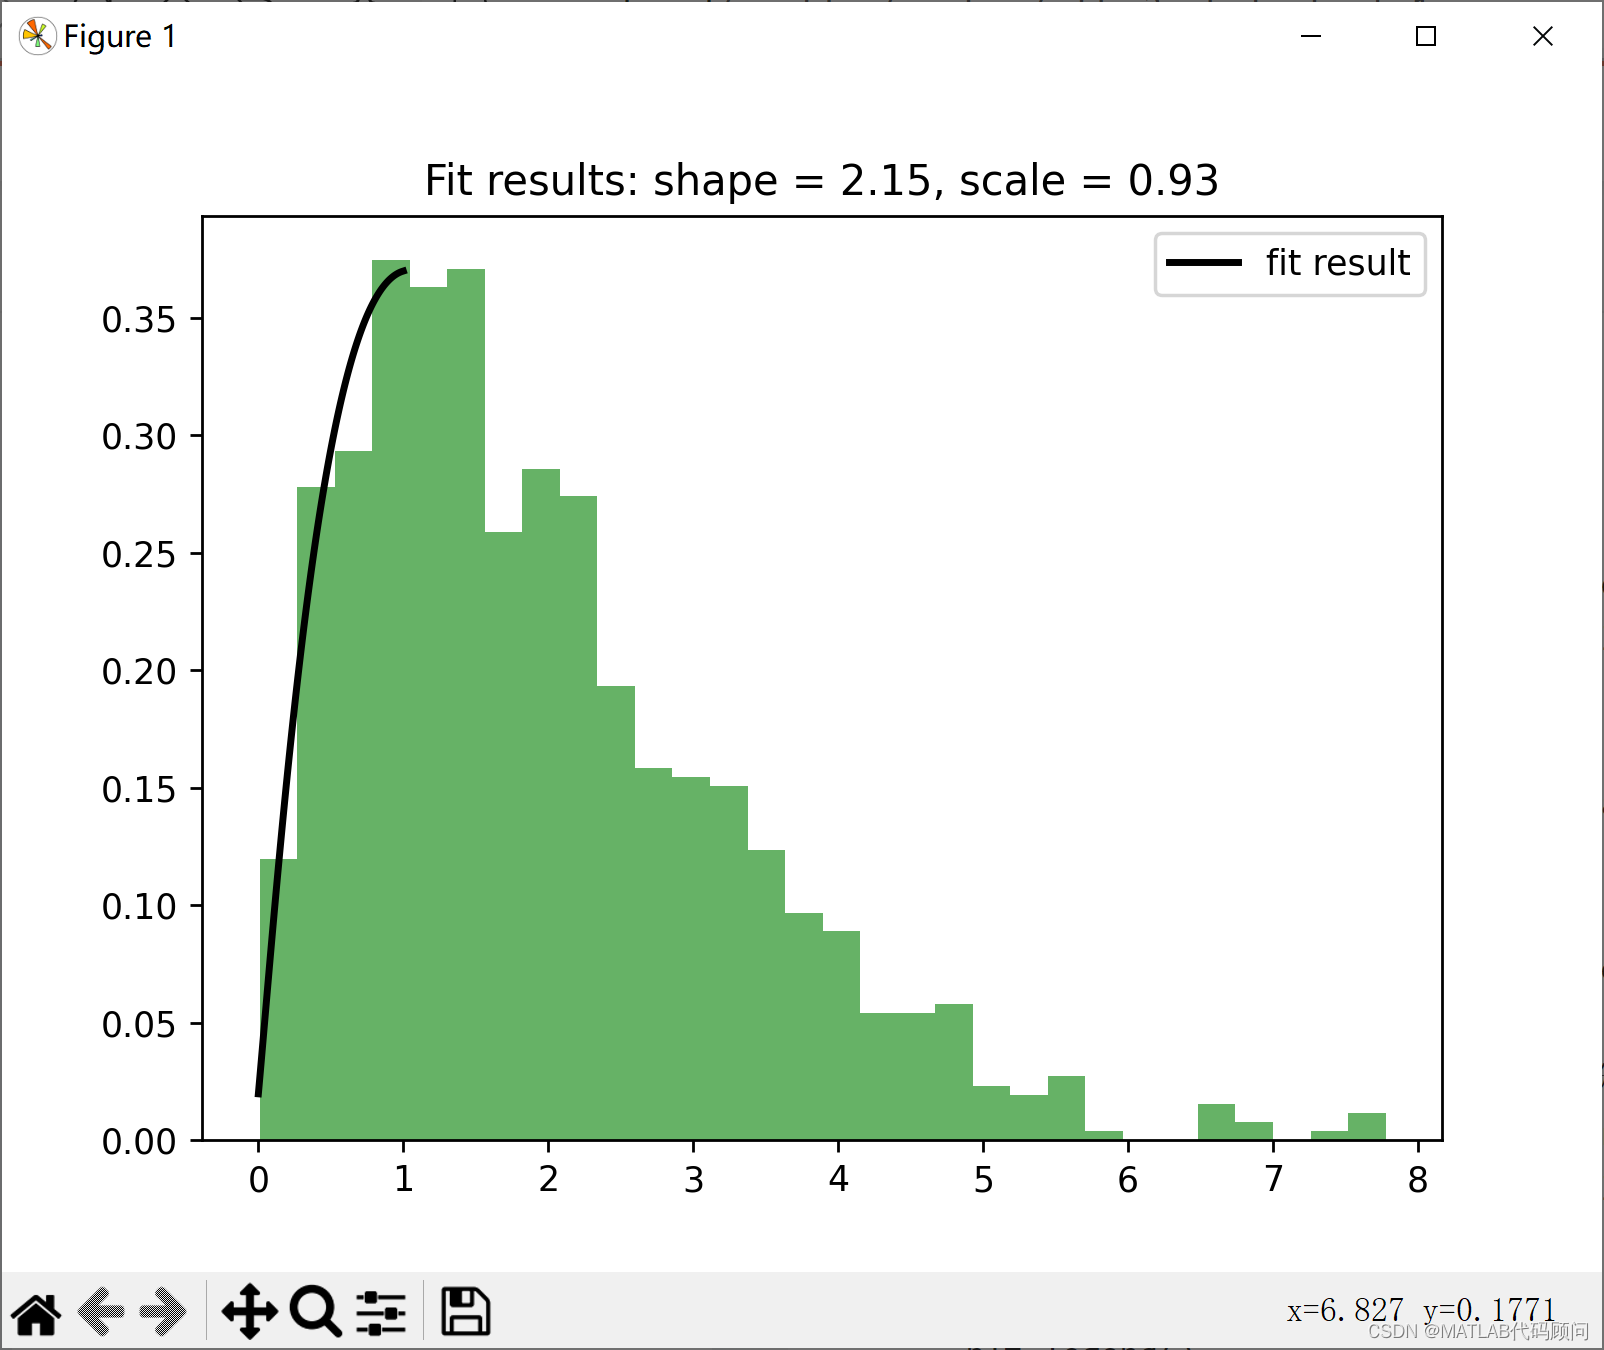
在Python中,可以使用scipy.stats库中的gamma类来拟合gamma分布,并使用matplotlib库来进行绘图
import numpy as np
import matplotlib.pyplot as plt
from scipy.stats import gamma

# 创建一些符合gamma分布的数据
shape, scale = 2., 1.  # shape and scale parameters
data = np.random.gamma(shape, scale, 1000)

# 使用scipy的gamma类来拟合数据
shape_fit, loc_fit, scale_fit = gamma.fit(data)
xmin, xmax = plt.xlim()
x = np.linspace(xmin, xmax, 100)
p = gamma.pdf(x, shape_fit, loc=loc_fit, scale=scale_fit)

# 绘制原始数据的直方图和拟合的gamma分布曲线
plt.hist(data, bins=30, density=True, alpha=0.6, color='g')
plt.plot(x, p, 'k', linewidth=2, label="fit result")

# 添加图例和标题
plt.legend()
title = "Fit results: shape = %.2f, scale = %.2f" % (shape_fit, scale_fit)
plt.title(title)

# 显示图形
plt.show()


 被折叠的 条评论
为什么被折叠?
被折叠的 条评论
为什么被折叠?
 到【灌水乐园】发言


