


目录
汇总函数:describe(),unique(),value_counts()
导入库
import pandas as pd创建、读写、显示
创建DataFrame与Series
>>> pd.DataFrame({'Yes':[50,21],"No":[131,2]})
   Yes   No
0   50  131
1   21    2
>>> #数据框的内容也可以为字符串
>>> pd.DataFrame({'Bob':['T like it.','It was awful.'],'Sue':['Pretty good.','Bland.']})
             Bob           Sue
0     T like it.  Pretty good.
1  It was awful.        Bland.
>>> #设置行索引
>>> pd.DataFrame({'Bob': ['I liked it.', 'It was awful.'],
              'Sue': ['Pretty good.', 'Bland.']},
             index=['Product A', 'Product B'])
                     Bob           Sue
Product A    I liked it.  Pretty good.
Product B  It was awful.        Bland.
>>> #创建Series
>>> pd.Series([1,2,3,4,5])
0    1
1    2
2    3
3    4
4    5
dtype: int64
>>> #Series无列名,只有一个总体的名称
>>> pd.Series([30, 35, 40], index=['2015 Sales', '2016 Sales', '2017 Sales'], name='Product A')
2015 Sales    30
2016 Sales    35
2017 Sales    40
Name: Product A, dtype: int64
读取、保存数据文件
DataFrame可以保存为不同的格式,也可以从不同格式的文件中读取,如csv, json, hdf, feather, parquet等。不同格式具有不同的存读效率,下面创建一个数据框,保存成不同的格式并读取,测试5次, 比较各自的效率:
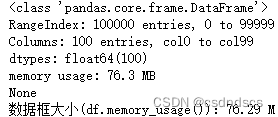
df=pd.DataFrame(dict([('col'+str(i),np.random.rand(100000)) for i in range(100)]))
print(df.info(verbose=False))
print('数据框大小(df.memory_usage()):%.2f M'%(df.memory_usage().sum()/1024**2))
print('用不同格式保存和加载数据框所用的时间:')
format_list=['csv','feather','hdf','json','parquet'] #xlsx格式巨慢,不列入
multi_save_time_dict=dict([(f,[]) for f in format_list])
multi_read_time_dict=dict([(f,[]) for f in format_list])
for n in tqdm(range(5)):
    for i in format_list:
        start_save_time=time.time()
        if i=='hdf':
            df.to_hdf('test_df.h5',key='df',mode='w')
        else:
            eval(f'df.to_{i}("test_df.{i}")')
        time_cost=np.round(time.time()-start_save_time,2)
        print(f'to_{i}: %.2f s'%(time_cost))
        multi_save_time_dict[i].append(time_cost)

        start_load_time=time.time()
        if i=='hdf':
            pd.read_hdf('test_df.h5',key='df')
        else:
            eval(f'pd.read_{i}("test_df.{i}")')
        time_cost=np.round(time.time()-start_load_time,2)
        print(f'read_{i}: %.2f s'%(time_cost))
        multi_read_time_dict[i].append(time_cost)
mean_save_time_dict=dict([(f,np.round(np.mean(multi_save_time_dict[f]),2)) for f in multi_save_time_dict])
std_save_time_dict=dict([(f,np.round(np.std(multi_save_time_dict[f]),2)) for f in multi_save_time_dict])
mean_read_time_dict=dict([(f,np.round(np.mean(multi_read_time_dict[f]),2)) for f in multi_read_time_dict])
std_read_time_dict=dict([(f,np.round(np.std(multi_read_time_dict[f]),2)) for f in multi_read_time_dict])
mean_std_save_time_dict=dict([(f,str(mean_save_time_dict[f])+'('+str(std_save_time_dict[f])+')') for f in mean_save_time_dict])
mean_std_read_time_dict=dict([(f,str(mean_read_time_dict[f])+'('+str(std_read_time_dict[f])+')') for f in mean_read_time_dict])
time_df=pd.DataFrame({'Time to save(s)':mean_std_save_time_dict,'Time to read(s)':mean_std_read_time_dict})
display(time_df)
DataFrame信息及不同格式所花的存读时间如下:
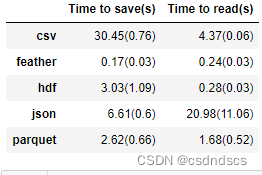
可知存读为csv与json格式 需要花费较多的时间,并且保存时,也会占用较大的内存:

故大型数据框不推荐保存为这两种格式。
设置显示格式
#显示所有列(参数设置为None代表显示所有列,也可以自行设置数字)
pd.set_option('display.max_columns',None)
#显示所有行
pd.set_option('display.max_rows',None)
#设置数据的显示长度,默认为50
pd.set_option('max_colwidth',200)
#禁止自动换行(设置为Flase不自动换行,True反之)
pd.set_option('expand_frame_repr', False)
列数据对齐
#列数据对齐
>>> df    #对齐前
   f10     f12    f14    f2  f23   f3  f8    f9
0   79  000001   平安银行  2150  142 -129  30  1442
1   61  000002  万  科A  3000  155   57  39   840
2    0  000003  PT金田A     0    0    0   0     0
>>> pd.set_option('display.unicode.ambiguous_as_wide', True)
>>> df
   f10     f12    f14    f2  f23   f3  f8    f9
0   79  000001   平安银行  2150  142 -129  30  1442
1   61  000002  万  科A  3000  155   57  39   840
2    0  000003  PT金田A     0    0    0   0     0
>>> pd.set_option('display.unicode.east_asian_width', True)    #只用这一行似乎也可
>>> df    #对齐后
   f10     f12       f14    f2  f23   f3  f8    f9
0   79  000001  平安银行  2150  142 -129  30  1442
1   61  000002  万  科A  3000  155   57  39   840
2    0  000003   PT金田A     0    0    0   0     0
>>> pd.set_option('display.width', 180) # 设置打印宽度(**重要**)
>>> df
   f10     f12       f14    f2  f23   f3  f8    f9
0   79  000001  平安银行  2150  142 -129  30  1442
1   61  000002  万  科A  3000  155   57  39   840
2    0  000003   PT金田A     0    0    0   0     0
索引、选择
>>> #导入数据并设置最大显示行数为5
>>> import pandas as pd
>>> reviews = pd.read_csv("winemag-data-130k-v2.csv", index_col=0)
>>> pd.set_option('max_rows', 5)
>>> reviews
         country description designation  points  price   province region_1 region_2 taster_name taster_twitter_handle      title    variety     winery
0          Italy  Aromas...   Vulkà ...       87    NaN  Sicily...     Etna      NaN  Kerin ...   @kerin...             Nicosi...  White ...    Nicosia
1       Portugal  This i...    Avidagos       87   15.0      Douro      NaN      NaN  Roger ...   @vossr...             Quinta...  Portug...  Quinta...
...          ...        ...         ...      ...    ...        ...      ...      ...        ...         ...                   ...        ...        ...
129969    France  A dry ...         NaN       90   32.0     Alsace   Alsace      NaN  Roger ...   @vossr...             Domain...  Pinot ...  Domain...
129970    France  Big, r...   Lieu-d...       90   21.0     Alsace   Alsace      NaN  Roger ...   @vossr...             Domain...  Gewürz...  Domain...

[129971 rows x 13 columns]
取行
>>> reviews.iloc[0]  #用行号访问第一行,返回Series
>>> reviews.iloc[[0]]  #用行号访问第一行,返回DataFrame
>>> reviews.iloc[-5:]  #取后5行,返回DataFrame
>>> reviews.iloc[2:4]  #第三行与第四行
>>> reviews[2:4]  #取第三行与第四行
>>> reviews.loc[[2,4]]  #取不连续的多行

  country  ...        winery
2      US  ...     Rainstorm
4      US  ...  Sweet Cheeks

[2 rows x 13 columns]
取列
>>> #取一列
>>> reviews['country']  #用列名访问,返回Series
>>> reviews.country  #用.访问,名称中有空格时不适用,返回Series
>>> reviews.loc[:,'country']  #同reviews['country'],返回Series
>>> reviews.iloc[:,0]  #或用列位置索引访问,选取第1列,返回Series
>>> reviews[['country']]  #取country列,返回DataFrame
>>> reviews.loc[:,['country']]  #同reviews[['country']]
>>> reviews.iloc[:,[0]]  #取第0列,用位置索引访问,返回DataFrame

         country
0          Italy
1       Portugal
...          ...
129969    France
129970    France

[129971 rows x 1 columns]

>>> #取多列,返回DataFrame
>>> reviews.loc[:'country':'points']  #取从country到points(包含points)的所有列,country列需在points列之前
>>> reviews.iloc[:,0:4]  #取第0列到第4列(不包含第四列)的所有列
>>> reviews[['country','points']]  #取不连续的country与points列、
>>> reviews.loc[:,['country','points']]  #同reviews[['country','points']]
>>> reviews.iloc[:,[0,3]]  #取不连续的第0列与第2列

         country  points
0          Italy      87
1       Portugal      87
...          ...     ...
129969    France      90
129970    France      90

[129971 rows x 2 columns]
同时取行列
>>> #取单个值,返回类型为值的类型
>>> reviews['country'][0]  #取country列第一个值
>>> reviews.loc[0,'country']  #取第0行country列的值
>>> reviews.iloc[1,0]  #取第一行第0列的值

>>> #取多个值
>>> reviews.iloc[1:4,0]  #选取第2行到第4行的第一列,连续索引,返回Series
>>> reviews.iloc[[1,3],0]  #选取第2行第4行的第一列,分散索引,返回Series
>>> reviews.iloc[[1,3],[0]]  #选取第2行第4行的第一列,分散索引,返回DataFrame
>>> reviews.iloc[[1,3],2:5]  #选取第2行第4行的第3列到第5列,连续索引,返回DataFrame
>>> reviews.iloc[[1,3],[2,5]]  #选取第2行第4行的第3列和第6列,分散索引,返回DataFrame
>>> reviews.loc[1,['country','points']]  #选取第2行的country与points列,分散索引,返回Series
>>> reviews.loc[[1],['country','points']]  #选取第2行的country与points列,分散索引,返回DataFrame
>>> reviews.loc[[1,3],['country','points']]  #选取第2行与第4行的country与points列,分散索引,返回DataFrame
>>> reviews.loc[[1,3],'country':'points']  #选取第2行与第4行的country到points列,返回DataFrame

    country  ... points
1  Portugal  ...     87
3        US  ...     87

[2 rows x 4 columns]
将某列设为行索引
>>> reviews.set_index('title')

                                                     country  ...                winery
title                                                         ...
Nicosia 2013 Vulkà Bianco  (Etna)                      Italy  ...               Nicosia
Quinta dos Avidagos 2011 Avidagos Red (Douro)       Portugal  ...   Quinta dos Avidagos
...                                                      ...  ...                   ...
Domaine Marcel Deiss 2012 Pinot Gris (Alsace)         France  ...  Domaine Marcel Deiss
Domaine Schoffit 2012 Lieu-dit Harth Cuvée Caro...    France  ...      Domaine Schoffit

[129971 rows x 12 columns]
条件选取
>>> #判断每行country是否为Italy,返回Series
>>> reviews.country == 'Italy'

0          True
1         False
          ...
129969    False
129970    False
Name: country, Length: 129971, dtype: bool

>>> reviews[reviews.country == 'Italy']  #选取country为Italy的行
>>> reviews.loc[reviews.country == 'Italy']  #同上,可不用loc
>>> reviews[reviews['points'] == 90]  #选取points为90的行
>>> reviews.loc[(reviews.country == 'Italy') & (reviews.points >= 90)]  #选取country为Italy且points>=90的行
>>> reviews.loc[(reviews.country == 'Italy') | (reviews.points >= 90)]  #选取country为Italy或points>=90的行
>>> reviews.loc[reviews.country.isin(['Italy', 'France'])]  #选取country为Italy或France的行
>>> reviews.loc[reviews.price.isnull()]  #选取price为空的行
>>> reviews.loc[reviews.price.notnull()]  #选取price为非空的行
>>> reviews[reviews['description'].str.contains('great')]  #选取description列中包含great的行,有空值报错时添加参数na=False
                                                        #,即reviews[reviews['description'].str.contains('great',na=False)]
>>> reviews[~reviews['description'].str.contains('great')]  #选取description列中不包含great的行

         country  ...                winery
0          Italy  ...               Nicosia
1       Portugal  ...   Quinta dos Avidagos
...          ...  ...                   ...
129969    France  ...  Domaine Marcel Deiss
129970    France  ...      Domaine Schoffit

[125196 rows x 13 columns]
汇总函数与映射
导入数据
>>> #导入数据并设置最大显示行数为5
>>> import pandas as pd
>>> reviews = pd.read_csv("winemag-data-130k-v2.csv", index_col=0)
>>> pd.set_option('max_rows', 5)
>>> reviews
         country description designation  points  price   province region_1 region_2 taster_name taster_twitter_handle      title    variety     winery
0          Italy  Aromas...   Vulkà ...       87    NaN  Sicily...     Etna      NaN  Kerin ...   @kerin...             Nicosi...  White ...    Nicosia
1       Portugal  This i...    Avidagos       87   15.0      Douro      NaN      NaN  Roger ...   @vossr...             Quinta...  Portug...  Quinta...
...          ...        ...         ...      ...    ...        ...      ...      ...        ...         ...                   ...        ...        ...
129969    France  A dry ...         NaN       90   32.0     Alsace   Alsace      NaN  Roger ...   @vossr...             Domain...  Pinot ...  Domain...
129970    France  Big, r...   Lieu-d...       90   21.0     Alsace   Alsace      NaN  Roger ...   @vossr...             Domain...  Gewürz...  Domain...

[129971 rows x 13 columns]
汇总函数:describe(),unique(),value_counts()
>>> reviews.points.describe()  #返回数值列数据的均值、最大最小值等性质

count    129971...
mean     88.447138
           ...
75%      91.000000
max      100.00...
Name: points, Length: 8, dtype: float64

>>> reviews.taster_name.describe()  #返回文本列文本的一些性质

count        103727
unique           19
top       Roger ...
freq          25514
Name: taster_name, dtype: object

>>> reviews.points.mean()  #取points列的平均值

>>> reviews.taster_name.unique() #查看taster_name列数据有多少种,返回数组

array(['Kerin O’Keefe', 'Roger Voss', 'Paul Gregutt',
       'Alexander Peartree', 'Michael Schachner', 'Anna Lee C. Iijima',
       'Virginie Boone', 'Matt Kettmann', nan, 'Sean P. Sullivan',
       'Jim Gordon', 'Joe Czerwinski', 'Anne Krebiehl\xa0MW',
       'Lauren Buzzeo', 'Mike DeSimone', 'Jeff Jenssen',
       'Susan Kostrzewa', 'Carrie Dykes', 'Fiona Adams',
       'Christina Pickard'], dtype=object)

>>> reviews.taster_name.value_counts()  #查看taster_name列数据每种有多少个

Roger Voss           25514
Michael Schachner    15134
                     ...
Fiona Adams             27
Christina Pickard        6
Name: taster_name, Length: 19, dtype: int64
map()与apply()
>>> #数据列扣除平均值
>>> review_points_mean = reviews.points.mean()
>>> reviews.points-review_points_mean  #返回Series,扣除平均值最快的方法,结果同下
>>> reviews.points.map(lambda p: p - review_points_mean)  #返回Series,不改变原DataFrame

0        -1.447138
1        -1.447138
            ...
129969    1.552862
129970    1.552862
Name: points, Length: 129971, dtype: float64
>>>map(lambda p: p - review_points_mean,tqdm(reviews.points))#用此种方法可以展示进度条

>>> #apply()方法逐行更改数据,较慢
>>> def remean_points(row):
    row.points = row.points - review_points_mean
    return row
>>> reviews.apply(remean_points, axis='columns')  #返回新的DataFrame,不改变原DataFrame

         country description designation    points  price   province region_1 region_2 taster_name taster_twitter_handle      title    variety     winery
0          Italy  Aromas...   Vulkà ...  -1.447138    NaN  Sicily...     Etna      NaN  Kerin ...   @kerin...             Nicosi...  White ...    Nicosia
1       Portugal  This i...    Avidagos  -1.447138   15.0      Douro      NaN      NaN  Roger ...   @vossr...             Quinta...  Portug...  Quinta...
...          ...        ...         ...        ...    ...        ...      ...      ...        ...         ...                   ...        ...        ...
129969    France  A dry ...         NaN   1.552862   32.0     Alsace   Alsace      NaN  Roger ...   @vossr...             Domain...  Pinot ...  Domain...
129970    France  Big, r...   Lieu-d...   1.552862   21.0     Alsace   Alsace      NaN  Roger ...   @vossr...             Domain...  Gewürz...  Domain...

[129971 rows x 13 columns]
多进程用于DataFrame
python中multiprocessing.pool和pandas如何结合使用? - 知乎
def parallelize_df(df, func, num_processes=6):
    df_split = np.array_split(df, num_processes)
    with mp.Pool(num_processes) as p:
        df = pd.concat(p.map(func, df_split))
    return df
连接两列文本
>>> import pandas as pd
>>> import numpy as np

>>> df=pd.DataFrame({'c1':['d11','d21'],'c2':[np.nan,'d22']})
>>> df
    c1   c2
0  d11  NaN
1  d21  d22
>>> df['c3']=df.c1+' '+df.c2    #当有缺失值时,用+连接后的结果也为缺失值
>>> df['c4']=df.c1+' '+df.c2.fillna('')    #可用fillna填充缺失值
>>> df
    c1   c2       c3       c4
0  d11  NaN      NaN     d11
1  d21  d22  d21 d22  d21 d22
分组与排序
导入数据
>>> #导入数据并设置最大显示行数为5
>>> import pandas as pd
>>> reviews = pd.read_csv("winemag-data-130k-v2.csv", index_col=0)
>>> pd.set_option('max_rows', 5)
>>> reviews
         country description designation  points  price   province region_1 region_2 taster_name taster_twitter_handle      title    variety     winery
0          Italy  Aromas...   Vulkà ...       87    NaN  Sicily...     Etna      NaN  Kerin ...   @kerin...             Nicosi...  White ...    Nicosia
1       Portugal  This i...    Avidagos       87   15.0      Douro      NaN      NaN  Roger ...   @vossr...             Quinta...  Portug...  Quinta...
...          ...        ...         ...      ...    ...        ...      ...      ...        ...         ...                   ...        ...        ...
129969    France  A dry ...         NaN       90   32.0     Alsace   Alsace      NaN  Roger ...   @vossr...             Domain...  Pinot ...  Domain...
129970    France  Big, r...   Lieu-d...       90   21.0     Alsace   Alsace      NaN  Roger ...   @vossr...             Domain...  Gewürz...  Domain...

[129971 rows x 13 columns]
分组分析
>>> #按points不同分类,并统计每种points有多少行,返回Series
>>> reviews.groupby('points').size()  #方法1
>>> reviews.groupby('points').points.count()  #方法2
>>> reviews.points.value_counts()  #方法3,顺序可能不同,该方法没有Series列名

88     17207
87     16933
       ...
99        33
100       19
Name: points, Length: 21, dtype: int64

>>> #按points不同分类,并统计每种points种的最小price
>>> reviews.groupby('points').price.min()

points
80      5.0
81      5.0
       ...
99     44.0
100    80.0
Name: price, Length: 21, dtype: float64

>>> #按winery不同分类,查看每类中第一行的title
>>> reviews.groupby('winery').apply(lambda df: df.title.iloc[0])

winery
1+1=3       1+1=3 ...
10 Knots    10 Kno...
              ...
àMaurice    àMauri...
Štoka       Štoka ...
Length: 16757, dtype: object
>>> #根据多列(country,province)分类,并找出每类中points最高的行
>>> reviews.groupby(['country', 'province']).apply(lambda df: df.loc[df.points.idxmax()])

                        country description designation  points  price   province region_1 region_2 taster_name taster_twitter_handle      title    variety     winery
country   province
Argentina Mendoza...  Argentina  If the...   Nicasi...       97  120.0  Mendoz...  Mendoza      NaN  Michae...   @wines...             Bodega...     Malbec  Bodega...
          Other       Argentina  Take n...     Reserva       95   90.0      Other    Salta      NaN  Michae...   @wines...             Colomé...     Malbec     Colomé
...                         ...        ...         ...      ...    ...        ...      ...      ...        ...         ...                   ...        ...        ...
Uruguay   San Jose      Uruguay  Baked,...   El Pre...       87   50.0   San Jose      NaN      NaN  Michae...   @wines...             Castil...  Red Blend  Castil...
          Uruguay       Uruguay  Cherry...   Blend ...       91   22.0    Uruguay      NaN      NaN  Michae...   @wines...             Narbon...  Tannat...    Narbona

[425 rows x 13 columns]

>>> #按country分类,并统计每类有多少行及每类的最大值最小值
>>> reviews.groupby(['country']).price.agg([len, min, max])

              len   min    max
country
Argentina  3800.0   4.0  230.0
Armenia       2.0  14.0   15.0
...           ...   ...    ...
Ukraine      14.0   6.0   13.0
Uruguay     109.0  10.0  130.0

[43 rows x 3 columns]
多层索引
>>> #按country和province分类,查看每类有多少个
>>> countries_reviewed = reviews.groupby(['country', 'province']).description.agg([len])
>>> countries_reviewed

                       len
country   province
Argentina Mendoza...  3264
          Other        536
...                    ...
Uruguay   San Jose       3
          Uruguay       24

[425 rows x 1 columns]

>>> #查看数据类型
>>> mi = countries_reviewed.index
>>> type(mi)
<class 'pandas.core.indexes.multi.MultiIndex'>

>>> #重置行索引
>>> countries_reviewed.reset_index()

       country   province   len
0    Argentina  Mendoz...  3264
1    Argentina      Other   536
..         ...        ...   ...
423    Uruguay   San Jose     3
424    Uruguay    Uruguay    24

[425 rows x 3 columns]
排序
>>> #分类结果按种类数目(值)排序
>>> countries_reviewed = countries_reviewed.reset_index()
>>> countries_reviewed.sort_values(by='len')  #升序(默认)
>>> countries_reviewed.sort_values(by='len', ascending=False)  #降序

    country   province    len
392      US  Califo...  36247
415      US  Washin...   8639
..      ...        ...    ...
63    Chile    Coelemu      1
149  Greece     Beotia      1

[425 rows x 3 columns]

>>> #分类结果按索引升序排序
>>> countries_reviewed.sort_index()

       country   province   len
0    Argentina  Mendoz...  3264
1    Argentina      Other   536
..         ...        ...   ...
423    Uruguay   San Jose     3
424    Uruguay    Uruguay    24

[425 rows x 3 columns]

>>> #分类结果多条件排序
>>> countries_reviewed.sort_values(by=['country', 'len'])

       country   province   len
1    Argentina      Other   536
0    Argentina  Mendoz...  3264
..         ...        ...   ...
424    Uruguay    Uruguay    24
419    Uruguay  Canelones    43

[425 rows x 3 columns]
数据类型及转换
pandas中的数据类型包括bool, datetime, uint, int, float和object等,表示数字的三种类型又有不同的精度和表示范围(如下表 源自Tutorial: Using Pandas to Analyze Big Data in Python)。object类型用于存储字符串或者混合类型。
| memory usage | float | int | uint | datetime | bool | object |
|---|---|---|---|---|---|---|
| 1 bytes | int8 (-2^7 to 2^7-1, -128 to 127) | uint8 (0 to 2^8-1, 0 to 255) | bool | |||
| 2 bytes | float16 (半精度) | int16 (-2^15 to 2^15-1, -32768 to 32767) | uint16 (0 to 2^16-1, 0 to 65535) | |||
| 4 bytes | float32 (单精度) | int32(-2^31 to 2^31-1) | uint32(0 to 2^32-1) | |||
| 8 bytes | float64 (双精度) | int64(-2^63 to 2^63-1) | uint64(0 to 2^64-1) | datetime64 | ||
| variable | object |
导入数据
可以利用numpy获取各种数据类型的表示范围
>>> np.iinfo('uint8')
iinfo(min=0, max=255, dtype=uint8)
>>> np.finfo('float16')
finfo(resolution=0.001, min=-6.55040e+04, max=6.55040e+04, dtype=float16)
>>> df=pd.DataFrame({'A':[1.0,2,128.0],\
'B':[-1,1.0,127],\
'C':[1234,2345,4567],\
'D':[1.23,2.34,3.45],\
'E':[True,False,True],\
'F':['a','b','c'],\
'G':[np.datetime64(10, 'Y'),np.datetime64('1980', 'Y'),np.datetime64(10, 'D')]})
>>> df
A B C D E F G
0 1.0 -1.0 1234 1.23 True a 1980-01-01
1 2.0 1.0 2345 2.34 False b 1980-01-01
2 128.0 127.0 4567 3.45 True c 1970-01-11
>>> df.A.dtype #查看A列数据类型
dtype('float64')
>>> df.dtypes #查看所有列数据类型
A float64
B float64
C int64
D float64
E bool
F object
G datetime64[ns]
dtype: object
>>> df.A.astype('uint8') #将A列数据转换为uint8类型,返回Series,不改变df
0 1
1 2
2 128
Name: A, dtype: uint8
>>> df.astype({'A':'uint8','B':'int8'}) #转换多列数据类型
A B C D E F G
0 1 -1 1234 1.23 True a 1980-01-01
1 2 1 2345 2.34 False b 1980-01-01
2 128 127 4567 3.45 True c 1970-01-11
>>> df
A B C D E F G
0 1.0 -1.0 1234 1.23 True a 1980-01-01
1 2.0 1.0 2345 2.34 False b 1980-01-01
2 128.0 127.0 4567 3.45 True c 1970-01-11
>>> df['A']=df.A.astype('uint8') #将A列数据转换为uint8类型,并更新df
>>> df
A B C D E F G
0 1 -1.0 1234 1.23 True a 1980-01-01
1 2 1.0 2345 2.34 False b 1980-01-01
2 128 127.0 4567 3.45 True c 1970-01-11当DataFrame数据过大,占有很大内存时,在保证精度的情况下,可通过下调数据类型来减少内存占用(参考减少pandas数据集所占内存_pandas reduce size_Jim_Sun_Jing的博客-CSDN博客),以下为一个实现此目的的函数:
def downcast_df(df,use_float16=False):
    start_mem=df.memory_usage().sum()/1024**2
    print('Memory usage before downcast: '+('%.2f M.'%start_mem if start_mem>=1 else '%.3f kb.'%(start_mem*1024)))
    for col in df.columns:
        if 'float' in str(df[col].dtype) or 'int' in str(df[col].dtype):#如果是数字列
            c_min,c_max=df[col].min(),df[col].max()
            if (np.round(df[col])==df[col]).all():#如果该列能整数化(去掉小数部分后的值与原值相同)
                if c_min>=0:#如果最小值大于0,则可以转化为无符号数
                    if c_min>=np.iinfo(np.uint8).min and c_max<=np.iinfo(np.uint8).max:
                        df[col]=df[col].astype(np.uint8)
                    elif c_min>=np.iinfo(np.uint16).min and c_max<=np.iinfo(np.uint16).max:
                        df[col]=df[col].astype(np.uint16)
                    elif c_min>=np.iinfo(np.uint32).min and c_max<=np.iinfo(np.uint32).max:
                        df[col]=df[col].astype(np.uint32)
                    elif c_min>=np.iinfo(np.uint64).min and c_max<=np.iinfo(np.uint64).max:
                        df[col]=df[col].astype(np.uint64)
                else:
                    if c_min>=np.iinfo(np.int8).min and c_max<=np.iinfo(np.int8).max:
                        df[col]=df[col].astype(np.int8)
                    elif c_min>=np.iinfo(np.int16).min and c_max<=np.iinfo(np.int16).max:
                        df[col]=df[col].astype(np.int16)
                    elif c_min>=np.iinfo(np.int32).min and c_max<=np.iinfo(np.int32).max:
                        df[col]=df[col].astype(np.int32)
                    elif c_min>=np.iinfo(np.int64).min and c_max<=np.iinfo(np.int64).max:
                        df[col]=df[col].astype(np.int64)
            else:
                if use_float16 and c_min>=np.finfo(np.float16).min and c_max<=np.finfo(np.float16).max:
                    df[col]=df[col].astype(np.float16)
                elif c_min>=np.finfo(np.float32).min and c_max<=np.finfo(np.float32).max:
                    df[col]=df[col].astype(np.float32)
                elif c_min>=np.finfo(np.float64).min and c_max<=np.finfo(np.float64).max:
                    df[col]=df[col].astype(np.float64)
    end_mem=df.memory_usage().sum()/1024**2
    print('Memory usage after downcast: '+('%.2f M.'%end_mem if end_mem>=1 else '%.3f kb.'%(end_mem*1024)))
应用:
>>> df=pd.DataFrame({'A':[1.0,2,128.0],\
                 'B':[-1,1.0,127],\
                 'C':[1234,2345,4567],\
                 'D':[1.23,2.34,3.45],\
                 'E':[True,False,True],\
                 'F':['a','b','c'],\
                 'G':[np.datetime64(10, 'Y'),np.datetime64('1980', 'Y'),np.datetime64(10, 'D')]})
>>> df.info()
<class 'pandas.core.frame.DataFrame'>
RangeIndex: 3 entries, 0 to 2
Data columns (total 7 columns):
 #   Column  Non-Null Count  Dtype
---  ------  --------------  -----
 0   A       3 non-null      float64
 1   B       3 non-null      float64
 2   C       3 non-null      int64
 3   D       3 non-null      float64
 4   E       3 non-null      bool
 5   F       3 non-null      object
 6   G       3 non-null      datetime64[ns]
dtypes: bool(1), datetime64[ns](1), float64(3), int64(1), object(1)
memory usage: 275.0+ bytes
>>> downcast_df(df)
Memory usage before downcast: 0.269 kb.
Memory usage after downcast: 0.198 kb.
>>> df.info()
<class 'pandas.core.frame.DataFrame'>
RangeIndex: 3 entries, 0 to 2
Data columns (total 7 columns):
 #   Column  Non-Null Count  Dtype
---  ------  --------------  -----
 0   A       3 non-null      uint8
 1   B       3 non-null      int8
 2   C       3 non-null      uint16
 3   D       3 non-null      float32
 4   E       3 non-null      bool
 5   F       3 non-null      object
 6   G       3 non-null      datetime64[ns]
dtypes: bool(1), datetime64[ns](1), float32(1), int8(1), object(1), uint16(1), uint8(1)
memory usage: 203.0+ bytes
缺失值处理
缺失值标记为NaN(Not a Number),总为float64类型。
缺失值不是空值,空值为"",isna()/isnull()函数不检测空值。
可以通过设置 pandas.options.mode.use_inf_as_na = True 将np.inf视为缺失值。
缺失值判断
DataFrame.isna()函数效果同DataFrame.isnull()函数,此外还可用顶层函数pd.isna(df)/pd.isnull(df)来判断缺失值:
>>> import pandas as pd
>>> import numpy as np
>>> df=pd.DataFrame({'A':[1,np.nan,None,4],'B':[None,3,2,np.nan],'C':['a','','c','d']})
>>> df
     A    B  C
0  1.0  NaN  a
1  NaN  3.0
2  NaN  2.0  c
3  4.0  NaN  d
>>> df.isna() #等价于df.isnull()/pd.isna(df)/pd.isnull(df)
       A      B      C
0  False   True  False
1   True  False  False
2   True  False  False
3  False   True  False
>>> df.isna().sum() #返回一个Series,计算每列有多少个缺失值
A    2
B    2
C    0
dtype: int64
>>> df.isna().sum().sum() #计算整个DataFrame有多少个缺失值
4
>>> df[df.B.isna()] #筛选出某列为缺失值的行
     A   B  C
0  1.0 NaN  a
3  4.0 NaN  d
>>> s=df.isna().sum()  #以下找出含有缺失值的列
>>> s[s>0].index
Index(['A', 'B'], dtype='object')
>>> df[s[s>0].index]
     A    B
0  1.0  NaN
1  NaN  3.0
2  NaN  2.0
3  4.0  NaN
缺失值填充
用非空值的平均值替换缺失值:
>>> df=pd.DataFrame([[1,2,3],[4,np.NaN,5],[6,7,np.NaN],[np.nan,np.nan,np.nan]],columns=['A','B','C'])
>>> df
     A    B    C
0  1.0  2.0  3.0
1  4.0  NaN  5.0
2  6.0  7.0  NaN
3  NaN  NaN  NaN
#方法1:fillna()
>>> df.fillna(df.mean())
          A    B    C
0  1.000000  2.0  3.0
1  4.000000  4.5  5.0
2  6.000000  7.0  4.0
3  3.666667  4.5  4.0
#方法2:replace()
>>> df.notnull().sum()
A    3
B    2
C    2
dtype: int64
>>> df.sum()/df.notnull().sum()
A    3.666667
B    4.500000
C    4.000000
dtype: float64
>>> df.replace(np.NaN,df.sum()/df.notnull().sum(),inplace=True)
>>> df
          A    B    C
0  1.000000  2.0  3.0
1  4.000000  4.5  5.0
2  6.000000  7.0  4.0
3  3.666667  4.5  4.0
向前/后填充:
>>> df=pd.DataFrame([[1,2,np.NaN],[4,np.NaN,5],[6,7,np.NaN],[np.nan,np.nan,np.nan]],columns=['A','B','C'])
>>> df
     A    B    C
0  1.0  2.0  NaN
1  4.0  NaN  5.0
2  6.0  7.0  NaN
3  NaN  NaN  NaN
>>> df.ffill()#向前填充
     A    B    C
0  1.0  2.0  NaN
1  4.0  2.0  5.0
2  6.0  7.0  5.0
3  6.0  7.0  5.0
>>> df.bfill()#向后填充
     A    B    C
0  1.0  2.0  5.0
1  4.0  7.0  5.0
2  6.0  7.0  NaN
3  NaN  NaN  NaN
重命名、更改列顺序、添加新行列
导入数据
>>> #导入数据并设置最大显示行数为5
>>> import pandas as pd
>>> reviews = pd.read_csv("winemag-data-130k-v2.csv", index_col=0)
>>> pd.set_option('max_rows', 5)
>>> reviews
         country description designation  points  price   province region_1 region_2 taster_name taster_twitter_handle      title    variety     winery
0          Italy  Aromas...   Vulkà ...       87    NaN  Sicily...     Etna      NaN  Kerin ...   @kerin...             Nicosi...  White ...    Nicosia
1       Portugal  This i...    Avidagos       87   15.0      Douro      NaN      NaN  Roger ...   @vossr...             Quinta...  Portug...  Quinta...
...          ...        ...         ...      ...    ...        ...      ...      ...        ...         ...                   ...        ...        ...
129969    France  A dry ...         NaN       90   32.0     Alsace   Alsace      NaN  Roger ...   @vossr...             Domain...  Pinot ...  Domain...
129970    France  Big, r...   Lieu-d...       90   21.0     Alsace   Alsace      NaN  Roger ...   @vossr...             Domain...  Gewürz...  Domain...

[129971 rows x 13 columns]
重命名列名与行名
>>> #重命名列名
>>> df = pd.DataFrame({"A": [1, 2, 3], "B": [4, 5, 6]})
>>> #方法1:采用字典格式设置列名
>>> df.rename(columns={"A": "a", "B": "c"},inplace=True)
>>>#或
>>>df.rename(columns=dict(A='a',B='b'),inplace=True)
>>> #方法2:设置columns,按原来的顺序全部列出
>>> df.columns=['a','c']
>>> df
   a  c
0  1  4
1  2  5
2  3  6

>>> #重命名行索引
>>> df.rename(index={0: "x", 1: "y", 2: "z"},inplace=True)
>>> df.rename({0: "x", 1: "y", 2: "z"}, axis='index',inplace=True)
>>> df
   a  c
x  1  4
y  2  5
z  3  6

#命名索引列名称
>>> df = pd.DataFrame({"A": [1, 2, 3], "B": [4, 5, 6]})
>>> df.rename_axis('number',axis='rows')
        A  B
number
0       1  4
1       2  5
2       3  6
更改列顺序
>>> #方法1:设置列名顺序列表并应用
>>> df = pd.DataFrame({"A": [1, 2, 3], "B": [4, 5, 6]})
>>> newColumnOrderList=['B','A']
>>> df=df[newColumnOrderList]

>>> #方法2:取出列,删除原来的列,在新的位置插入取出的列
>>> df = pd.DataFrame({"A": [1, 2, 3], "B": [4, 5, 6]})
>>> df_B=df.B
>>> df.drop('B',axis=1,inplace=True)
>>> df.insert(0,'new_B',df_B)  #插入新列时还可以对新列重命名
>>> df
   new_B  A
0      4  1
1      5  2
2      6  3
添加新列
>>> reviews['critic'] = 'everyone'  #新建critic列并赋值everyone,操作类似字典
>>> reviews['critic']
0         everyone
1         everyone
            ...
129969    everyone
129970    everyone
Name: critic, Length: 129971, dtype: object
#迭代赋值
>>> reviews['index_backwards'] = range(len(reviews), 0, -1)  #迭代赋值
>>> reviews['index_backwards'] = list(range(len(reviews), 0, -1))
>>> reviews['index_backwards']
0         129971
1         129970
           ...
129969         2
129970         1
Name: index_backwards, Length: 129971, dtype: int64
数据框合并
相同列名的数据框纵向拼接
>>> #相同列名的数据框纵向拼接
>>> df1 = pd.DataFrame([[1, 2], [3, 4]], columns=list('AB'))
>>> df2 = pd.DataFrame([[5, 6], [7, 8]], columns=list('BA'))

>>> #方法1:append()方法
>>> #拼接两个DataFrame
>>> df1.append(df2,ignore_index=True)  #生成新的DataFrame,不改变原有的DataFrame。ignore_index设为True用于重置行索引
   A  B
0  1  2
1  3  4
2  6  5
3  8  7
>>> #拼接多个Series
>>> s1 = pd.Series(['a', 'b'])
>>> s2 = pd.Series(['c', 'd'])
>>> pd.concat([s1,s2],ignore_index=True)  #
0    a
1    b
2    c
3    d
dtype: object

>>> #方法2:caoncat()方法,可以拼接多个列名相同的DataFrame
>>> df1 = pd.DataFrame([['a', 1], ['b', 2]],columns=['letter', 'number'])
>>> df2 = pd.DataFrame([['c', 3], ['d', 4]],columns=['letter', 'number'])
>>> pd.concat([df1, df2])
  letter  number
0      a       1
1      b       2
0      c       3
1      d       4
横向拼接或融合数据框
>>> df1 = pd.DataFrame([['a', 1], ['b', 2]],columns=['letter', 'number'])
>>> df4 = pd.DataFrame([['bird', 'polly'], ['monkey', 'george']],columns=['animal', 'name'])

>>> #方法1:pd.concat()方法
>>> pd.concat([df1,df4],axis=1)
  letter  number  animal    name
0      a       1    bird   polly
1      b       2  monkey  george

>>> #方法2:join()方法

>>> df = pd.DataFrame({'key': ['K0', 'K1', 'K2', 'K3', 'K4', 'K5'],'A': ['A0', 'A1', 'A2', 'A3', 'A4', 'A5']})
>>> df2 = pd.DataFrame({'key': ['K0', 'K1', 'K2'],'B': ['B0', 'B1', 'B2']})

>>> #横向合并两个数据框,保留所有列名
>>> df1.join(df2, lsuffix='_df1', rsuffix='_df2')
  key_df1   A key_df2    B
0      K0  A0      K0   B0
1      K1  A1      K1   B1
2      K2  A2      K2   B2
3      K3  A3     NaN  NaN
4      K4  A4     NaN  NaN
5      K5  A5     NaN  NaN
>>> #如果要用key列融合两个数据框,需将key列设为两个数据框的索引
>>> df1.set_index('key').join(df2.set_index('key'))
      A    B
key
K0   A0   B0
K1   A1   B1
K2   A2   B2
K3   A3  NaN
K4   A4  NaN
K5   A5  NaN
>>> #还可采用设置on参数的方法融合两个数据框
>>> df1.join(df2.set_index('key'), on='key')
  key   A    B
0  K0  A0   B0
1  K1  A1   B1
2  K2  A2   B2
3  K3  A3  NaN
4  K4  A4  NaN
5  K5  A5  NaN
此外,合并方法还有df.merge()等。
将两个行索引不同的单行DataFrame忽略行索引横向拼接成一行,需要先设置行索引相同:
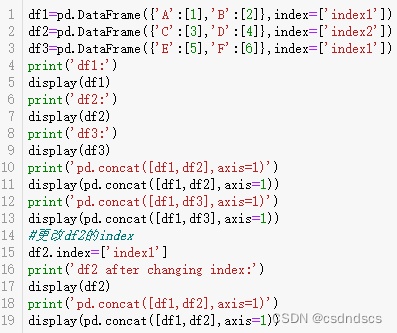
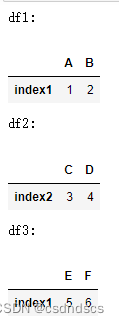
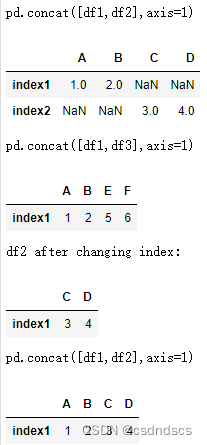
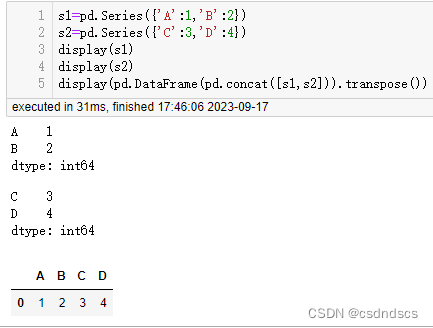
也可先转化为Series,拼接后再转化为DataFrame:
生成数据分析报告
import pandas_profiling as pp

report = pp.ProfileReport(df)
report
Tips:
数据框按行迭代:
df=pd.DataFrame({'A':[1,2,3],'B':[4,5,6],'C':[7,8,9]})
for index,row_Series in df.iterrows():#返回df行的index与Series
    print(index)
    print(row_Series)
ref:


 4861
4861


 被折叠的 条评论
为什么被折叠?
被折叠的 条评论
为什么被折叠?
 到【灌水乐园】发言


