


loggly
This article was sponsored by Loggly. Thank you for supporting the sponsors who make SitePoint possible.
本文由Loggly赞助。 感谢您支持使SitePoint成为可能的赞助商。
When running an application or website, you’d be wise to not only keep track of your visitor statistics, but your performance as well. While we’re used to setting up downtime monitoring right after deployment, this isn’t always the case with performance monitoring. A slow site means a slow income, especially nowadays when visitors expect sites to load in just a couple of seconds.
在运行应用程序或网站时,明智的做法是不仅要跟踪访问者的统计信息,还要跟踪性能。 尽管我们习惯于在部署后立即设置停机时间监控,但是性能监控并非总是如此。 网站访问速度慢意味着收入缓慢,尤其是在如今的访客希望网站在几秒钟内加载的情况下。
With excellent tools like New Relic around, application performance monitoring and management shouldn’t be such a hassle anymore. Better yet, they recently teamed up with Loggly, a service that provides log management and analysis for an even better insight into your application or site’s performance. Now you can easily dive further from what happened into how it happened.
有了New Relic等出色的工具,应用程序性能监视和管理就不再那么麻烦了。 更好的是,他们最近与 Loggly 合作 ,该服务提供日志管理和分析,以更好地了解您的应用程序或站点的性能。 现在,您可以轻松地从发生的事情进一步深入到发生的事情。
In this article I will show you how both New Relic and Loggly work as a combined tool. Once you get the basics I will show you how these two powerful tools combine into a developers dream for analyzing bad performance or downtime.
在本文中,我将向您展示New Relic和Loggly如何结合使用。 一旦掌握了基础知识,我将向您展示这两个功能强大的工具如何组合成开发人员梦analyzing以求的不良性能或停机时间。
为什么要使用应用程序性能管理(APM) (Why you should use Application Performance Management (APM))
You may have heard of New Relic before as they have had various great partnerships with SitePoint. They were also covered in detail by Darren Jones in his excellent article on real time Ruby monitoring.
您可能已经听说过New Relic ,因为他们与SitePoint建立了各种良好的合作关系。 Darren Jones在其有关实时Ruby监视的出色文章中还详细介绍了它们。
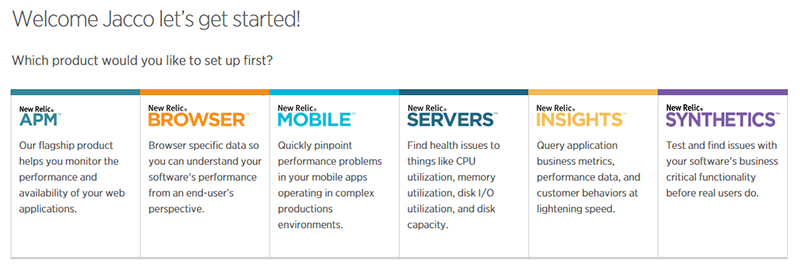
New Relic offers several solutions for application performance management (APM). Whether you want to monitor your web application, mobile app or server, New Relic has the right tools for the job. They also have a free version of all of their products. For this article I will focus on New Relic APM, and let you have a look into its impressive dashboard.
New Relic为应用程序性能管理(APM)提供了几种解决方案。 无论您是要监视Web应用程序,移动应用程序还是服务器,New Relic都有适合此工作的工具。 他们还提供所有产品的免费版本。 在本文中,我将重点介绍New Relic APM ,并让您了解其令人印象深刻的仪表板。
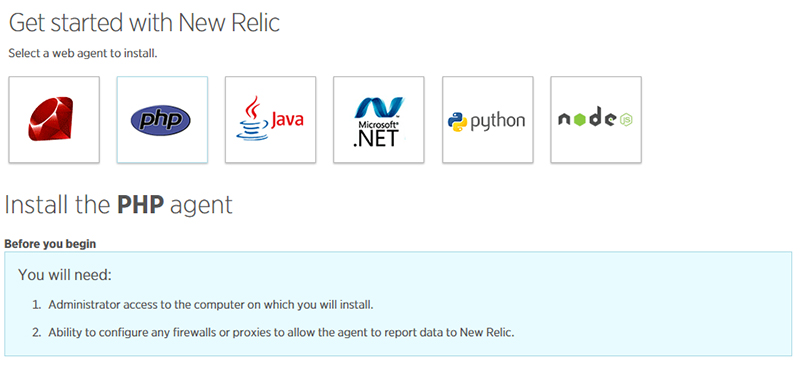
For New Relic to work properly, you’ll need to have admin access to the server your app is running on. Once installed, your dashboard will come alive. After running a small load test you’ll get to see your app (a Magento webshop in my case) in action.
为了使New Relic正常运行,您需要对运行您的应用程序的服务器具有管理员权限。 安装完成后,您的仪表板将启用。 在运行了一个小的负载测试之后,您将看到您的应用程序(在我的情况下是一个Magento网上商店 )。

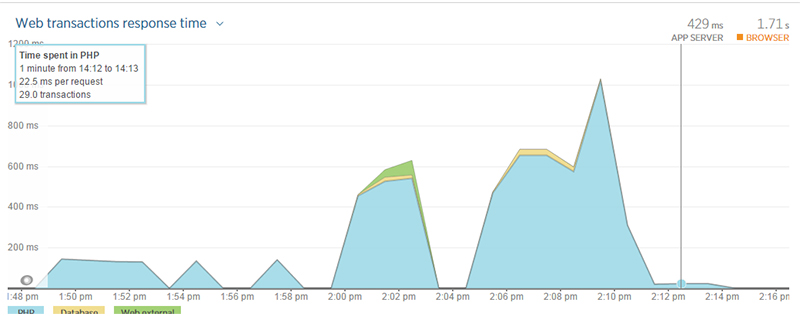
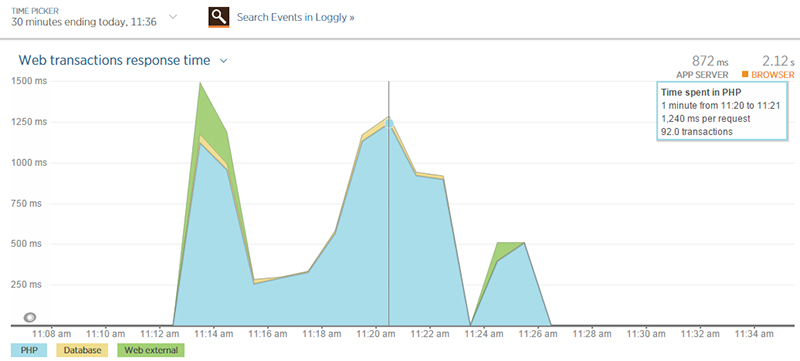
The dashboard shows you the average loading times for your PHP application, the database and external sources (DNS for example). You can also see your throughput (75 requests per minute in this screenshot) and APDEX score (which is basically a satisfaction rate based on an average loading time of 0.5 seconds as default). You can then further zoom in on all of these parameters, like the external sources loading time or database calls.
仪表板显示您PHP应用程序,数据库和外部源(例如DNS)的平均加载时间。 您还可以查看您的吞吐量(此屏幕截图中每分钟75个请求)和APDEX得分(这基本上是根据默认的0.5秒平均加载时间得出的满意率)。 然后,您可以进一步放大所有这些参数,例如外部源的加载时间或数据库调用。

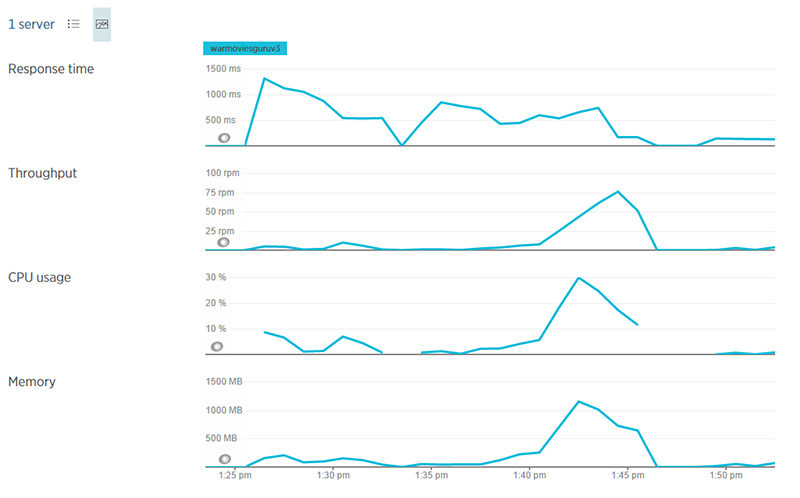
There is also limited server information with CPU and memory usage, along with throughput and response time. For more extended server monitoring you should use New Relic Servers, but even in limited mode this is still valuable information.
服务器信息中,CPU和内存使用情况以及吞吐量和响应时间也很有限。 要进行更多扩展的服务器监视,您应该使用New Relic Servers ,但是即使在受限模式下,这仍然是有价值的信息。
Since New Relic gives you real time reporting, you can instantly see the effect of changes you make. When running a second load test I turned on Magento cache during the test, causing an instant drop in PHP load times as well as fewer database queries. New Relic gives you a nice view of the results right away.
由于New Relic可以为您提供实时报告,因此您可以立即看到所做更改的效果。 在运行第二个负载测试时,我在测试过程中打开了Magento缓存,这导致PHP负载时间立即减少,数据库查询减少了。 New Relic可让您立即查看结果。
Along with real time reporting there are tons of additional reports for you to run. You can also set up alerts for specific events like downtime or slowdowns.
除了实时报告,还有大量其他报告供您运行。 您还可以针对特定事件(如停机或减速)设置警报。
All in all, New Relic is a great tool for performance testing, but in some cases you’ll want to dive in deeper and look at your logs for detailed analysis. This is where Loggly comes in. It has an integration for New Relic which makes it very convenient to jump from an event from New Relic into logs hosted by Loggly. Let’s have a look.
总而言之,New Relic是性能测试的绝佳工具,但在某些情况下,您可能需要更深入地研究并查看日志以进行详细分析。 这就是Loggly的用处。它具有New Relic的集成,这使从New Relic的事件跳转到Loggly托管的日志非常方便。 我们来看一下。
为什么要重视您的日志 (Why you should value your logs)
Loggly is all about log management and analysis, and they provide you with some nifty tools to do this. Setting up is simple, with a couple of commands in the command line. After that, you’re in log heaven. Loggly gives you insight into every detail of your application.
Loggly就是关于日志管理和分析的,它们为您提供了一些漂亮的工具来执行此操作。 设置很简单,在命令行中有几个命令。 之后,您将进入日志天堂。 Loggly使您可以深入了解应用程序的每个细节。
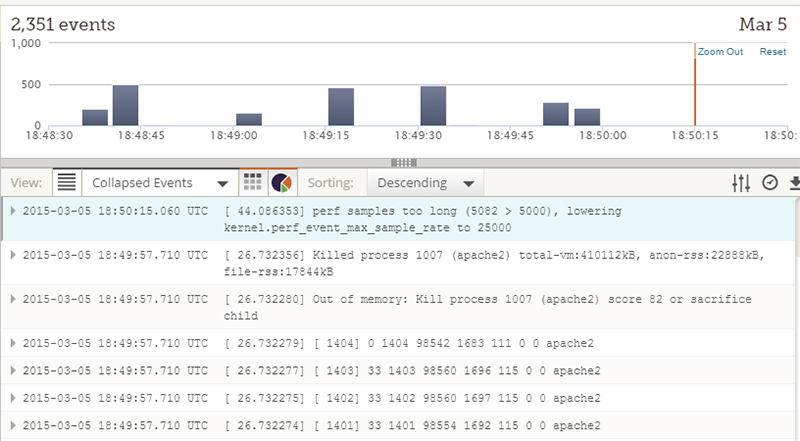
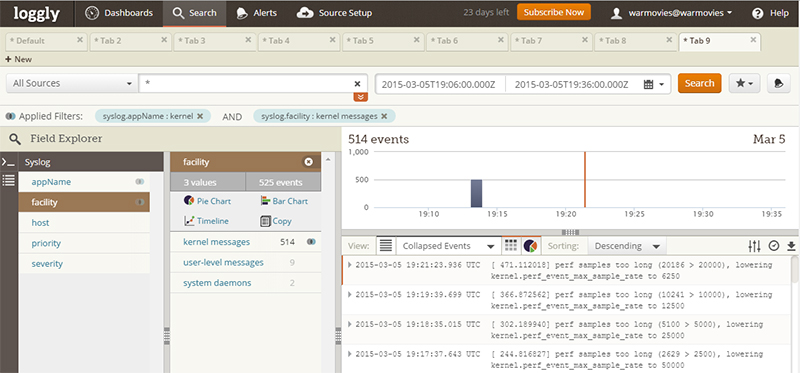
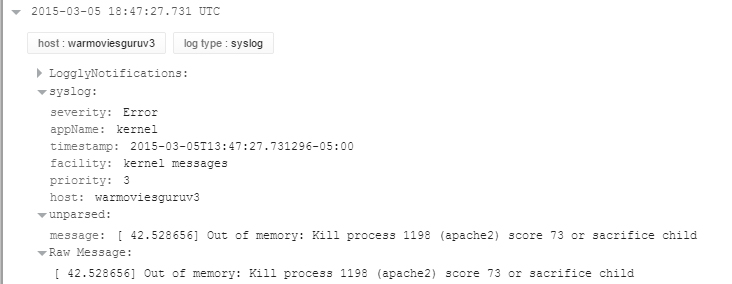
Where New Relic tells you what’s happening on the front-end, Loggly gives you an insight into what’s happening throughout your stack. In my screenshot you can see Loggly is reporting that my instance ran out of memory. New Relic, however, was only showing “lower” or “no” performance, because they don’t measure your server’s memory limit. Without Loggly, I simply wouldn’t have known what happened in this case.
在New Relic告诉您前端发生了什么的情况下,Loggly使您可以洞悉整个堆栈中发生的情况。 在我的屏幕截图中,您可以看到Loggly正在报告我的实例内存不足。 但是,New Relic仅显示“较低”或“无”性能,因为它们无法衡量服务器的内存限制。 没有Loggly,我根本不会知道在这种情况下发生了什么。
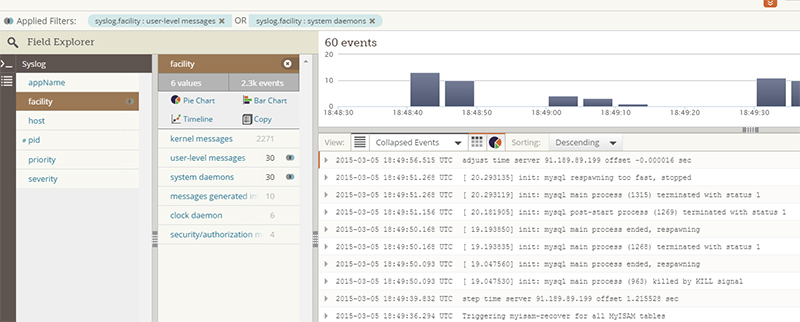
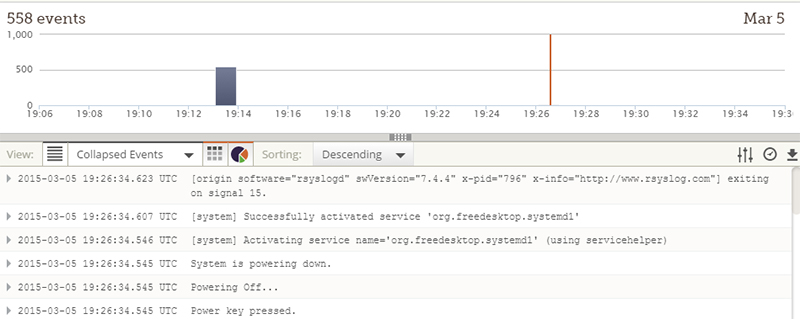
In the screenshot above, you’ll see the logs of multiple restarts in a short time. As you can see Loggly gives you extremely detailed information on the buildup of downtime on various levels. Loggly has a granular approach, as each event is stored separately where New Relic aggregates them.
在上面的屏幕截图中,您将在短时间内看到多次重启的日志。 如您所见,Loggly为您提供了有关各个级别的停机时间累积的极其详细的信息。 Loggly具有精细的方法,因为每个事件分别存储在New Relic聚合它们的地方。
An error or performance issue can have several underlying causes, but New Relic only shows you the end result and its impact. With Loggly you can trace each event back to its origins and see what happened in the moments before it occurred. It also allows you to pinpoint a specific user’s issue for example. Also when browsing through the logs I noticed someone tried to log in as root, an attempt which was blocked. This is all valuable information which New Relic can’t provide and Loggly does perfectly.
错误或性能问题可能有几个根本原因,但“ New Relic”仅向您显示最终结果及其影响。 使用Loggly,您可以追溯每个事件的起源,并查看事件发生之前的瞬间。 例如,它还允许您查明特定用户的问题。 另外,在浏览日志时,我注意到有人尝试以root用户身份登录,但此尝试被阻止。 这是New Relic无法提供的所有有价值的信息,而Loggly可以做到完美。
Loggly gives you multiple ways of building your own custom dashboards to monitor your apps or even sections of your app or site. You can integrate it with other tools like PagerDuty or HipChat for advanced notification. You can also set up various alerts within Loggly itself and it has an universal search bar to quickly get the relevant logs based on your search terms.
Loggly为您提供了多种方法来构建自己的自定义仪表板,以监视您的应用程序甚至应用程序或网站的各个部分。 您可以将其与PagerDuty或HipChat等其他工具集成以进行高级通知。 您还可以在Loggly本身中设置各种警报,并且它具有通用的搜索栏,可根据您的搜索条件快速获取相关日志。
Browsing through tons of logs can be a tedious task, especially when you can’t really pin down what each entry meant on the front-end. To help you in your analysis, New Relic and Loggly teamed up to provide you an excellent integration. Using a Chrome extension, you can simply click on an event reported by New Relic and find the matching logs in Loggly. Let’s see how that works.
浏览成吨的日志可能是一项繁琐的任务,尤其是当您无法真正确定前端每个条目的含义时。 为了帮助您进行分析,New Relic和Loggly联手为您提供了出色的集成。 使用Chrome扩展程序,您只需单击New Relic报告的事件,然后在Loggly中找到匹配的日志。 让我们看看它是如何工作的。
兼顾两全其美:将APM与日志管理相结合以进行详细的故障分析 (Getting the best of both worlds: Combining APM with log management for a detailed breakdown analysis)
New Relic and Loggly on their own provide excellent ways of tackling problems in performance. But when doing an analysis you can’t easily put them back-to-back without constant switching. Especially with more popular apps or sites we’re talking in milliseconds, with tens or even hundreds of events and transactions happening each second.
New Relic和Loggly本身提供了解决性能问题的出色方法。 但是在进行分析时,如果不进行不间断的切换,就无法轻松地将它们背对背放置。 尤其是对于更流行的应用或网站,我们正在谈论的时间是毫秒,每秒发生数十甚至数百个事件和交易。
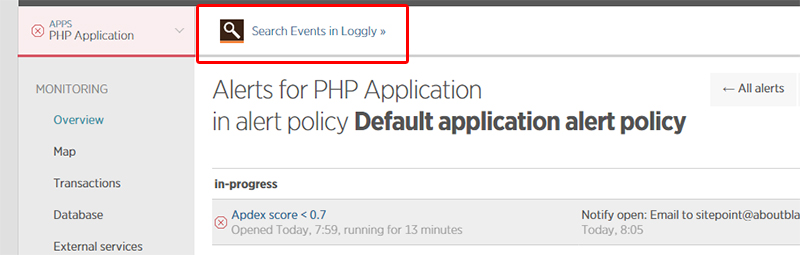
For a solution, install the “New Relic – Loggly Extension“. After you’ve done that, you’ll get an “Search Events in Loggly” button on each error and event screen in New Relic.
对于解决方案,请安装“ New Relic – Loggly Extension ”。 完成此操作后,您将在New Relic的每个错误和事件屏幕上获得一个“在Loggly中搜索事件”按钮。
Every time you are looking at an event, error or transaction and you hit that button, the exact date and time parameters are passed on to Loggly. This way you’ll get a perfect match in Loggly without further adjustment of time. Loggly then allows you to scroll through its full log so you can see everything that happened before the actual event occurred.
每次查看事件,错误或事务并单击该按钮时,确切的日期和时间参数都会传递到Loggly。 这样,您将在Loggly中获得完美的匹配,而无需进一步调整时间。 然后,Loggly允许您滚动浏览其完整日志,以便可以查看实际事件发生之前发生的所有事情。
Let’s have a look at a few load tests I did on my demo site. I loaded up the homepage with a number of products and turned the caching off, which leads to a lot of database calls for each visit. I then fired up a load tester (Load Impact) with 50 concurrent users and within a minute the site went down. After the first test I turned the cache back on and ran the same test but this time with 100 concurrent users. Again within a minute the site went down.
让我们看一下我在演示站点上进行的一些负载测试。 我在主页上加载了许多产品,并关闭了缓存,这导致每次访问都需要进行许多数据库调用。 然后,我启动了一个具有50个并发用户的负载测试器( Load Impact ),并在一分钟之内该站点瘫痪了。 在第一个测试之后,我重新打开了缓存并运行了相同的测试,但是这次有100个并发用户。 一分钟后,该站点再次出现故障。
After a few minutes New Relic caught up so I could analyse what caused the actual downtime. I expected the database to break right away, but with cache turned on this shouldn’t be the case. Both times there were tens of PHP transactions (100 max at the second test), but in both cases the database was used even when caching was on (this could be due to widgets not being cached, for example).
几分钟后,New Relic赶上来了,所以我可以分析造成实际停机的原因。 我预计数据库会立即崩溃,但事实并非如此。 两次都有数十个PHP事务(第二次测试中最大为100个),但是在这两种情况下,即使打开了缓存,数据库也都被使用了(例如,这可能是由于未缓存小部件)。
Hitting the “Search Events in Loggly” button gave me the exact same timeframe so I could start digging. After comparing several events, it turned out that both Apache and MySQL ran out of memory. Apache was mostly responsible with cache turned on, but even then MySQL could be the one to give the final blow.
击中“ Loggly中的搜索事件”按钮给了我完全相同的时间范围,因此我可以开始挖掘。 在比较了几个事件之后,事实证明Apache和MySQL都用光了内存。 Apache主要负责打开缓存,但是即使那样,MySQL仍可能是最后一击。
So the simple solution would be to upgrade the instance the web store was running on. It went from 512MB with a 1 core processor to 8GB with a 4 core processor.
因此,简单的解决方案是升级运行Web商店的实例。 它从1核处理器的512MB变为4核处理器的8GB。
After the upgrade I ran an additional test, with cache turned on and 50 concurrent users. Again database calls were still done, but the performance was pretty consistent (although a bit slow) and there was no downtime.
升级后,我进行了一项附加测试,打开了缓存并启用了50个并发用户。 再次进行了数据库调用,但是性能相当稳定(尽管有点慢),并且没有停机时间。
Loggly was pretty happy too, with the only event being the instance re-sizing. Even though this is a pretty basic example, it does show how easy it is to analyze events in Loggly based on specific moments you see in New Relic. The Chrome extension makes switching a breeze.
Loggly也非常高兴,唯一的事件是实例大小调整。 即使这是一个非常基本的示例,也确实显示了根据您在New Relic中看到的特定时刻来分析Loggly中的事件有多么容易。 Chrome扩展程序使切换变得轻而易举。
That’s really all there is. But even though this sounds simple, it will save you a tremendous amount of time when you want to analyze multiple events. You can get the Chrome extension without additional cost, and setting up takes less than a minute (just enter your Loggly account name).
真的就是全部。 但这听起来很简单,但是当您要分析多个事件时,它将为您节省大量时间。 您可以免费获得Chrome扩展程序,而且设置过程不到一分钟(只需输入您的Loggly帐户名)。
Get inspired: How you could benefit from APM with log management New Relic and Loggly are a powerful combination, with both having enough features and tools to quickly analyze a problem and determine its cause. But my demo is just one example. While this is a common issue, finding a quick fix isn’t rocket science. But upgrading your instance is a short term solution as it will keep occurring when your web store becomes more popular.
激发灵感:借助日志管理,您如何从APM中受益New Relic和Loggly是强大的组合,两者都具有足够的功能和工具来快速分析问题并确定问题原因。 但是我的演示只是一个例子。 尽管这是一个常见问题,但找到快速解决方案并不是火箭科学。 但是,升级实例是一种短期解决方案,因为当您的网络商店变得越来越流行时,升级实例将不断发生。
What if you would want to have a closer look at why there are still database calls even with caching turned on? Or how about a slow performing checkout process, where caching wouldn’t help due the dynamic nature of the actual process?
如果您想进一步了解为什么即使启用了缓存,仍然还有数据库调用呢? 还是执行速度缓慢的结帐流程,由于实际流程的动态性质,在这种情况下缓存无济于事?
结论 (Conclusion)
Both New Relic and Loggly are effective tools to first identify a given problem, then isolate a specific occurrence after which you can reverse engineer the problem and find a solution. Everything is done in (almost) real time and in more detail than you will probably need (but it never hurts to have them).
New Relic和Loggly都是有效的工具,可以首先识别给定的问题,然后隔离特定的问题,然后您可以对问题进行反向工程并找到解决方案。 一切都是(几乎)实时完成的,比您可能需要的细节更多(但是拥有它们永远不会有伤害)。
Loggly has built a great interface for wading through your logs and finding what matters from among their millions of entries. But let’s not forget: they don’t just offer an analysis tool, they also store your logs as well. With a popular app or site your log growth will quickly become insane, sometimes turning into a performance problem on its own. Loggly does all the storing and backing up, so you won’t risk losing your valuable logs after a server has gone completely crazy.
Loggly建立了一个出色的界面,可以浏览您的日志并从其数百万个条目中查找重要内容。 但是请不要忘记:他们不仅提供分析工具,还存储您的日志。 使用流行的应用程序或网站,您的日志增长将Swift变得疯狂,有时会独自变成性能问题。 Loggly会进行所有存储和备份,因此在服务器完全发疯之后,您就不会冒险丢失宝贵的日志。
Both New Relic and Loggly have free trials, for 14 days and 30 days respectively. They also offer Lite plans with New Relic having a 24-hour data retention and Loggly 7 days. This is sufficient for real time monitoring with the option for analysis afterwards.
New Relic和Loggly都有免费试用,分别为14天和30天。 他们还提供带有New Relic的Lite计划,该计划具有24小时的数据保留和Loggly 7天的数据保留时间。 这对于实时监视就足够了,以后可以选择进行分析。
Can you think of some clever uses of New Relic and Loggly? Let us know in the comments.
您能想到New Relic和Loggly的一些巧妙用法吗? 让我们在评论中知道。
翻译自: https://www.sitepoint.com/integrate-apm-log-management-loggly-new-relic/
loggly


 627
627

 被折叠的 条评论
为什么被折叠?
被折叠的 条评论
为什么被折叠?
 到【灌水乐园】发言


