


 本文详细介绍了Chrome开发者工具的控制台和性能相关工具,包括片段工具、控制台历史、变量、日志记录、性能分析等功能。通过使用控制台的高级特性,如console.time()、console.count()等,可以更好地调试和优化JavaScript代码。此外,文章还探讨了性能选项卡中的CPU配置文件、内存分析以及审计工具,帮助开发者提升Web应用的性能和用户体验。
chrome 控制台
Chrome DevTools incorporates many sub-tools for debugging web applications on the client side — like recording performance profiles and inspecting animations — most of which you’ve likely been using since your early days of learning web development, mostly through the DevTools console.
Chrome DevTools集成了许多子工具,用于在客户端调试Web应用程序-例如记录性能配置文件和检查动画-自从学习Web开发初期以来,您可能就一直在使用其中的大部分工具,大部分都是通过DevTools控制台进行的。
Let’s look at some of those tools, focusing particularly on the console and the performance metrics.
让我们看一下其中的一些工具,重点关注控制台和性能指标。
To access Chrome’s DevTools:
要访问Chrome的DevTools,请执行以下操作:
right click anywhere on a page, click Inspect from the context menu
右键单击页面上的任意位置,然后从上下文菜单中单击“ 检查 ”
use the keyboard shortcuts
Ctrl + Shift + Ion Windows and Linux systems orAlt + Command + Ion macOS在Windows和Linux系统上使用键盘快捷键
Ctrl + Shift + I,在macOS上使用Alt + Command + Iuse the keyboard shortcuts
Ctrl + Shift + Jon Windows and Linux systems orAlt + Command + Jon macOS.在Windows和Linux系统上使用键盘快捷键
Ctrl + Shift + J,在macOS上使用Alt + Command + J。
片段工具 (The Snippets Tool)
If you’re frequently writing JavaScript code right in the console, make sure to use the Snippets feature of DevTools instead, which is similar to a code editor and provides mechanisms to write JavaScript code snippets, run them in the context of the current page and save them for later. It’s better than writing multi-line JavaScript code directly in the console.
如果您经常在控制台中直接编写JavaScript代码,请确保改为使用DevTools的代码段功能,该功能类似于代码编辑器,并提供了编写JavaScript代码段的机制,可在当前页面的上下文中运行它们,并保存以备后用。 比直接在控制台中编写多行JavaScript代码要好。
You can access the Snippets tool from the Sources panel. Once open, the console gets stacked below (if it doesn’t, just press Escape) so you can write, run your code and see the console output at the same time.
您可以从“源”面板访问“片段”工具。 打开后,控制台将堆积在下面(如果没有,只需按Escape键),以便您可以编写,运行代码并同时查看控制台输出。
使用Chrome DevTools控制台 (Using the Chrome DevTools Console)
You can use the console to interact with any web page using JavaScript. You can query and change the DOM and query/output different types of performance information.
您可以使用控制台使用JavaScript与任何网页进行交互。 您可以查询和更改DOM,以及查询/输出不同类型的性能信息。
The console can be opened either as a full-screen dedicated panel or as a drawer next to any other DevTools panel by pressing Escape while DevTools is open and has focus.
在DevTools打开并具有焦点的情况下,按Escape即可将控制台作为全屏专用面板打开,也可以将其作为其他任何DevTools面板旁边的抽屉打开。
When working with the browser’s console, if you want to enter multi-line expressions you need to use Shift + Enter, because just Enter will execute what’s in the input line at that moment.
在浏览器的控制台上工作时,如果要输入多行表达式,则需要使用Shift + Enter ,因为只有Enter会执行此时输入行中的内容。
控制台历史 (The console history)
You can clear the console history in different ways:
您可以通过多种方式清除控制台历史记录:
by typing
clear()in the console通过在控制台中键入
clear()by calling
console.clear()method in the console or JavaScript code通过在控制台或JavaScript代码中调用
console.clear()方法- by clicking on the red circle in the top left corner of the console 通过单击控制台左上角的红色圆圈
by pressing
CTRL+Lin macOS, Windows and Linux在macOS,Windows和Linux中按
CTRL+Lby right-clicking in the Console and then pressing Clear console.
通过右键单击控制台,然后按“ 清除控制台” 。
You can preserve the log (by enabling the Preserve log checkbox) between page refreshes or changes until you clear the console or close the tab.
您可以在页面刷新或更改之间保留日志(通过启用“保留日志”复选框),直到清除控制台或关闭选项卡为止。
You can save the history in the Console as a text file by right-clicking in the console and selecting Save as…, then choosing the location of a log file.
通过在控制台中右键单击并选择“ 另存为...” ,然后选择日志文件的位置,可以将历史记录保存在控制台中为文本文件。
控制台变量 (Console variables)
The variables you create in the Console are persisted until you do a page refresh, so pay attention to when you’re using keywords such as let or const when declaring variables. Running the same code or function for the second time will throw an Uncaught SyntaxError, saying that the identifier has already been declared. You can either use the OR (||) operator to check if the variable is already defined or you can use var to declare variables, since it doesn’t complain for previously declared variables.
在控制台中创建的变量将一直保留到刷新页面为止,因此在声明变量时,请注意在使用诸如let或const之类的关键字时。 第二次运行相同的代码或函数将引发Uncaught SyntaxError ,表示标识符已经声明。 您可以使用OR( || )运算符检查变量是否已定义,也可以使用var声明变量,因为它不会抱怨以前声明的变量。
存储为全局变量特征 (Store as global variable feature)
If you’re logging objects to the console from your code, you may want to reference these variables from the console so you can check their values. Instead of searching through the console lines, let the console do that for you. There are some built-in ways you can reference these objects.
如果要从代码中将对象记录到控制台,则可能要从控制台引用这些变量,以便可以检查它们的值。 让控制台代替您在控制台行中进行搜索。 有一些内置的方法可以引用这些对象。
You can use $_, which references the last object that was returned in the console.
您可以使用$_ ,它引用控制台中返回的最后一个对象。
Another way is to use Store as global variable (right-click menu option) with any object that’s logged to the console or returned from a function to turn it into a global variable. Your newly created global variable will be called temp1. If you store more variables as global, they’ll be called temp2, temp3, and so on.
另一种方法是将“ 存储为全局变量” (右键单击菜单选项)与记录到控制台或从函数返回的任何对象一起使用,以将其转换为全局变量。 您新创建的全局变量将称为temp1 。 如果将更多变量存储为全局变量,它们将被称为temp2 , temp3 ,依此类推。
使用console.log()记录 (Logging with console.log())
When building complex, client-side web applications, it’s preferable to use the debugging tools provided by the browser, which can help developers figure out what’s happening at the code level without interfering with the actual user interface of the application (that is, using alert and message boxes to debug errors).
在构建复杂的客户端Web应用程序时,最好使用浏览器提供的调试工具,该工具可以帮助开发人员在代码级别上确定正在发生的事情,而不会干扰应用程序的实际用户界面(即,使用警报和消息框以调试错误)。
Once you have the DevTools Console open, try to log a simple statement:
打开DevTools控制台后,尝试记录一条简单的语句:
console.log("hello console");The console.log() method can take many parameters and format specifiers.
console.log()方法可以采用许多参数和格式说明符。
You can pass strings and other types of JavaScript variables, separated by commas, which will concatenate them into a single string with spaces in place of commas.
您可以传递字符串和其他类型JavaScript变量,以逗号分隔,这会将它们连接为单个字符串,并用空格代替逗号。
console.log("this is a concatenated string composed from: ",1,"and",{type:"object"} );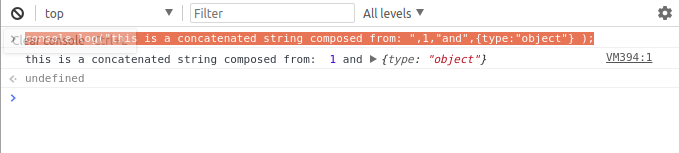
You can also add format specifiers:
您还可以添加格式说明符:
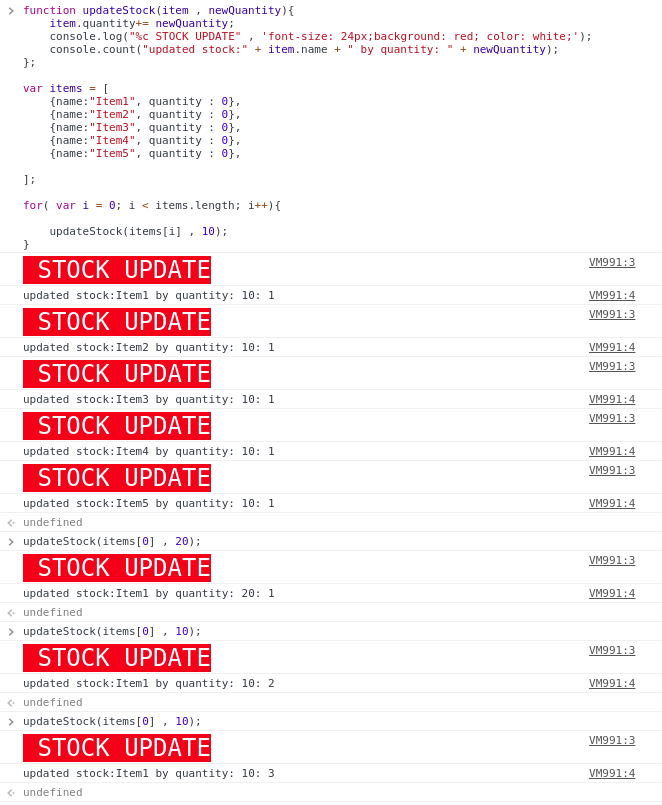
%s: specify placeholders for strings%s:指定字符串的占位符%d: specify placeholders for numbers%d:指定数字的占位符%i: specify placeholders for integers%i:为整数指定占位符%f: specify placeholders for floats%f:为浮点数指定占位符%o: specify placeholders for DOM elements%o:为DOM元素指定占位符%O: specify placeholders for JavaScript objects%O:为JavaScript对象指定占位符%c: specify CSS styles to format the console output%c:指定CSS样式以格式化控制台输出
var op1 = 1;
var op2 = 2;
var result = op1 * op2;
var operation = "multiply";

console.log('%c %s: %d x %d = %d','font-size: 24px;background: red; color: white;' ,operation, op1 , op2 , result);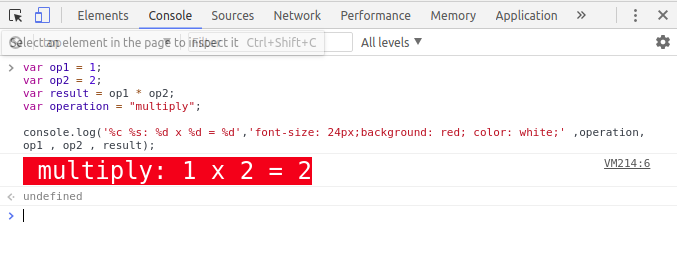
声明console.assert() (Asserting with console.assert())
console.assert() evaluates the first parameter, which is a boolean expression, and logs the second parameter if the expression fails (evaluates to false):
console.assert()计算第一个参数,它是一个布尔表达式,如果表达式失败(记录为false ),则记录第二个参数:
var a = 102;
var b = 101;
console.assert(a < b, "a is bigger than b");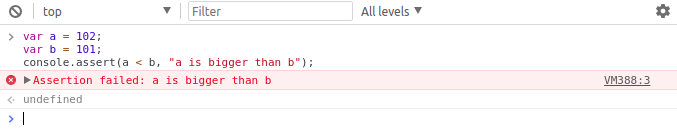
用console.count()计数执行 (Counting executions with console.count())
The console.count(label) outputs how many times it has been invoked at the same line and with the same label.
console.count(label)输出在同一行使用相同标签调用了它的次数。
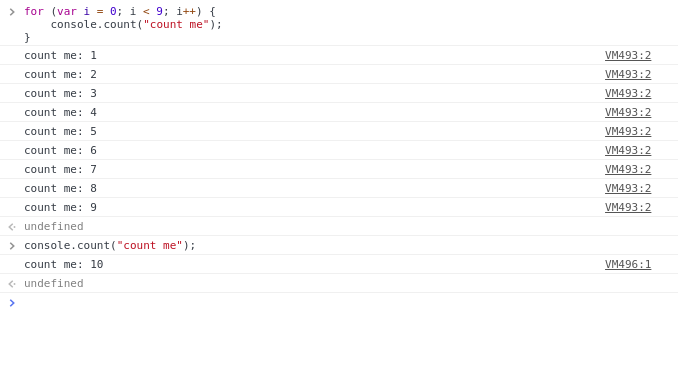
You can see from the screenshot that, when the same statement is passed to console.count(), the count is incremented by one.
您可以从屏幕截图中看到,将相同的语句传递给console.count() ,计数将增加一。
It can be very helpful if you need to keep track of how many times a function has been called or inside loops.
如果您需要跟踪某个函数被调用了多少次或在内部循环中,它会很有帮助。
Let’s see another example:
让我们看另一个例子:
These simple tweaks can save you a lot of time when debugging your application and trying to spot the output of some function, especially if your console is full of logging statements.
这些简单的调整可以在调试应用程序并尝试发现某些功能的输出时节省大量时间,尤其是在控制台中充满日志记录语句的情况下。
使用console.error(),console.info()和console.warn()标记控制台的输出 (Flagging the Console’s output with console.error(), console.info() and console.warn())
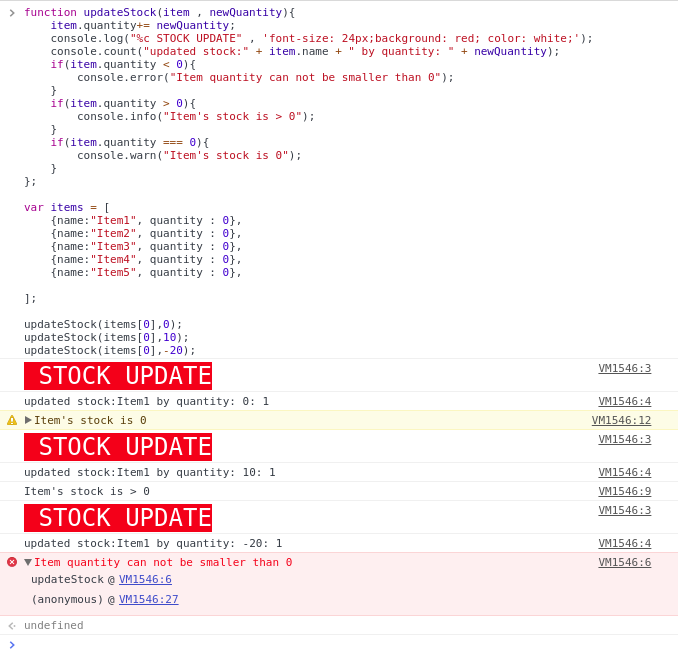
The console.error(), console.warn() and console.info() methods are similar to console.log(). They can be used to log information to the browser’s console, with some differences:
console.error() , console.warn()和console.info()方法类似于console.log() 。 它们可以用于将信息记录到浏览器的控制台,但有一些区别:
console.error()flags the output as an error on the Console and prints the error stack.console.error()在控制台上将输出标记为错误 ,并输出错误堆栈。console.warn()flags the output as a warning.console.warn()将输出标记为警告 。console.info()flags the output as info.console.info()将输出标记为info 。
Adding flags to the console output is very helpful, as the Console provides a way to only show messages with a specified flag.
在控制台输出中添加标志非常有帮助,因为控制台提供了一种仅显示具有指定标志的消息的方法。
筛选控制台日志 (Filtering the Console log)
Using the previous methods enables you to filter the Console output by severity level.
使用先前的方法,您可以按严重性级别过滤控制台输出。
You can also filter the output by text.
您还可以按文本过滤输出。
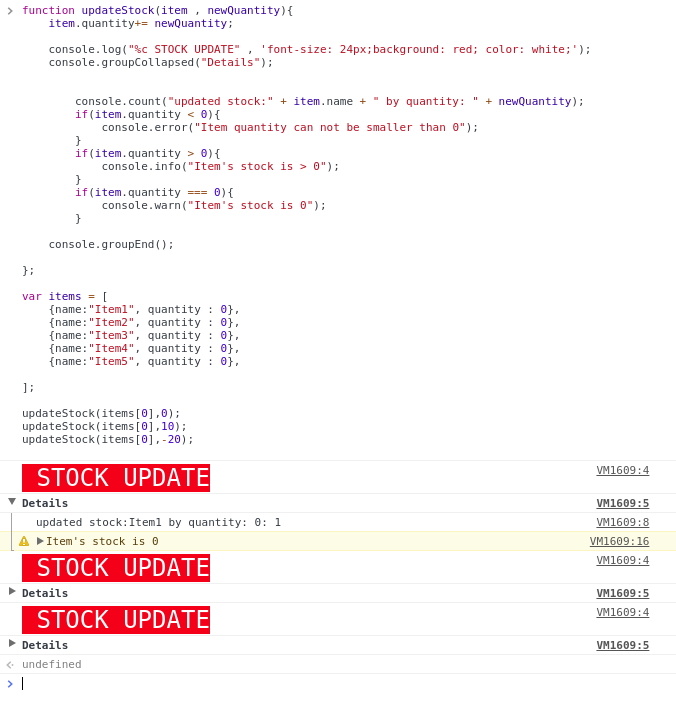
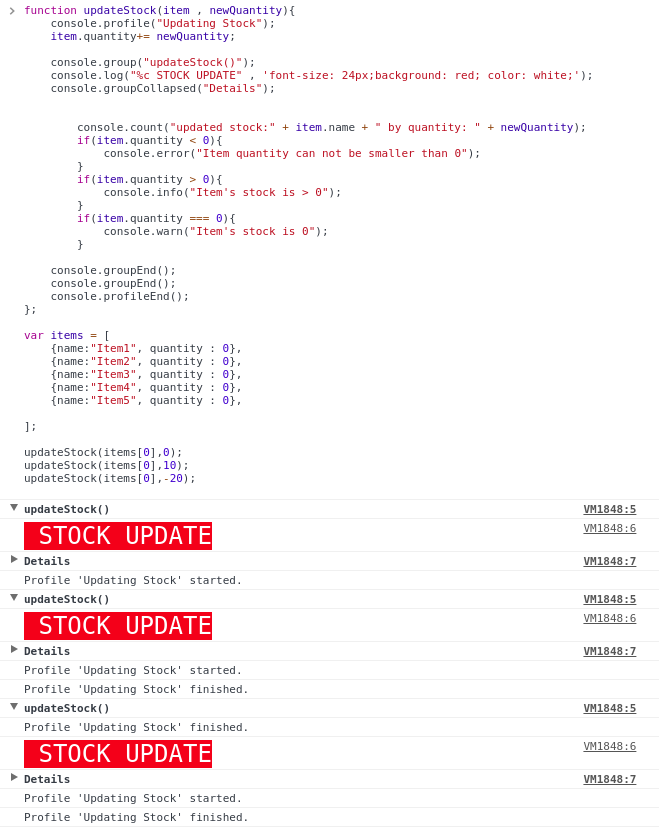
使用console.group(),console.groupCollapsed()和console.groupEnd()将控制台的输出分组 (Grouping the Console’s output with console.group(), console.groupCollapsed() and console.groupEnd())
Using console.group(name) or console.groupCollapsed(name) with console.groupEnd() you can group many log messages into one group.
通过将console.group(name)或console.groupCollapsed(name)与console.groupEnd()您可以将许多日志消息分为一组。
console.groupCollapsed() is the same as console.group() except that it creates a collapsed group.
console.groupCollapsed()与console.group()相同,除了它创建一个折叠组。
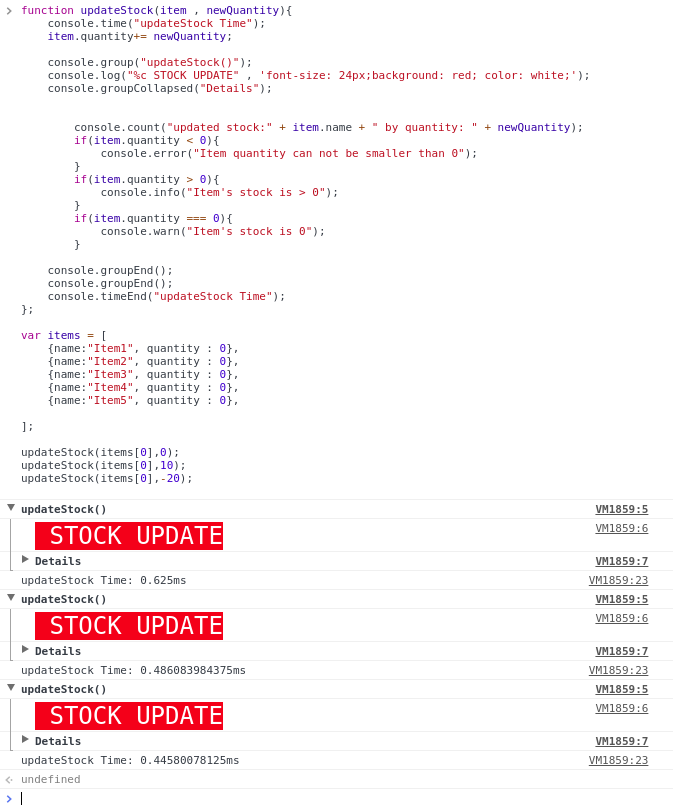
Let’s change our simple example to group messages into groups:
让我们更改简单的示例,将消息分组:
We can also nest groups:
我们还可以嵌套组:
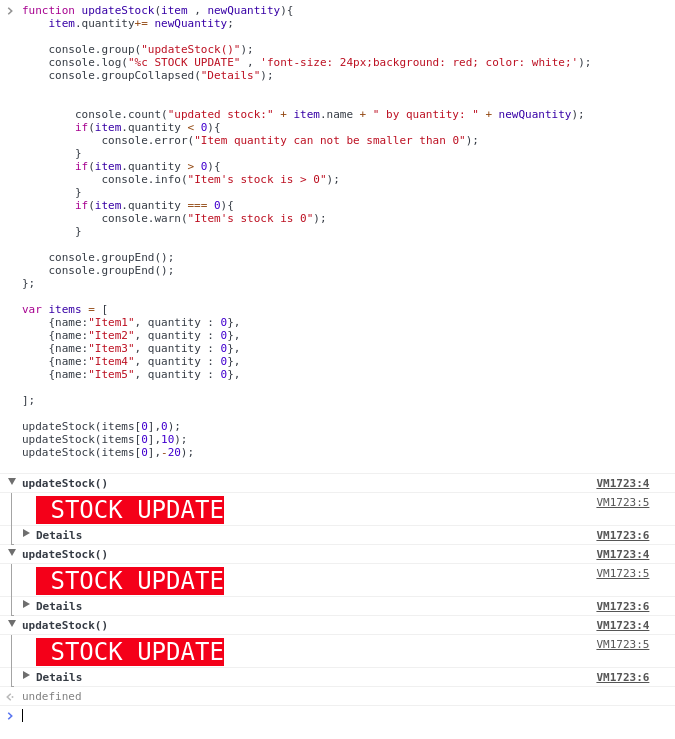
We created two groups: the outer group named updateStock(), then the inner collapsed group named Details. You can click on Details for more logging information.
我们创建了两个组:外部组名为updateStock() ,然后内部折叠组名为Details 。 您可以单击详细信息以获取更多日志记录信息。
使用console.table(),console.dir()和console.dirxml()记录数组和对象漂亮的数据 (Logging array and object pretty data with console.table(), console.dir() and console.dirxml())
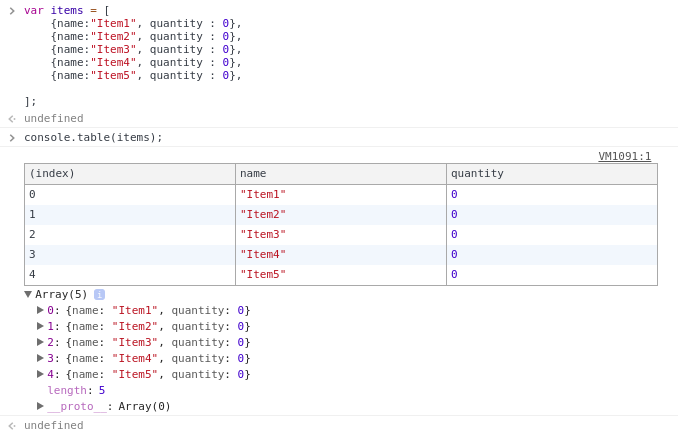
The console.table() method is useful for logging tabular data or arrays:
console.table()方法对于记录表格数据或数组很有用:
The console.dir() method is useful for logging an object as JSON data:
console.dir()方法对于将对象记录为JSON数据很有用:
console.log($("body"));
console.dir($("body"));
console.dirxml($("body"));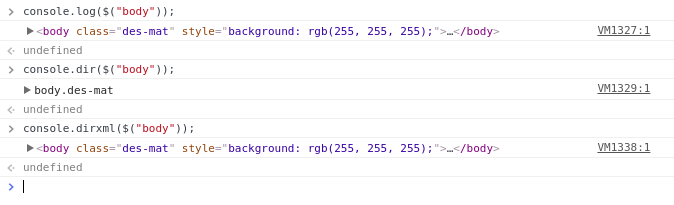
CPU配置文件 (CPU Profiles)
console.profile([label]) starts and console.profileEnd() ends a JavaScript CPU profile.
console.profile([label])启动, console.profileEnd()结束JavaScript CPU配置文件。
Let’s create a profile named Updating Stock for the updateStock() method:
让我们为updateStock()方法创建一个名为Updating Stock的配置文件:
function updateStock(item , newQuantity){
    console.profile("Updating Stock");
    //the method body
    console.profileEnd("updateStock Time");
}
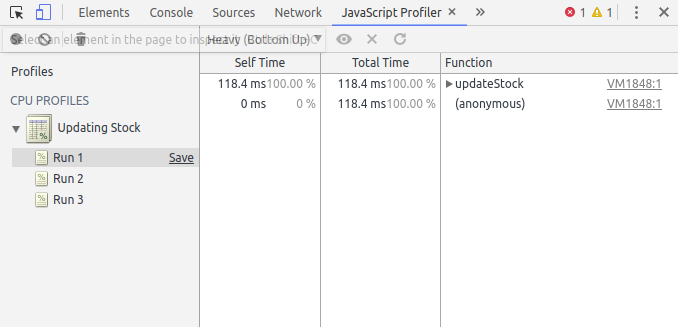
You can use the JavaScript Profiler panel to find your created profile, which allows you to see how much time the function takes to execute in each run.
您可以使用JavaScript Profiler面板找到您创建的配置文件,该文件可让您查看该函数在每次运行中花费的时间。
使用console.time()和console.timeEnd()测量执行时间 (Measuring the execution time with console.time() and console.timeEnd())
You can use console.time(label) and console.timeEnd(label) to measure the time it takes for your code to execute. Let’s measure the execution time of the updateStock() method in our simple example:
您可以使用console.time(label)和console.timeEnd(label)来衡量代码执行所花费的时间。 让我们在简单的示例中测量updateStock()方法的执行时间:
function updateStock(item , newQuantity){
    console.time("updateStock Time");
    //the method body
    console.timeEnd("updateStock Time");
}
获取JavaScript函数的堆栈跟踪 (Getting the stack trace for JavaScript functions)
By using console.trace() you can get the stack trace of the function, where it’s called, which allows you to better understand the code execution flow.
通过使用console.trace()您可以获取函数的堆栈跟踪(在调用该函数的位置),从而可以更好地了解代码执行流程。
The complete call stack of the function is displayed on the console with the code filenames and line numbers, which you can click on to navigate to the corresponding line in the source.
该函数的完整调用堆栈显示在控制台上,其中包含代码文件名和行号,您可以单击它们以导航到源代码中的相应行。
It’s worth mentioning that console.trace() can be also used with the DevTools Snippets tool.
值得一提的是, console.trace()也可以与DevTools Snippets工具一起使用。
使用monitorEvents()从控制台监视事件 (Monitoring events from the Console using monitorEvents())
You can monitor DOM events from the console with the monitorEvents method, which takes an object to be monitored as first parameter and an array of events to listen for as the second parameter. For example, let’s monitor the Google website for scroll, mousedown, mouseup and mouseover events:
您可以使用monitorEvents方法从控制台监视DOM事件,该方法将要监视的对象作为第一个参数,将要监听的事件数组作为第二个参数。 例如,让我们监视Google网站上的scroll , mousedown , mouseup和mouseover事件:
monitorEvents(document.body, ["scroll"]);
monitorEvents($$('img')[2], ["mouseover","mousedown", "mouseup"]);//monitor the logo image
从控制台查询DOM (Querying the DOM from the Console)
The DevTools Console has a method that allows you to query the current HTML document using CSS selectors. The method can be used by typing two dollar signs $$(selector), and it returns an array for all selectors.
DevTools控制台提供了一种允许您使用CSS选择器查询当前HTML文档的方法。 可以通过键入两个美元符号$$(selector)来使用该方法,并且该方法将为所有选择器返回一个数组。
These are some examples of what you can do with $$():
这些是您可以使用$$()进行操作的一些示例:
$$('p') // outputs an array of all <p> elements
$$('.cls') // outputs an array of all elements with the '.cls' class
$$('#id') // outputs the element with id '#id'
Even if the result is only one, the query method returns an array, so you need to use something like array[0] to access the result.
即使结果只有一个,查询方法也会返回一个数组,因此您需要使用诸如array[0]类的东西来访问结果。
Please note that you can also use the standard JavaScript API to query the current HTML document from the Console, such as document.querySelector() or document.getElementsByClass() etc.
请注意,您还可以使用标准JavaScript API从控制台查询当前HTML文档,例如document.querySelector()或document.getElementsByClass()等。
引用所选元素 (Referencing a selected element)
If you’re working with the DevTools Elements panel and you’ve selected some DOM element, you can easily have a reference to it in the Console panel without having to query for it.
如果您正在使用“ DevTools元素”面板,并且已经选择了一些DOM元素,则可以在“控制台”面板中轻松引用该元素,而不必查询它。
When you select the element, you can see that Chrome adds ==$0 which says that you can use $0 to reference that element from the console.
当您选择元素时,您会看到Chrome添加==$0 ,这表示您可以使用$0从控制台引用该元素。
在生产中禁用/清理控制台输出 (Disabling/cleaning Console output in production)
Using the different Console APIs in development is extremely useful, but you maybe don’t want all that logging information to be present in production, so you can either use tools to clean the production code or disable the Console API with this simple code:
在开发中使用不同的Console API极为有用,但是您可能不希望所有记录信息都出现在生产中,因此您可以使用工具清除生产代码,也可以使用以下简单代码禁用Console API:
(function () {
    var methods = [];
    var noop = () => {};

    Object.keys(window.console).forEach(key => {

        methods.push(key);

    });
    console.log(methods);
    var length = methods.length;

    var m;
    while (length--) {
        m = methods[length];
        window.console[m] = noop;
    }
}());
You can also use the following tools to clean production code:
您还可以使用以下工具来清理生产代码:
Webpack-strip: a Webpack module created by Yahoo! developers that strips custom functions (such as debug or console functions) from your code.
Webpack-strip :Yahoo!创建的Webpack模块。 从代码中剥离自定义功能(例如调试或控制台功能)的开发人员。
gulp-strip-debug: a module for GulpJS for stripping custom functions from your code.
gulp-strip-debug :GulpJS的模块,用于从代码中剥离自定义函数。
grunt-strip-debug: a module for GruntJS that strips custom functions.
grunt-strip-debug :GruntJS的模块,剥离自定义函数。
The Console panel is specifically designed for debugging JavaScript code. Let’s now cover the tools designed to profile and identify performance issues or areas of possible optimization.
“控制台”面板专门用于调试JavaScript代码。 现在,让我们介绍设计用于剖析和识别性能问题或可能优化领域的工具。
DevTools性能选项卡 (The DevTools Performance Tab)
The Performance panel is designed to record both the run-time and load-time performance of web applications to find bottlenecks. It can be used to measure things such as where your code spends most of its time. The information can be then used to further optimize the problematic areas that impact performance to reduce UI blocking and optimize UI responsiveness.
“性能”面板旨在记录Web应用程序的运行时和加载时性能,以查找瓶颈。 它可以用来衡量诸如代码花费大部分时间的地方。 然后,该信息可用于进一步优化影响性能的问题区域,以减少UI阻塞并优化UI响应能力。
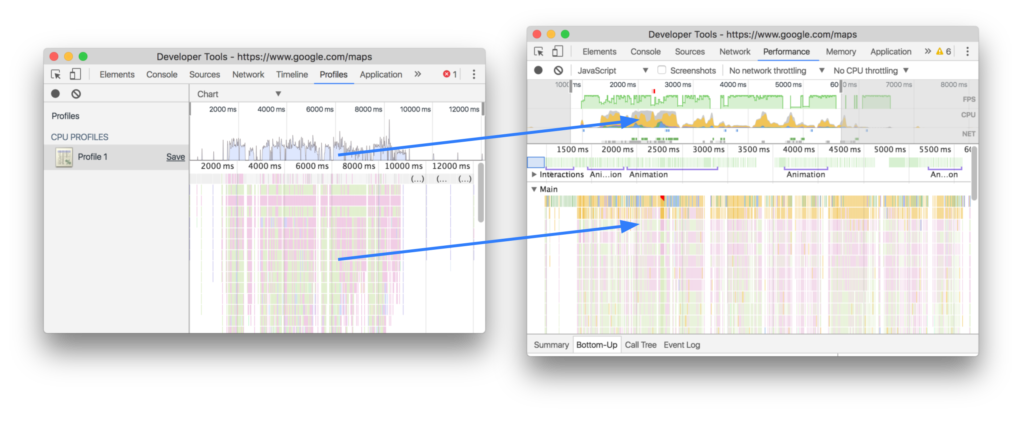
It’s worth mentioning that the Performance panel is new in Chrome. It combines the old Timeline and the JavaScript CPU Profiler, which still exists but is hidden under More tools — a step before it will be removed from future versions of Chrome.
值得一提的是,“性能”面板是Chrome中的新功能。 它结合了旧的时间轴和JavaScript CPU Profiler,后者仍然存在,但隐藏在“ 更多”工具下 -这是将其从以后的Chrome版本中删除的一个步骤。
The Performance tab can either profile the run-time performance or the load-time performance.
“性能”选项卡可以配置运行时性能或加载时性能。
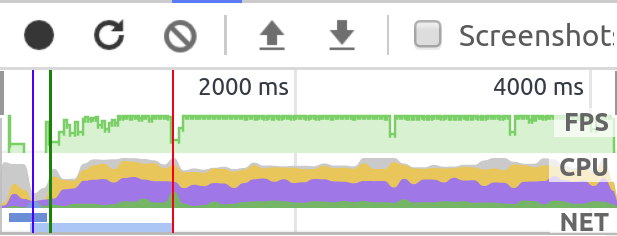
You can record a profile for runtime performance by clicking the record button (the black dot) or hit CTRL+E:
您可以通过单击记录按钮(黑点)或按CTRL+E来记录运行时性能的配置文件:
For load time performance, you need to use the second button or hit CTRL+Shift+E, which reloads the current page and starts a new recording.
为了提高加载时间,您需要使用第二个按钮或按CTRL+Shift+E ,这将重新加载当前页面并开始新的记录。
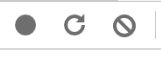
For a demo to profile, you can use the jank example provided by Google. You can read more about working with this demo here.
对于要演示的演示,可以使用Google提供的示例 。 您可以在此处阅读有关使用此演示的更多信息。
This demo is designed for testing purposes. You can either make the animations slower by adding more squares, or accelerate them by removing squares. You can also press the Optimize button to test the optimized code of this demo.
该演示旨在用于测试目的。 您可以通过添加更多正方形来使动画变慢,或者通过删除正方形来加快动画的速度。 您还可以按“优化”按钮来测试此演示的优化代码。
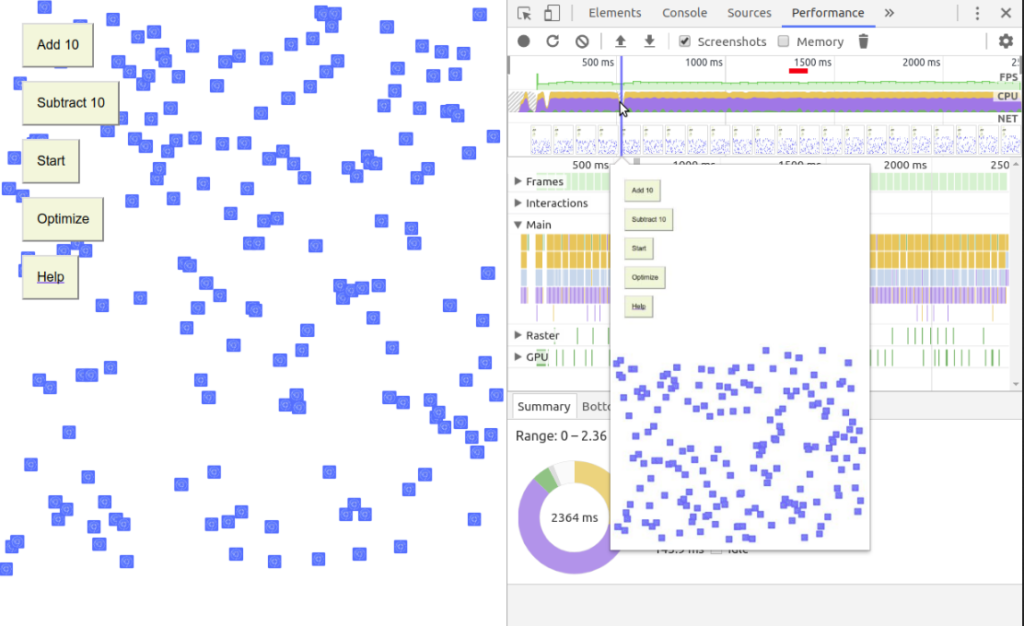
When profiling the performance of an application, make sure you use Chrome in Incognito Mode so you can prevent other open tabs — and especially the extensions installed on your Chrome installation — from interfering with your app’s profiling.
对应用程序的性能进行性能分析时,请确保在隐身模式下使用Chrome,以便防止其他打开的标签(尤其是Chrome安装中安装的扩展名)干扰应用程序的性能分析。
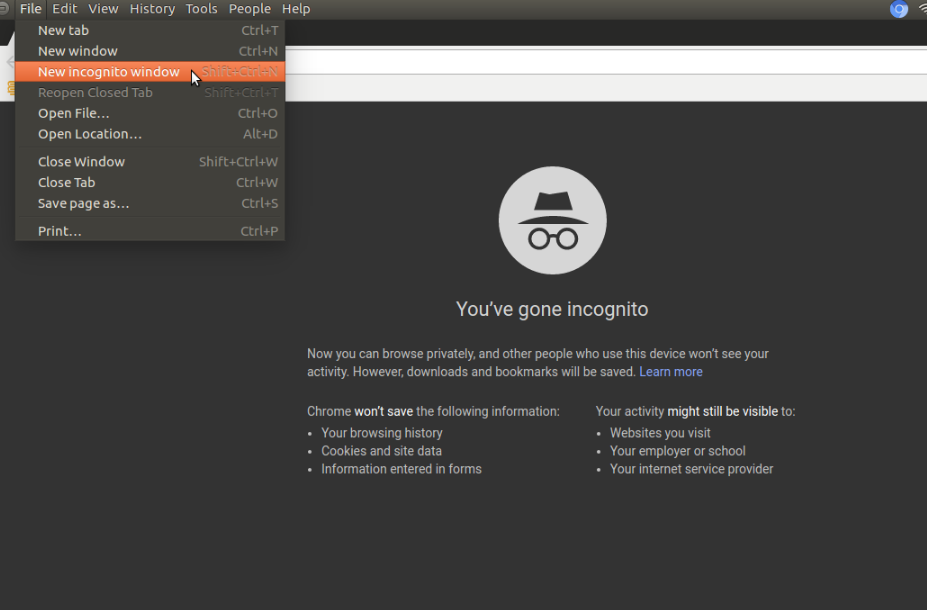
网络节流 (Network throttling)
The Performance tab allows you to throttle the network when profiling your app to simulate different network conditions.
通过“性能”选项卡,您可以在对应用进行性能分析以模拟不同的网络状况时节制网络。
You can choose between different network conditions such as Online, Offline, Fast 3G and Slow 3G.
您可以在不同的网络条件之间进行选择,例如在线,离线,快速3G和慢速3G。
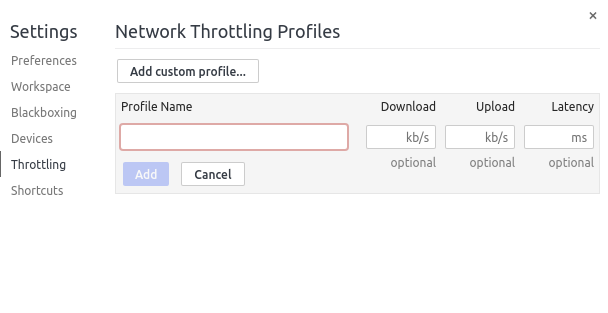
You can also add your custom condition to better target the conditions of your user base:
您还可以添加自定义条件,以更好地定位用户群的条件:
模拟移动CPU (Simulate Mobile CPU)
CPU throttling allows you to simulate the slow CPU power of mobile devices so you can accurately test how your web page performs in mobile devices.
CPU节流允许您模拟移动设备的慢CPU功能,因此您可以准确地测试网页在移动设备中的性能。
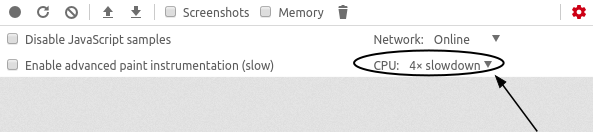
You can choose no throttling, 4x slowdown or 6x slowdown.
您可以选择无节流 , 4倍减速或6倍减速 。
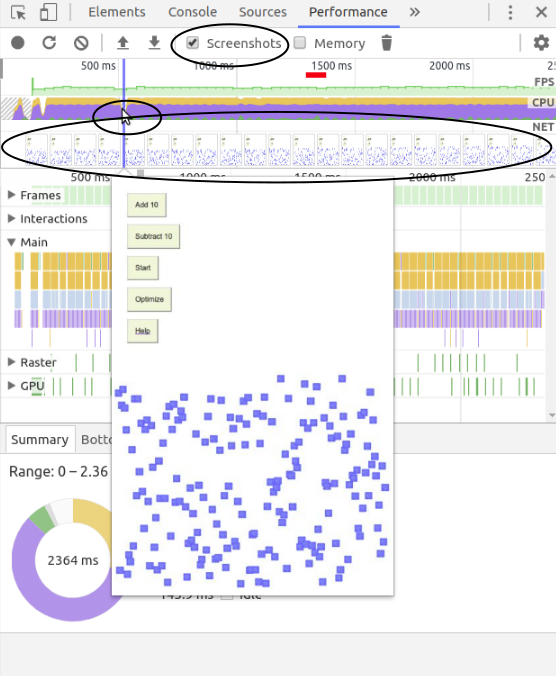
录制时截图 (Taking screenshots while recording)
You can take screenshots of every frame by checking the box Screenshots. Screenshots will help you visualize the state of your application’s user interface during profiling. They are especially helpful when you’re working with animations.
您可以选中截图框来获取每一帧的截图 。 屏幕快照可帮助您在分析过程中可视化应用程序用户界面的状态。 当您处理动画时,它们特别有用。
分析效果报告 (Analyzing the performance report)
Before you can optimize the performance of your application you need to profile it, for two reasons: first, to measure how bad the performance is, and second, to determine areas where possible optimizations can take place. Once you’ve generated a performance report, you can read about the meanings of different charts and how to use the other sub-tools.
在优化应用程序性能之前,您需要对其进行概要分析,其原因有二:首先,要评估性能有多差;其次,要确定可以进行优化的领域。 生成效果报告后,您可以阅读有关不同图表的含义以及如何使用其他子工具的信息。
放大或选择时间范围 (Zooming in or selecting time range)
DevTools enables you to zoom in over different charts and areas of the Performance tab report. You can focus on a portion of time, which will help you clearly understand what’s happening at the level of a few milliseconds.
DevTools使您可以放大“性能”选项卡报告的不同图表和区域。 您可以将注意力集中在一部分时间上,这将帮助您清楚地了解几毫秒级别的情况。
You can simply use your mouse to click over the area that includes the FPS, CPU, and Network charts. When the range handles appear you can then drag one of them or both to customize the selected portion.
您只需使用鼠标单击包含FPS,CPU和网络图表的区域即可。 出现范围手柄时,您可以拖动其中一个或两个,以自定义所选部分。
When you select a portion, all different charts and sections will be updated to only display information about frames and operations happening at the selected time.
当您选择一个部分时,所有不同的图表和节将更新为仅显示有关在选定时间发生的帧和操作的信息。
每秒帧数(FPS) (Frames Per Second (FPS))
Frame rate (expressed in frames per second or fps) is the frequency (rate) at which consecutive images called frames are displayed in an animated display. The term applies equally to film and video cameras, computer graphics, and motion capture systems. Frame rate may also be called the frame frequency, and be expressed in hertz.
帧速率(以每秒帧数或fps表示)是在动画显示器中显示连续图像(称为帧)的频率(速率)。 该术语同样适用于胶卷和摄像机,计算机图形和运动捕捉系统。 帧频也可以称为帧频,以赫兹表示。
From the definition, you can see that the frame rate is a concept related to filming and computer graphics, but it’s also used in the modern performance tools like Chrome DevTools to measure the page’s responsiveness to user interactions.
从定义中可以看到, 帧速率是一个与胶片和计算机图形学相关的概念,但是它也用于诸如Chrome DevTools之类的现代性能工具中,用于测量页面对用户交互的响应能力。
For building performant applications you need to target 60fps. Here’s a Google developers’s video that explains why 60fps rate is important:
对于构建高性能应用程序,您需要以60fps为目标。 这是一个Google开发人员的视频,解释了为什么60fps速率很重要:
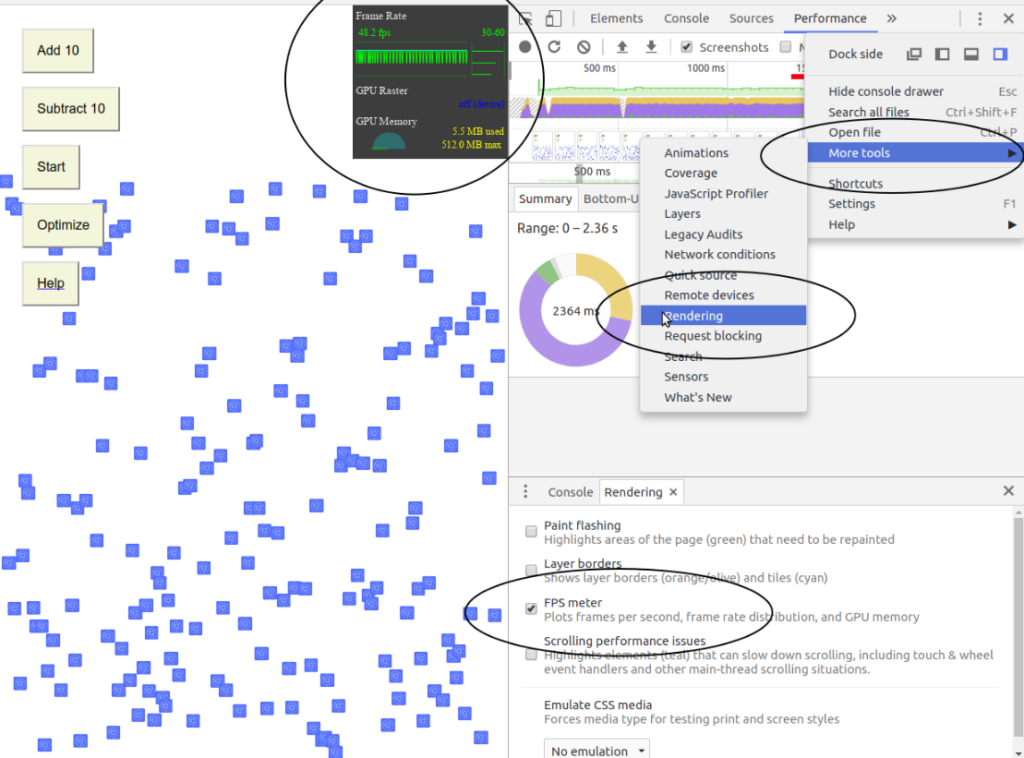
You can access a handy utility in DevTools (accessed from More tools -> Rendering tab) that displays a real-time visualization of your page FPS over time.
您可以在DevTools中访问一个方便的实用程序(可从更多工具->渲染选项卡访问),该实用程序随时间显示页面FPS的实时可视化。
FPS图表 (The FPS chart)
The FPS chart displays the frame rate per second over the time of the profiling process.
FPS图表显示性能分析过程中每秒的帧速率。
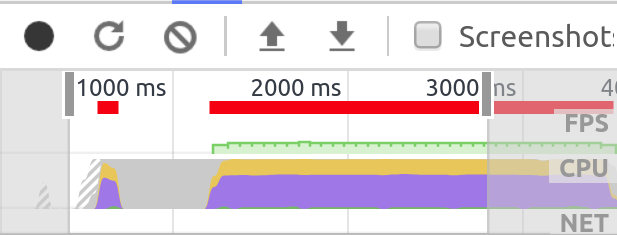
As pointed out by Google, the Red line in the FPS chart indicates that the frame-rate is so low to the point that it’s harming the user experience.
正如Google指出的那样, FPS图表中的红线表示帧速率太低,以至于损害了用户体验。
Here’s another screenshot of the optimized code with no red bars:
这是没有红线的优化代码的另一个屏幕截图:
The FPS chart can help you detect where you may have problems before you can dive in using the other sub-tools.
FPS图表可以帮助您在开始使用其他子工具之前检测出可能存在问题的地方。
镜框 (Frames)
Wikipedia defines frames like so:
Wikipedia定义如下框架:
A key frame in animation and filmmaking is a drawing that defines the starting and ending points of any smooth transition. The drawings are called “frames” because their position in time is measured in frames on a strip of film. A sequence of key frames defines which movement the viewer will see, whereas the position of the key frames on the film, video, or animation defines the timing of the movement. Because only two or three key frames over the span of a second do not create the illusion of movement, the remaining frames are filled with inbetweens.
动画和电影制作中的关键帧是定义任何平滑过渡的起点和终点的图形。 这些图形之所以称为“帧”,是因为它们的时间位置是以胶片上的帧为单位进行度量的。 一系列关键帧定义了观看者将看到的运动,而关键帧在电影,视频或动画上的位置定义了运动的时间。 因为在一秒钟的跨度中只有两个或三个关键帧不会产生运动的错觉,所以其余帧之间会填充中间的内容。
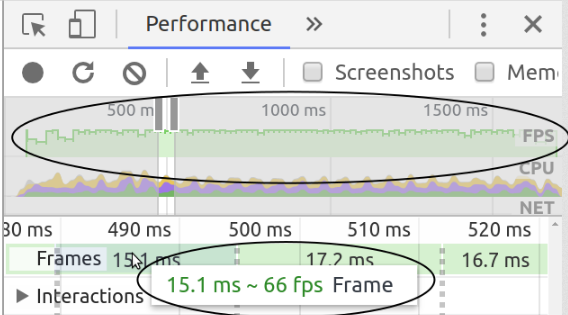
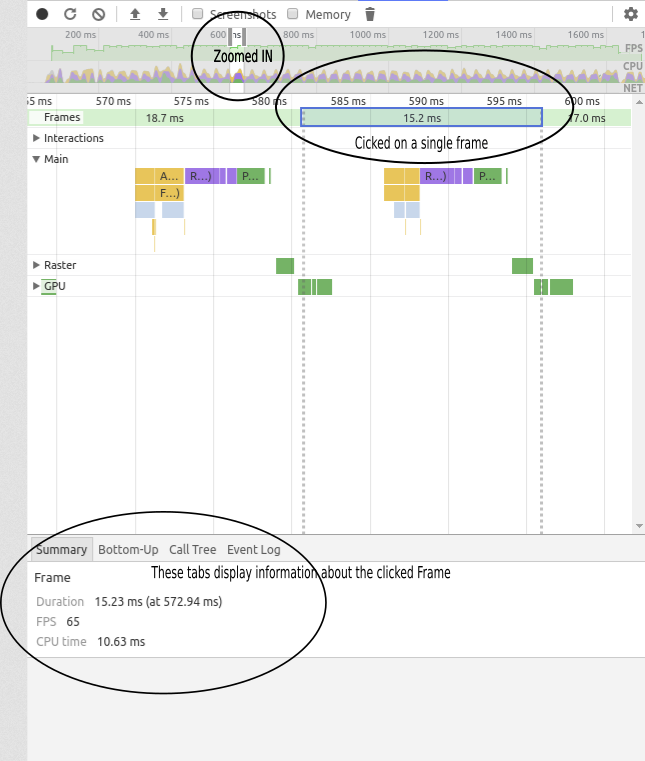
The Frames section, located right below the charts area, contains green boxes representing frames. Once you move your mouse over a particular Frame, DevTools shows you two important details: the FPS rate, and the amount of time taken by all operations involved to render that frame.
位于图表区域正下方的“框架”部分包含代表框架的绿色框。 将鼠标移到特定框架上后,DevTools将向您显示两个重要的细节:FPS速率以及渲染该框架所涉及的所有操作所花费的时间。
If you click on the frame box, the Summary, Bottom-Up, Call Tree and Event Log tabs will show you only the details for that particular frame.
如果单击框架框,则“摘要”,“自下而上”,“调用树”和“事件日志”选项卡将仅显示该特定框架的详细信息。
CPU图 (The CPU chart)
The CPU chart shows the activity of the CPU during profiling. It’s located below the FPS chart.
CPU图表显示了性能分析期间CPU的活动。 它位于FPS图表下方。
Colors correspond to different activities in the Summary tab. If you see that the CPU chart is full of colors, it means that the CPU was maxed out for long periods. This is a sign for you to do some performance optimization.
颜色对应于“摘要”选项卡中的不同活动。 如果您看到CPU图表充满颜色,则表示CPU长时间处于满负荷状态。 这是您进行一些性能优化的标志。
网络图表和网络部分 (The Network chart and Network section)
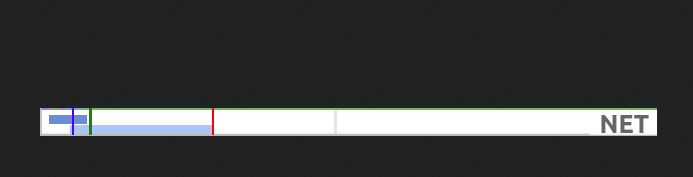
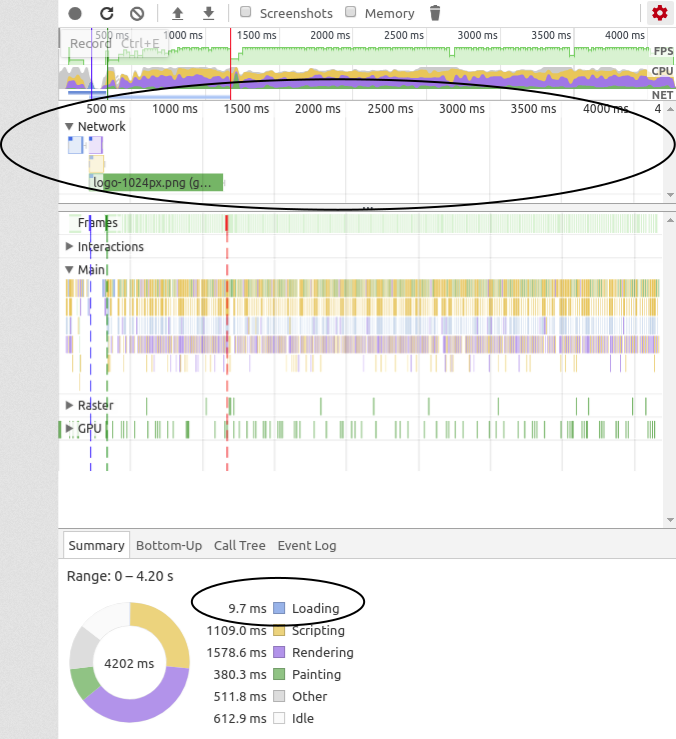
The net chart shows network requests during the profiling period. It’s specifically useful for load time profiling alongside the Network section which shows loading requests.
净图显示了分析期间的网络请求。 它对于显示加载请求的“网络”部分旁边的加载时间分析特别有用。
When you move your mouse over a request, it displays the loading time for that particular request.
将鼠标移到某个请求上时,它将显示该特定请求的加载时间。
When you click a particular request, all other sub-tools update to include operations that happen only during the request.
单击特定请求时,所有其他子工具都会更新,以包括仅在请求期间发生的操作。
Different colors represent different resource types — JavaScipt, CSS, images etc. Resources that took longer to load have longer bars. The lighter part of each bar represents the Time to First Byte or TTFB. The darker part represents the Transfer time.
不同的颜色代表不同的资源类型-JavaScipt,CSS,图像等。加载时间较长的资源具有更长的条形。 每个条的较亮部分代表到第一个字节的时间或TTFB 。 较深的部分表示传输时间 。
摘要选项卡 (The Summary tab)
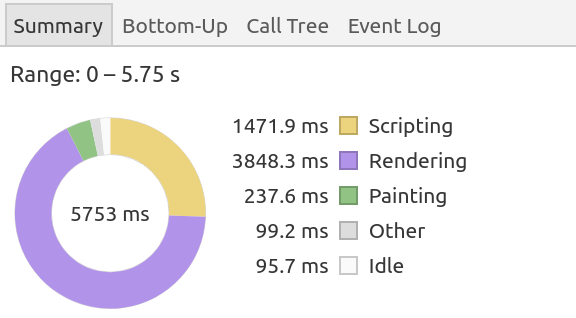
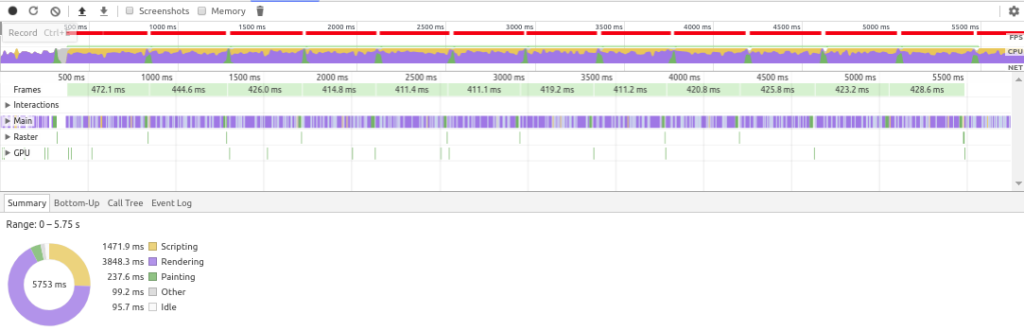
We have profiled the app for a period of 5.75s (or 5753ms). When there’s no selected time portion — on the overview area, where FPS and other charts exist — the range points to the whole period of profiling. It shows a colored breakdown of activities the browser is performing. We can draw a bunch of conclusions from this breakdown: out of 5753 ms, 3848.3ms (the most time) is spent in rendering, and for 95.7ms the thread was idle.
我们对该应用程序的分析时间为5.75秒 (或5753ms )。 当没有选定的时间部分时-在存在FPS和其他图表的概览区域中-范围将指向整个分析期间。 它显示了浏览器正在执行的活动的彩色细分。 我们可以从这种故障中得出很多结论:在5753毫秒中 ,有3848.3 毫秒 (最多的时间)用于渲染,而95.7毫秒中线程处于空闲状态。
You can optimize the performance of this app by trying to reduce the time spent in rendering.
您可以通过尝试减少渲染时间来优化此应用的性能。
When an event or a function call is selected in the Main area, the Summary tab shows only information about that event/call.
在“主”区域中选择事件或功能调用时,“摘要”选项卡仅显示有关该事件/调用的信息。
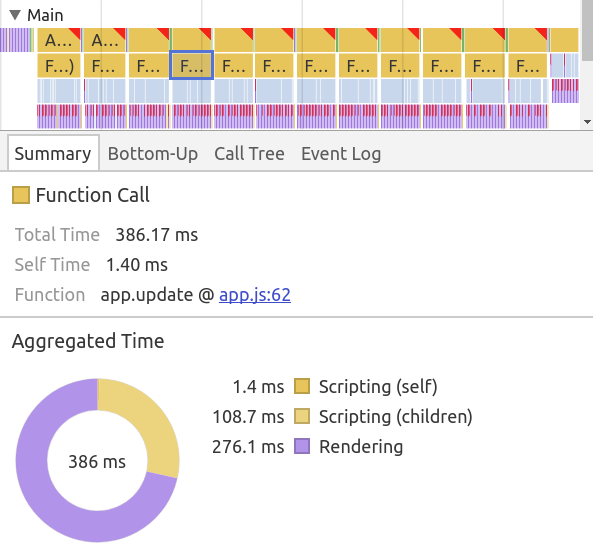
The summary tab provides you with detailed timing information — that is, where the browser spent its time. Before you can take steps to optimize your code, you need to get information about exactly where you need to take action. For this, you can to use the other tools (Call Tree tab, Bottom-Up tab and Event Log tabular views) under the Performance tab.
摘要选项卡为您提供详细的计时信息,即浏览器的时间。 在采取步骤优化代码之前,您需要获取有关确切位置的信息。 为此,您可以使用“性能”选项卡下的其他工具(“调用树”选项卡,“自下而上”选项卡和“事件日志”表格视图)。
The Bottom-Up tab: This tab displays aggregated activities, from a bottom-up perspective, that took up the most time during a selected range of time or during all the profiling time if no range is selected.
“自下而上”选项卡 :此选项卡从下至上显示从所选时间范围内或所有性能分析时间(如果未选择范围)中花费最多时间的汇总活动。
The Call Tree tab: displays activities with their call stacks during the (selected) profiling time.
“调用树”选项卡 :在(选定的)性能分析时间内显示活动及其调用堆栈。
The Event Log tab displays events, in the order in which they are executed, in profiling time or during a selected time.
“事件日志”选项卡以事件执行的顺序,概要分析时间或选定时间显示事件。
主要部分 (The Main Section)
火焰图/图表 (Flame Graphs/Charts)
Brendan Gregg, a kernel and performance engineer who created many visualization types for performance analysis, defines Flame graphs as:
内核和性能工程师Brendan Gregg创建了许多可视化类型用于性能分析,他将Flame图形定义为:
Flame graphs are a visualization of profiled software, allowing the most frequent code-paths to be identified quickly and accurately. Flame graphs are a visualization for sampled stack traces, which allows hot code-paths to be identified quickly.
火焰图是分析软件的可视化,可以快速,准确地识别出最频繁的代码路径。 火焰图是采样堆栈轨迹的可视化,可以快速识别热代码路径。
You can also read his detailed article about Flame graphs.
您还可以阅读他有关火焰图的详细文章。
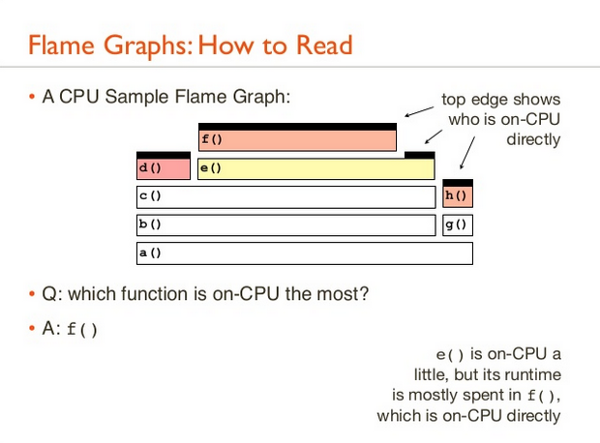
The Main section within the Performance tab shows you a flame chart of the activities on the main thread.
“性能”选项卡中的“主要”部分为您显示了主线程上活动的火焰图。
The Flame Chart displays the state of your code’s JavaScript stack (with detailed information about functions and events that were called) at the millisecond scale, during the time period of the performance profiling process.
火焰图表在性能分析过程的时间段内以毫秒为单位显示代码JavaScript堆栈状态(包含有关调用的函数和事件的详细信息)。
The y-axis indicates the call stack depth, and the x-axis indicates the recording time. Each box (or bar when zoomed in) is a stack frame for an event or a function call. The box’s width represents how much time the operation has taken.
y轴表示呼叫堆栈深度 , x轴表示记录时间 。 每个框(或放大时的条形框)都是事件或函数调用的堆栈框。 框的宽度表示操作已花费了多少时间。
The ordering from left to right is not important (the stacks are sorted alphabetically). Wider bars indicate longer times, so you need to focus on those for optimizing the performance of you code. The Red triangle at the top-right of every box (representing a function call or a fired event) indicates that something is wrong with the operation. The colors in the different performance charts correspond to the colors in the Main section.
从左到右的顺序并不重要(堆栈按字母顺序排序)。 较宽的条表示较长的时间,因此您需要集中精力优化代码的性能。 每个框右上角的红色三角形(表示函数调用或激发的事件)表示操作有问题。 不同性能图表中的颜色与“主要”部分中的颜色相对应。
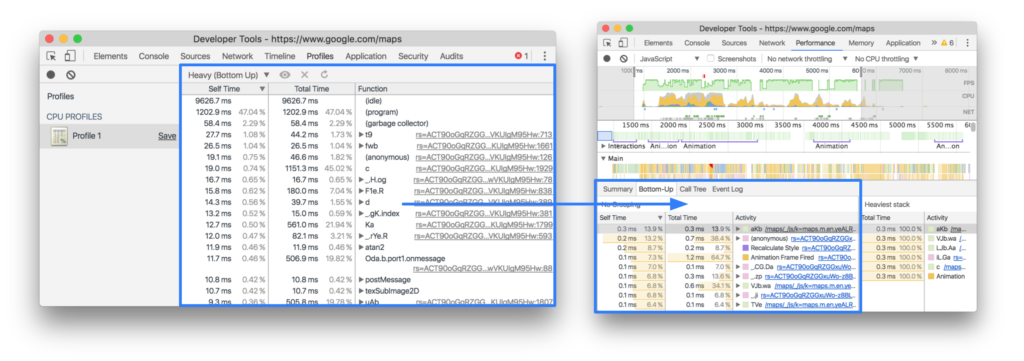
All of this is replacing the old JavaScript CPU Profiler.
所有这些都取代了旧的JavaScript CPU Profiler 。
The Bottom-Up tab replaces the old CPU profiler’s heavy (Bottom Up) view.
“自下而上”选项卡取代了旧的CPU分析器的较重的(“自下而上”)视图。
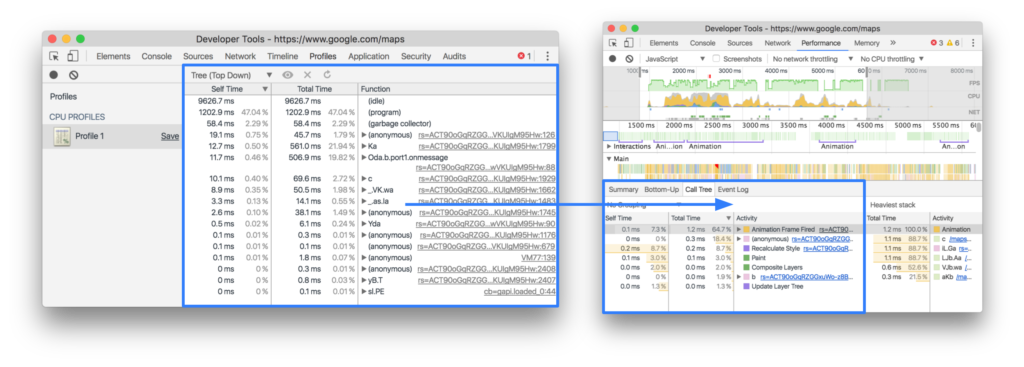
The Tree (Top Down) view in the old CPU Profiler can be replaced by the Call Tree tab.
旧的CPU Profiler中的树(自上而下)视图可以由“调用树”选项卡代替。
审核选项卡 (The Audits Tab)
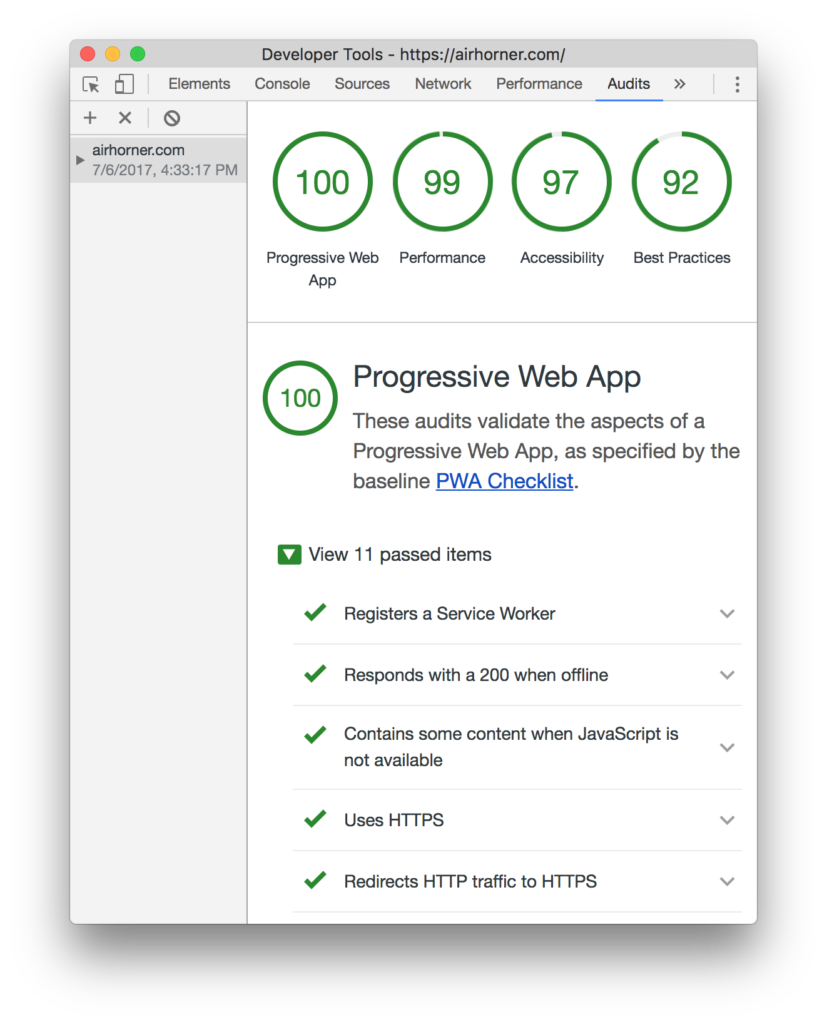
The Audits tool can be used to identify and guide you to solve common problems that affect your web application performance, accessibility and user experience. It has many audits and best practices and gives your application a score calculated based on how many audits you’ve passed and how many best practices you’ve followed and their weights (that is, not all audits have the same contribution in the final score). The final Audits report lists all audits in two categories — passed and failed — and shows tips/guidelines with links to external Google Web Developers blog posts on how to pass a specific audit.
审核工具可用于识别和指导您解决影响Web应用程序性能,可访问性和用户体验的常见问题。 它具有许多审核和最佳实践,并根据您通过了多少次审核,您遵循了多少次最佳实践及其权重(即,并非所有审核对最终分数的贡献),为您的应用程序评分)。 最终的审核报告列出了通过和未通过两类的所有审核,并显示了提示/指南,以及指向有关如何通过特定审核的外部Google Web Developers博客文章的链接。
访问审核并执行审核 (Accessing audits and performing an audit)
You can access Audits by opening DevTools, then activating its tab by clicking on it.
您可以通过打开DevTools,然后单击它来激活其选项卡来访问审计。
Next you can perform an audit by triggering the blue “Perform an audit…” button in the middle, then selecting the category of the audits to perform (or all of them), and finally clicking Run audit.
接下来,您可以通过触发中间的蓝色“执行审核...”按钮来执行审核,然后选择要执行的审核类别(或所有审核类别),最后单击“运行审核” 。
- Progressive Web App: run audits to test if the page meets the standard of progressive web apps 渐进式Web应用程序:运行审核以测试页面是否符合渐进式Web应用程序的标准
- Performance: run performance audits 绩效:进行绩效审核
- Best practices: run audits to test if the page follows the best practices for modern web development 最佳做法:运行审核以测试页面是否遵循现代Web开发的最佳做法
- Accessibility: run audits to test if the page can be usable by people of disabilities and impairments. 可访问性:运行审核以测试该页面是否可供残障人士使用。
Lighthouse sets up DevTools to emulate a mobile device, runs a bunch of tests against the page, and then displays the results in the Audits panel. You can then visualize the report or download it.
Lighthouse设置DevTools来模拟移动设备,对该页面进行一系列测试,然后在Audits面板中显示结果。 然后,您可以可视化报告或下载报告。
Please note that Audits is powered by Lighthouse, an open-source tool for improving the quality of web apps, which we’ve covered in more details in Progressive Web Apps: Crash Course.
请注意,审计是由Lighthouse提供支持的, Lighthouse是一种用于提高Web应用程序质量的开放源代码工具,我们已在Progressive Web Apps:Crash Course中详细介绍了该工具。
结论 (Conclusion)
Once you understand the cause of the performance issues at the code level, you can apply different JavaScript techniques to solve the bottleneck such as using requestAnimationFrame() or executing the operation in its own thread using HTML5 Web Workers.
一旦了解了代码级性能问题的原因,就可以应用不同JavaScript技术解决瓶颈,例如使用requestAnimationFrame()或使用HTML5 Web Workers在其自己的线程中执行操作。
In this article, we covered Chrome DevTools, specifically the Console panel and API and performance-related tools. You can find the different snippets used above in this repo.
在本文中,我们介绍了Chrome DevTools,特别是“控制台”面板以及与API和性能相关的工具。 您可以在此仓库中找到上面使用的不同片段。
翻译自: https://www.sitepoint.com/optimization-auditing-a-deep-dive-into-chromes-dev-console/
chrome 控制台


 3787
3787

 被折叠的 条评论
为什么被折叠?
被折叠的 条评论
为什么被折叠?
 到【灌水乐园】发言


