


手机浏览器devtools
During the past decade, browser development tools (browser DevTools) have evolved from basic JavaScript consoles to fully-integrated development and debugging environments. It’s become possible to alter and inspect any aspect of your web application but few of us venture beyond the basics.
在过去的十年中,浏览器开发工具(浏览器DevTools)已从基本JavaScript控制台演变为完全集成的开发和调试环境。 更改和检查Web应用程序的任何方面都是可能的,但是我们当中很少有人敢于超越基础。
We’ll explore a range of features you may or may not have considered. Chrome’s DevTools are described in most cases but alternative options are shown for Firefox where available.
我们将探讨您可能考虑或未考虑的一系列功能。 大多数情况下都会介绍Chrome的DevTools,但会在可用的Firefox中显示其他选项。
键盘快捷键 (Keyboard Shortcuts)
Using a menu to launch DevTools wastes valuable seconds! Try one of these options instead:
使用菜单启动DevTools会浪费宝贵的时间! 请尝试以下选项之一:
F12F12ctrl + shift + ictrl + shift + icmd + option + jcmd + option + jor right-click any element on the page and choose Inspect or Inspect Element.
或右键单击页面上的任何元素,然后选择“ 检查”或“ 检查元素” 。
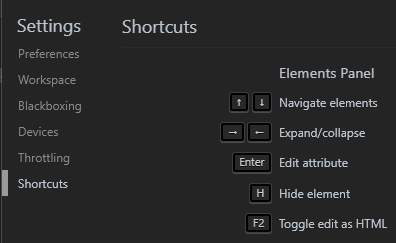
Chrome provides useful keyboard shortcut assistance. From DevTools, press F1 or select Settings from the three-dot menu at the top-right. Then choose Shortcuts from the menu:
Chrome提供有用的键盘快捷键帮助。 在DevTools中,按F1键或从右上角的三点菜单中选择“设置” 。 然后从菜单中选择快捷方式 :
对接 (Docking)
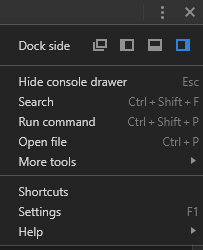
The DevTools pane can be docked to the left, right or bottom of the browser window. If you require more room, undock it to a separate window. Docking options are found in the main three-dot menu in Chrome:
DevTools窗格可以停靠在浏览器窗口的左侧,右侧或底部。 如果需要更多空间,请将其停靠在单独的窗口中。 停靠选项可在Chrome的主三点菜单中找到:
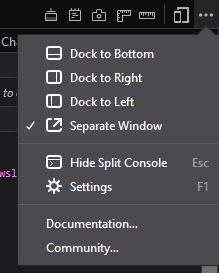
and Firefox:
和Firefox:
设定值 (Settings)
DevTool settings can be accessed from the same menu or by pressing F1. This allows you to set options such as the tools shown, theme, tab sizes, color units and more.
可以从同一菜单或按F1来访问DevTool设置。 这使您可以设置选项,例如显示的工具,主题,选项卡大小,颜色单位等。
自动启动DevTools (Auto-start DevTools)
When working on a web application, it may be practical to create a dedicated desktop shortcut to launch your browser, open the URL and launch DevTools in a single step. For Chrome, create a desktop icon with the following Chrome command-line options:
在使用Web应用程序时,创建一个专用的桌面快捷方式来启动浏览器,打开URL并启动DevTools可能很实际。 对于Chrome,请使用以下Chrome命令行选项创建一个桌面图标:
chrome --auto-open-devtools-for-tabs http://localhost:8000/where http://localhost:8000/ is your development URL.
其中http://localhost:8000/是您的开发URL。
Similarly for Firefox:
对于Firefox同样:
firefox -devtools -url http://localhost:8000/(The executable name may differ across systems.)
(可执行文件的名称可能会因系统而异。)
在开发过程中隐身 (Go Incognito During Development)
Incognito/private mode does not retain data such as cookies and localStorage after the browser is closed. The mode is ideal for testing Progressive Web Apps (PWAs) and log-in systems.
关闭浏览器后,隐身/私有模式不会保留Cookie和localStorage之类的数据。 该模式是测试渐进式Web应用程序(PWA)和登录系统的理想选择。
You can start browsers in incognito mode manually or by adding --incognito to Chrome or -private to Firefox’s command line.
您可以手动以隐身模式启动浏览器,也可以在Chrome浏览器中添加--incognito或在Firefox命令行中添加-private 。
命令面板 (Command Palette)
Chrome DevTools offers an editor-like command palette. Press ctrl + shift + p:
Chrome DevTools提供了类似编辑器的命令面板。 按ctrl + shift + p :
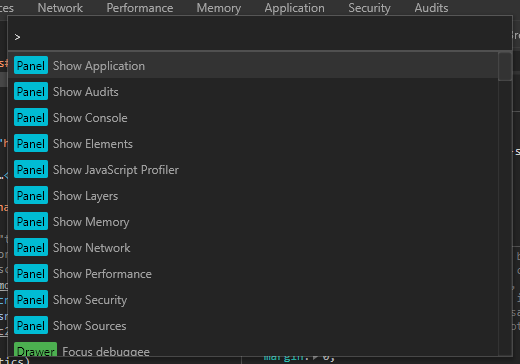
It provides quick access to most functions and source files (hit backspace to remove the >).
它提供对大多数功能和源文件的快速访问(单击退格键可删除> )。
逃到控制台 (Escape to the Console)
The console is useful regardless of which DevTool panel you’re using. Hit Esc to show and hide a console window in the bottom pane.
无论您使用哪个DevTool面板,该控制台都非常有用。 单击Esc在底部窗格中显示和隐藏控制台窗口。
查找页面颜色 (Find Page Colors)
Most browsers show a color picker when you click any CSS color property. Chrome also shows the colors used in the page at the bottom of the panel:
单击任何CSS颜色属性时,大多数浏览器都会显示颜色选择器。 Chrome还会在面板底部的页面中显示使用的颜色:
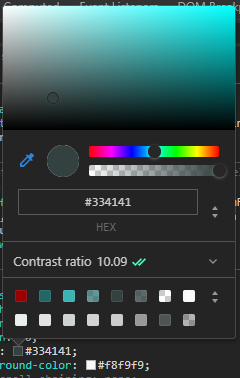
The panel can be clicked to show further colors.
可以单击面板以显示其他颜色。
色差可及性 (Color Contrast Accessibility)
The color picker also shows the contrast ratio which indicates the visual difference between the foreground text and background color. Click the ratio to view how this rates against AA and AAA accessibility standards which ensure text can be read by most people:
拾色器还显示对比度,该对比度指示前景文本和背景颜色之间的视觉差异。 单击比率以查看此比率如何根据AA和AAA可访问性标准进行评估,以确保大多数人可以阅读文本:
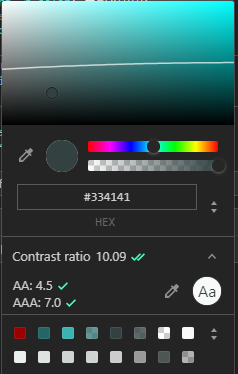
Any color below the line on the color swash will pass AA contrast recommendations.
在色标上的线条下方的任何颜色都将通过AA对比度建议。
捕获截图 (Capture Screenshots)
From Chrome’s command palette (ctrl + shift + p), type ‘screenshot’ then choose an option to capture the current viewport, the whole page, or the currently-active element. The file will be saved to the download folder. (Chrome 74+ also permits area capture.)
在Chrome的命令面板( ctrl + shift + p )中,键入“ screenshot”,然后选择一个选项以捕获当前视口,整个页面或当前活动的元素。 该文件将保存到下载文件夹中。 (Chrome 74+还可以捕获区域。)
Firefox provides the Take a screenshot system which is available from most menus. In addition, you can right-click any element in the DOM view and select Screenshot Node.
Firefox提供了“截屏”系统,大多数菜单都提供该系统。 此外,您可以在DOM视图中右键单击任何元素,然后选择Screenshot Screen 。
查找未使用CSS和JavaScript (Find Unused CSS and JavaScript)
Chrome’s new Coverage panel allows you to quickly locate unused code. Select Coverage from the DevTools More tools sub-menu then hit the record button and browse around your application. Then click any file to open its source:
Chrome的新Coverage面板可让您快速找到未使用的代码。 从“ DevTools 更多工具”子菜单中选择Coverage ,然后单击“记录”按钮并浏览您的应用程序。 然后单击任何文件以打开其源:
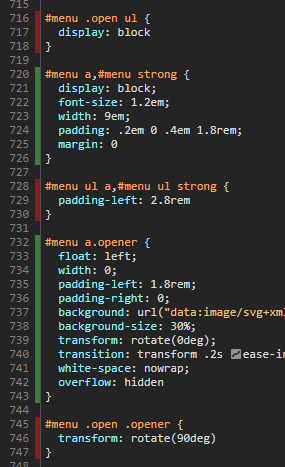
Unused code is highlighted in red in the line number gutter.
未使用的代码在行号槽中以红色突出显示。
Note that Chrome does not appear to remember used/unused code when you navigate to a new page, but I expect this will be provided in a future release.
请注意,当您导航到新页面时,Chrome似乎不会记住已使用/未使用的代码,但是我希望以后的版本中会提供该代码。
禁用网络缓存 (Disable the Network Cache)
Check Disable cache in the Network panel to load all files from the network. This provides a better assessment of first-time page loads.
选中“ 网络”面板中的“ 禁用缓存”以从网络加载所有文件。 这样可以更好地评估首次页面加载。
节气门网络速度 (Throttle Network Speed)
Similarly, there’s little point testing your system a 1gbps connection when most users access over 3G. The Network panel provides an Online drop-down in Chrome and a Throttling drop-down in Firefox which allows you to emulate specific network speeds.
同样,当大多数用户通过3G访问时,将系统测试为1gbps连接几乎没有意义。 “ 网络”面板在Chrome中提供了一个“ 在线”下拉列表,在Firefox中提供了“ 节流”下拉列表,使您可以模拟特定的网络速度。
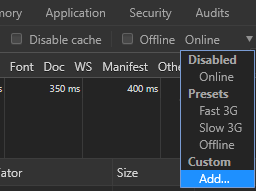
Chrome also provides a facility to add your own throttling profiles.
Chrome浏览器还提供了添加您自己的限制配置文件的功能。
重新排列网络响应 (Reorder Network Responses)
By default, the Network panel shows a table of requests and responses in download order. However, any table heading can be clicked to re-order by name, status, type, size, response time, etc.
默认情况下,“ 网络”面板以下载顺序显示请求和响应表。 但是,可以单击任何表格标题以按名称,状态,类型,大小,响应时间等重新排序。
过滤不完整的请求 (Filter Incomplete Requests)
To discover any incomplete or unresponsive HTTP requests, access the Network panel and enter is:running in the Filter box.
要发现任何不完整或无响应的HTTP请求,请访问“ 网络”面板,然后在“ 过滤器”框中输入is:running 。
依回应大小筛选 (Filter by Response Size)
From the Network panel, enter larger-than:S in the Filter box, where S is a size in bytes (1000000), kilobytes (1000k), or megabytes (1M). Responses greater than the chosen size are shown.
在“ 网络”面板的“ 过滤器”框中,输入larger-than:S ,其中S的大小以字节( 1000000 ),千字节( 1000k )或兆字节( 1M )为单位。 显示的响应大于所选的大小。
To find responses which are smaller, use -larger-than:S.
要查找较小的响应,请使用-larger-than:S 。
过滤第三方内容 (Filter Third-Party Content)
From the Network panel, enter -domain:*.yourdomain in the Filter box, where yourdomain is your primary URL, e.g. sitepoint.com. The remaining responses show third-party requests to CDNs, trackers, social media buttons, etc. The number of requests and payload sizes is shown in the status bar below the table.
在“ 网络”面板的“ 过滤器”框中,输入-domain:*.yourdomain ,其中yourdomain是您的主要URL,例如sitepoint.com 。 其余响应显示对CDN,跟踪器,社交媒体按钮等的第三方请求。请求数量和有效负载大小显示在表格下方的状态栏中。
阻止网络请求 (Block Network Requests)
It is possible to block trackers, analytics, social media widgets, or any other requests during testing.
在测试过程中,可能会阻止跟踪器,分析,社交媒体窗口小部件或任何其他请求。
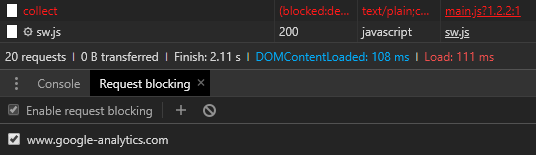
Right-click any HTTP request in Chrome’s Network panel and choose Block request URL to block that URL or Block request domain to block any request to that domain. The Request blocking panel will open where you can add or remove further URLs or domains:
在Chrome的“ 网络”面板中右键单击任何HTTP请求,然后选择阻止请求URL以阻止该URL或阻止请求域以阻止对该域的任何请求。 将打开“ 请求阻止”面板,您可以在其中添加或删除其他URL或域:
重新创建Ajax请求 (Recreate Ajax Requests)
Ajax XMLHttpRequest operations can be examined by right-clicking their entry on the Network table, then selecting a copy option such as cURL, fetch, or PowerShell. This creates a command with identical headers, user agent, cookies, and referrers which can be pasted into an editor or terminal.
可以通过右键单击Network表上的条目来检查Ajax XMLHttpRequest操作,然后选择复制选项,例如cURL,fetch或PowerShell。 这将创建具有相同标题,用户代理,Cookie和引荐来源网址的命令,并将其粘贴到编辑器或终端中。
启用脱机文件覆盖 (Enable Offline File Overrides)
Chrome allows any file to be saved to your system so the browser will fetch it from the device rather than the network. This could permit offline development if, for example, you wanted to load or edit assets normally accessed from a CDN.
Chrome允许将任何文件保存到您的系统,因此浏览器将从设备而不是从网络获取文件。 例如,如果您想加载或编辑通常从CDN访问的资产,则可以进行离线开发。
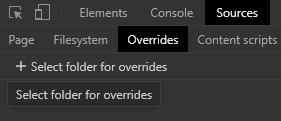
Open the Overrides panel within Sources, click + Select folder for overrides, and select an appropriate folder.
打开Sources中的Overrides面板,单击+选择要替代的文件夹 ,然后选择一个适当的文件夹。
Now right-click any resource in the Network panel and select Save for overrides. Any subsequent page reload will access the file from your local system rather than the web. The saved file can also be modified.
现在,右键单击“ 网络”面板中的任何资源,然后选择“ 保存以覆盖” 。 随后进行的任何页面重新加载都将从您的本地系统而不是Web中访问文件。 保存的文件也可以修改。
检查存储 (Examine Storage)
The Application panel in Chrome and the Storage panel in Firefox allow you to examine, modify and delete values held in cookies, cache storage, localStorage, sessionStorage, IndexedDB, and Web SQL (where supported).
通过Chrome中的“ 应用程序”面板和Firefox中的“ 存储”面板,您可以检查,修改和删除cookie,缓存存储,localStorage,sessionStorage,IndexedDB和Web SQL(如果支持)中保存的值。
Chrome’s Clear storage panel can also wipe all values for a domain which can be useful when developing a Progressive Web App.
Chrome的Clear存储面板还可以擦除域的所有值,这在开发Progressive Web App时很有用。
性能监控器 (Performance Monitor)
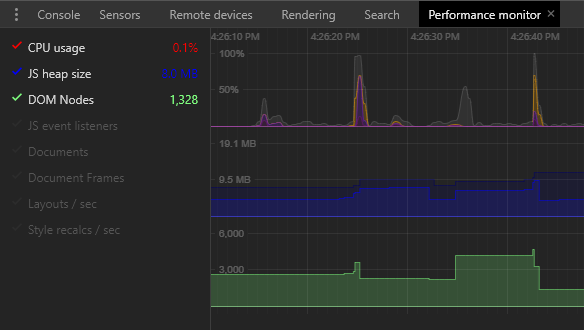
Chrome’s new Performance monitor can be accessed from the DevTools More tools menu and provides analysis of CPU usage, JavaScript heap size, DOM nodes, event listeners, style recalculations and more. Unlike the primary Performance panel, the charts are updated in real time – there is no need to record a profile first.
可以从DevTools 更多工具菜单访问Chrome的新性能监视器 ,该分析器可以分析CPU使用率,JavaScript堆大小,DOM节点,事件监听器,样式重新计算等。 与主要的“ 性能”面板不同,这些图表是实时更新的-无需先记录配置文件。
审核 (Audits)
Chrome’s Audits panel was originally designed to assess Progressive Web App functionality but the tool has evolved into a general purpose tool to analyse performance, accessibility, best practices, and SEO in both mobile and desktop view.
Chrome的“ 审核”面板最初旨在评估Progressive Web App的功能,但该工具已发展成为一种通用工具,可以在移动和台式机视图中分析性能,可访问性,最佳做法和SEO。
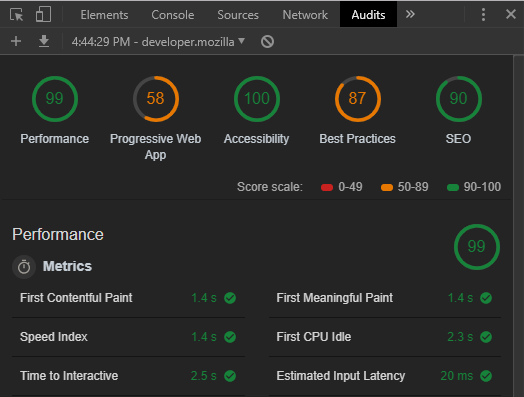
It won’t catch every problem and you may disagree with some points, but it’s a useful way to make a quick assessment of potential issues.
它不会解决所有问题,您可能不同意某些观点,但这是快速评估潜在问题的有用方法。
I hope you discovered something new. More DevTool secrets are coming soon…
我希望你发现了一些新东西。 更多DevTool机密即将推出...
翻译自: https://www.sitepoint.com/browser-devtools-secrets-start-up-network-and-performance/
手机浏览器devtools


 1004
1004


 被折叠的 条评论
为什么被折叠?
被折叠的 条评论
为什么被折叠?
 到【灌水乐园】发言


