


海狸很忙
This article was peer reviewed by Wern Ancheta and Deji Akala. Thanks to all of SitePoint’s peer reviewers for making SitePoint content the best it can be!
本文由Wern Ancheta和Deji Akala进行同行评审。 感谢所有SitePoint的同行评审人员使SitePoint内容达到最佳状态!
Clients with an existing application sometimes ask me to fix bugs, improve efficiency by speeding up the application, or add a new feature to some existing software. The first stage of this is researching the original code – so-called reverse engineering. With SQL databases, it is not always immediately obvious which SQL queries MySQL executed – especially if these queries were generated by a framework or some kind of external library.
拥有现有应用程序的客户有时会要求我修复错误,通过加速应用程序来提高效率或向某些现有软件添加新功能。 第一步是研究原始代码-所谓的逆向工程。 对于SQL数据库,并不总是立即清楚地知道MySQL执行了哪些SQL查询-特别是如果这些查询是由框架或某种外部库生成的 。

In this article, I will talk specifically about MySQL and present a common optimization use case which might come in handy if you run into a similar problem one day.
在本文中,我将专门讨论MySQL,并介绍一个常见的优化用例,如果有一天遇到类似的问题,它可能会派上用场。
MySQL allows you to save all queries into a log.
MySQL允许您将所有查询保存到日志中。
Open MySQL console:
打开MySQL控制台:
mysql --user=USERNAME --password=PASSWORDThis turns on the log:
这将打开日志:
set global general_log = "on";This saves it to a table:
这会将其保存到表中:
set global log_output = "table";To view the logs you’ve saved:
要查看已保存的日志,请执行以下操作:
select * from mysql.general_log;To compress your logs:
压缩日志:
truncate mysql.general_log;However, viewing logs in the MySQL’s console is not as convenient as it could be because:
但是,在MySQL控制台中查看日志并不方便,原因可能是:
- There are no highlighting or formatting options 没有突出显示或格式设置选项
- It’s hard to locate problematic queries among the huge list you get from running parallel processes. 很难从运行并行进程的庞大列表中找到有问题的查询。
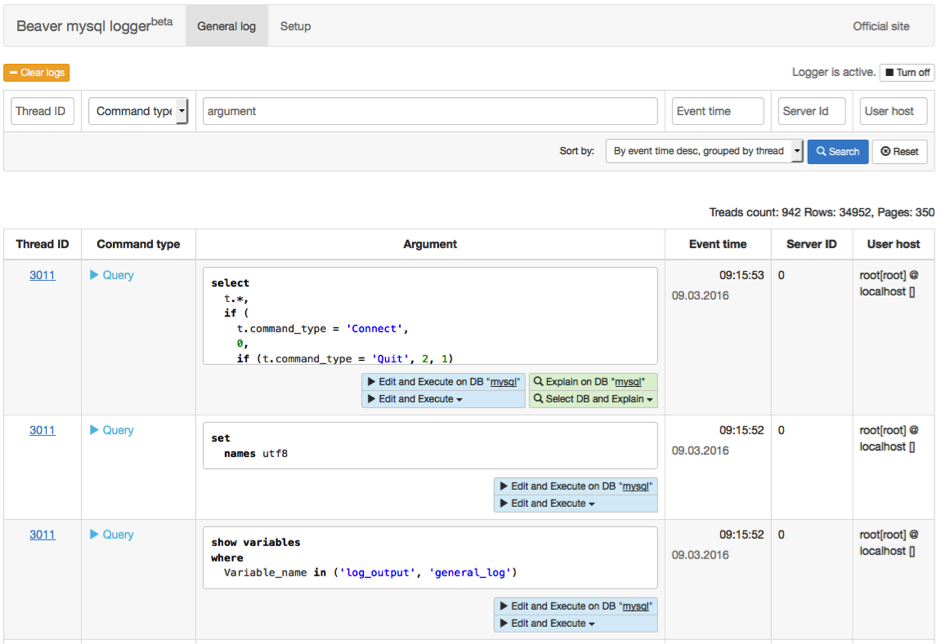
As I often work with logs, I developed a tool called “Beaver MySQL logger” to optimize and make them easier for the user to analyze. With this tool you can:
当我经常使用日志时,我开发了一个名为“ Beaver MySQL logger ”的工具,以进行优化并使其更易于用户分析。 使用此工具,您可以:
- Turn logging on/off 开启/关闭登录
- View logs in a nice interface 在漂亮的界面中查看日志
- Search logs 搜索日志
- “Explain” queries “说明”查询
- Clear logs 清除日志
You can see a screenshot of the program below:
您可以在下面看到该程序的屏幕截图:
客户优化项目示例 (Example of a Client Optimization Project)
I was asked by one of my Upwork clients to help with the optimization of their event listing page which was loading too slowly.
我的一位Upwork客户要求我帮助他们优化事件列表页面,该页面加载速度太慢。
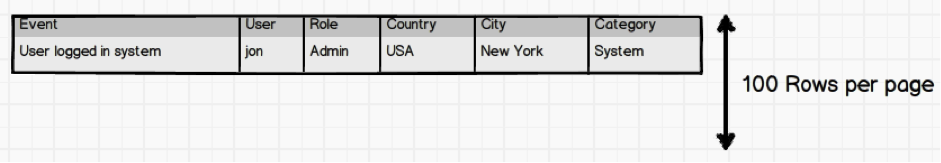
After I turned on the logging, I saw around 680 SQL queries were executing per page load. I found that each query was loading separately leading to 100 events per page and each event was additionally loading like this:
打开日志记录后,我发现每页面加载大约执行680个SQL查询。 我发现每个查询分别加载,导致每页100个事件,并且每个事件都另外加载,如下所示:
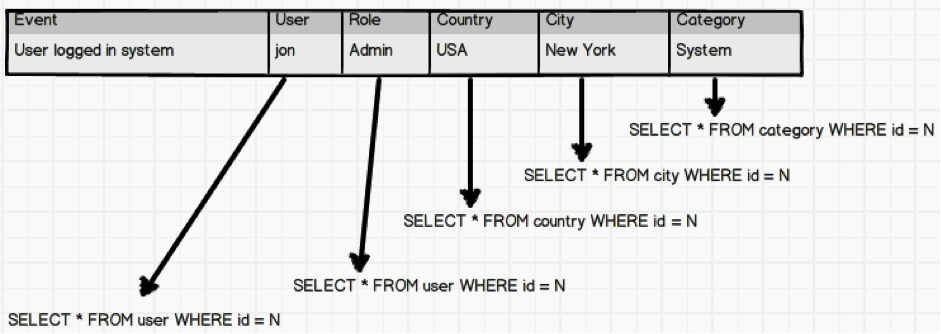
- User 用户
select * from user where id = N- Role 角色
select * from role where id = N- Country 国家
select * from country where id = N- City 市
select * from city where id = N- Category 类别
select * from category where id = N为什么? (Why?)
Why was this happening? The project was using the Yii framework, which meant that the code for data access was using the syntax below:
为什么会这样呢? 该项目使用的是Yii框架,这意味着用于数据访问的代码使用以下语法:
$event->user->name;
$event->country->title;
$event->city->title;
$event->category->name;
$event->role->name;
Where $event is a row in the table.
其中$event是表中的一行。
This means the table had to execute 500 additional queries which reduced efficiency and affected the overall performance.
这意味着该表必须执行500个其他查询,从而降低了效率并影响了整体性能。
如何修复 (How To Fix It)
Combining the necessary values into a single query will reduce the amount of needed server work load:
将必要的值组合到单个查询中将减少所需的服务器工作量:
select
    *
from
    event
    left join user on user.id = event.user_id
    left join country on country.id = event.country_id
    left join city on city.id = event.city_id
    left join category on category.id = event.categroy_id
    left join role on role.id = user.role_id
Since the project was developed with the Yii framework, it may be fixed by using the following enumeration table for the names in the criteria:
由于该项目是使用Yii框架开发的,因此可以通过使用以下枚举表对标准中的名称进行修复:
$criteria = new CDbCriteria([
    'width' => ['user.role', 'country.city', 'category']
]);
Hooray! It will now be running 500 fewer queries per request!
万岁! 现在,每个请求将减少500个查询!
After studying the logs further, I also found that for each menu item in the application the SQL query was made to check each access level like so:
在进一步研究日志之后,我还发现,对于应用程序中的每个菜单项,都进行了SQL查询以检查每个访问级别,如下所示:
select level from acl where role_id = N and page_id = NThis access level check generates around 150 added queries per page load! The easiest way to fix this is to use the cache for the menu widget.
此访问级别检查每个页面加载会生成大约150个添加的查询! 解决此问题的最简单方法是使用菜单小部件的缓存。
结论 (Conclusion)
Before the project, the page took 1100ms to load. After optimization, 130ms.
在项目开始之前,该页面的加载时间为1100毫秒。 经过优化,为130ms。
Logging systems are multi-functional and can also be used to research business trends or find bugs in other systems. By following this simple process, we reduced the number of SQL queries from 650 to 150. While this is a large gain, it’s far from perfect.
日志记录系统是多功能的,还可以用于研究业务趋势或查找其他系统中的错误。 通过执行这个简单的过程,我们将SQL查询的数量从650个减少到150个。虽然这是一个很大的收获,但还远远不够。
A more comprehensive guide to MySQL optimization in general can be found in the following three posts:
一般而言,可以在以下三篇文章中找到有关MySQL优化的更全面的指南:
What are your optimization success stories? Anything you can share? Let us know!
您的优化成功案例是什么? 您有什么可以分享的吗? 让我们知道!
翻译自: https://www.sitepoint.com/beaver-in-action-practical-mysql-optimization/
海狸很忙


 473
473

 被折叠的 条评论
为什么被折叠?
被折叠的 条评论
为什么被折叠?
 到【灌水乐园】发言


