


wordpress响应慢
In this final part of the series on real-time graphs in WordPress, I’m going to get into the nitty-gritty of styling your Flot graphs. I couldn’t stand the idea of handing you an ugly baby! I just didn’t have it in me.
在WordPress实时图形系列的最后一部分中,我将介绍样式化Flot图形的细节。 我忍不住要给你一个丑陋的孩子! 我只是没有它。
So we’re going to look at how to get the most out of the Flot tools and dive into how to get your Flot charts branded and looking exactly like you want them.
因此,我们将研究如何充分利用Flot工具,并深入了解如何为Flot图表打上烙印,并使它们看起来完全像您想要的一样。
Disclaimer: There are a million things different with your WordPress site when compared to mine. You may want to test the look and feel of your Flot charts on a test server, because all it takes is one forgotten semi-colon and the charts will disappear. So start by backing up your system once it works — make some changes — back it up again, etc.
免责声明:与我的WordPress网站相比,您的WordPress网站有100万件事。 您可能想在测试服务器上测试Flot图表的外观,因为它只需要一个被遗忘的分号,图表就会消失。 因此,请在系统正常工作后开始备份-进行一些更改-再次备份等。
With that little admonition plainly stated, let’s get into the fun stuff!
坦白地说,现在我们来研究一下有趣的东西吧!
船坞图书馆 (The Flot Library)
The Flot tools are fairly robust. You can change just about every element of the charts and diagrams. So, if you have a well-defined brand with a specific set of colors and shapes, you’ll be able to get your charts and graphs looking rock solid.
Flot工具相当强大。 您几乎可以更改图表中的每个元素。 因此,如果您拥有定义明确的品牌,并具有一组特定的颜色和形状,则可以使您的图表和图形看起来坚如磐石。
Flot breaks each of the data series up, so each can be individually controlled in terms of colors and shapes. You can change the background color, use gradients, and control where you want the legend to show up, if at all. Even the gridlines themselves can be customized. So, let’s jump into the details of a few of these features so you can see for yourself.
Flot分解了每个数据系列,因此可以根据颜色和形状分别控制每个数据。 您可以更改背景颜色,使用渐变并控制要显示图例的位置(如果有的话)。 甚至网格线本身也可以自定义。 因此,让我们跳入其中一些功能的详细信息,以便您自己查看。
数据系列 (Data Series)
Let’s look at how we can control our pushups data series first, and we’ll build on that. Here is one way to control the way the data series looks:
让我们先看看如何控制俯卧撑数据系列,并以此为基础。 这是一种控制数据序列外观的方法:
- Label: string. Put the label you want for the data series in quotes 标签:字符串。 将数据系列所需的标签放在引号中
Lines: these have several attributes. Start with an open bracket and finish with a close bracket, like CSS.
行:这些具有几个属性。 从一个开放的括号开始,以一个封闭的括号结束,例如CSS。
- show: boolean (true/false) – if you want the lines to show up between the points, set this to true, false if you want to hide the lines show:boolean(true / false)–如果希望线在点之间显示,请将其设置为true,如果要隐藏线则将其设置为false
- lineWidth: number. The number “5” is equal to 5px, as an example. No quotes. lineWidth:数字。 例如,数字“ 5”等于5px。 没有引号。
- fill: boolean (true/false) 填充:布尔值(对/错)
- fillColor: string. Can be hex or RGB or even RGBA. Use quotes: “#f000” fillColor:字符串。 可以是十六进制或RGB甚至RGBA。 使用引号:“#f000”
Points: have several attributes
要点:有几个属性
- Radius: number. The number “5” is equal to 5px, as an example. No quotes. 半径:数字。 例如,数字“ 5”等于5px。 没有引号。
- fill: boolean (true/false) 填充:布尔值(对/错)
- fillColor: string. Can be hex or RGB or even RGBA. Use quotes: “#f000” fillColor:字符串。 可以是十六进制或RGB甚至RGBA。 使用引号:“#f000”
Bars: have several attributes
条形:具有几个属性
barWidth: number. In converted time or pixels. No quotes
barWidth:数字。 以转换的时间或像素为单位。 无引号
- Example 1: Data is by day, so barWidth: 60*60*24*1000. This is because the date is in Unix Timestamp. 示例1:数据是按天计算的,因此barWidth:60 * 60 * 24 * 1000。 这是因为日期在Unix Timestamp中。
- Example 2: Data that is not in date/time format needs to be a number in pixels = barWidth: 5, equals 5px 示例2:非日期/时间格式的数据必须是一个以像素为单位的数字= barWidth:5,等于5px
- align: “left”, “right” or “center”. Relative to the X axis 对齐:“左”,“右”或“中心”。 相对于X轴
- horizontal: boolean (true/false), default is false 水平:布尔值(true / false),默认为false
- fill: boolean (true/false) 填充:布尔值(对/错)
- fillColor: string. Can be hex or RGB or even RGBA. Use quotes: “#f000” fillColor:字符串。 可以是十六进制或RGB甚至RGBA。 使用引号:“#f000”
系列和标签的颜色 (Colors for Series and Labels)
It seemed counter-intuitive at first, but I actually like how Flot assigns color to a series. Instead of defining the color within the lines or bars data, you assign it as part of an options argument that applies to the graph as a whole. What happens is that when you define the color of a series, all connected elements get the same color. In other words, when you give a line a label, the label box automatically gets the same color as well.
乍一看似乎违反直觉,但我实际上喜欢Flot如何为系列分配颜色。 无需在线条或条形数据中定义颜色,而是将其分配为整个应用于图形的options参数的一部分。 发生的情况是,当您定义系列的颜色时,所有连接的元素都会获得相同的颜色。 换句话说,当给行添加标签时,标签框也会自动获得相同的颜色。
If you had three series of data, you would assign them like this:
如果您拥有三个系列的数据,则可以像这样分配它们:
colors: ["#f7941e","#2935A","#15AF5C"]
The colors get buggy when you try to use RGBA, so stick with hex numbers for your colors.
当您尝试使用RGBA时,颜色会变得混乱,因此请坚持使用十六进制数字作为颜色。
网格颜色 (Grid Colors)
The grid is highly customizable. There are nearly two dozen attributes, but here are the ones that most people will want. The documentation lists all of them:
网格是高度可定制的。 有将近两打的属性,但这是大多数人想要的属性。 文档列出了所有这些:
- show: boolean (true/false) 显示:布尔值(true / false)
- color: color. Gridlines. Stick with hex as RGB and RGBA get buggy 颜色:颜色。 网格线。 坚持使用十六进制,因为RGB和RGBA容易出问题
backgroundColor: color/gradient. Gradients are defined by multiple colors:
backgroundColor:颜色/渐变。 渐变由多种颜色定义:
- [color1, color2] [color1,color2]
- You can also list the level of opacity (alpha) with a separate group 您还可以使用单独的组列出不透明度(alpha)的级别
图例格式 (Legend Formatting)
I use a CSS doc to define several elements within my Flot charts, and the legend is one that is absolutely necessary to do so. In your CSS document (layout.css in my resources), make sure you include the following
我使用CSS文档在Flot图表中定义了几个元素,图例是绝对必要的。 在CSS文档(我的资源中为layout.css)中,确保包括以下内容
.legend table {width: auto;}This will make sure all your other formatting works. It’s a bug in Flot and this is the simple fix.
这将确保您所有其他格式均可用。 这是Flot中的错误,这是简单的解决方法。
You have about 20 options you can tweak with the legend, but the biggest thing to observe here is that the format is different for legends. There’s only the open and close brackets, but each attribute is only separated by commas:
您可以调整图例约20个,但这里要注意的最大事情是图例的格式不同。 只有左括号和右括号,但是每个属性仅由逗号分隔:
- show: boolean (true/false) 显示:布尔值(true / false)
- labelBoxBorderColor: color. Stick with hex colors. labelBoxBorderColor:颜色。 坚持使用十六进制颜色。
- position: ‘ne’ or ‘nw’ or ‘se’ or ‘sw’. Make sure to include the quotes. 位置:“ ne”或“ nw”或“ se”或“ sw”。 确保包括引号。
- margin: number of pixels 边距:像素数
- backgroundColor: null or color. Null means it autodetects. backgroundColor:null或颜色。 空意味着它会自动检测。
- backgroundOpacity: number between 0 and 1. Default is .85. backgroundOpacity:介于0和1之间的数字。默认值为.85。
A sample would look like this:
示例如下:
[sourcecode language=”javascript”]
[源代码语言=“ javascript”]
legend: {
图例:{
show: true, position: ‘nw’, margin: 15,
显示:true,位置:“ nw”,边距:15
}
}
If you’re hardcoding using PHP, you’ll need to escape the single quotes if you’re using the position attribute:
如果您使用PHP进行硬编码,则在使用position属性时,需要转义单引号:
[sourcecode language="php"]
[源代码语言=“ php”]
echo ‘legend: {position: ‘nw’,}’;
echo'legend:{position:'nw',}';
[/sourcecode]
[/源代码]
The legends are buggy in Flot. If you find that you’re code isn’t having an affect, you can go straight into the jquery.flot.js file and do a CTRL+F for “legend”. You’ll see all the default values here. It’s totally a hack, but it gets the job done.
传说是弗洛特的越野车。 如果发现您的代码没有影响,则可以直接进入jquery.flot.js文件,并对“ legend”执行CTRL + F。 您将在此处看到所有默认值。 这完全是一个hack,但是可以完成工作。
样品完成图 (Sample Finished Chart)
Here’s what mine looks like with minimal coding:
这是我的代码最少的样子:
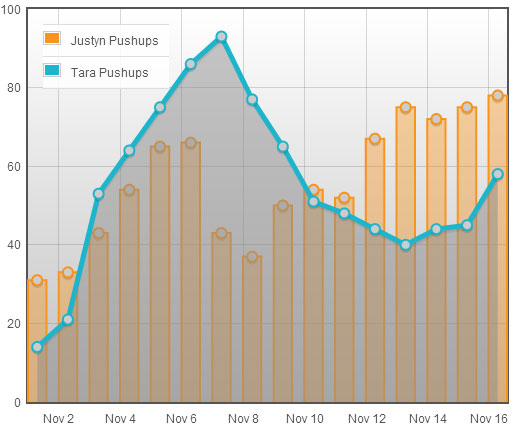
And here’s the JavaScript that you can use for testing purposes:
这是可用于测试目的JavaScript:
[sourcecode language=”javascript”] jQuery(document).ready(function($){ var d1 = [ [1351753200000,31],[1351839600000,33],[1351926000000,43],[1352012400000,54], [1352098800000,65],[1352185200000,66],[1352271600000,43],[1352358000000,37], [1352444400000,50],[1352530800000,54],[1352617200000,52],[1352703600000,67], [1352790000000,75],[1352876400000,72],[1352962800000,75],[1353049200000,78] ]; var d2 = [ [1351753200000,14],[1351839600000,21],[1351926000000,53],[1352012400000,64], [1352098800000,75],[1352185200000,86],[1352271600000,93],[1352358000000,77], [1352444400000,65],[1352530800000,51],[1352617200000,48],[1352703600000,44], [1352790000000,40],[1352876400000,44],[1352962800000,45],[1353049200000,58] ]; var placeholder = $("#placeholder"); var plot = $.plot(placeholder, [ { data: d1, label: "Justyn Pushups", bars: { barWidth: 60*60*24*600, show: true, align: "center", }, points: { show: true, fill: true, fillColor: "#ccc", radius: 5, },
[源代码语言=“ javascript”] jQuery(document).ready(function($){var d1 = [[1351753200000,31],[1351839600000,33],[1351926000000,43],[1352012400000,54],[1352098800000 ,65],[1352185200000,66],[1352271600000,43],[1352358000000,37],[1352444400000,50],[1352530800000,54],[1352617200000,52],[1352703600000,67],[1352790000000,75 ],[1352876400000,72],[1352962800000,75],[1353049200000,78]]; var d2 = [[1351753200000,14],[1351839600000,21],[1351926000000,53],[1352012400000,64],[ 1352098800000,75],[1352185200000,86],[1352271600000,93],[1352358000000,77],[1352444400000,65],[1352530800000,51],[1352617200000,48],[1352703600000,44],[1352790000000, 40],[1352876400000,44],[1352962800000,45],[1353049200000,58]]; var占位符= $(“#placeholder”); var plot = $ .plot(placeholder,[{data:d1,label :“ Justyn Pushups”,条形:{barWidth:60 * 60 * 24 * 600,显示:true,对齐:“ center”,},点数:{show:true,fill:true,fillColor:“#ccc” ;,radius:5,},
}, { data: d2, label: "Tara Pushups", lines: { show: true, fill: true, fillColor: "rgba(141, 141, 141, .5)", lineWidth: 5, }, points: { show: true, fill: true, fillColor: "#ccc", radius: 5, }, } ], { xaxis: { mode: "time" }, colors: ["#f7941e", "#1db5cb"], grid: { backgroundColor: {colors: ["#ffffff","#c0c0c0"]}, colors: ["#666"], }, legend: { show: true, position: ‘nw’, margin: 15, }, }
},{数据:d2,标签:“ Tara Pushups”,行:{显示:true,填充:true,fillColor:“ rgba(141,141,141,.5)”,lineWidth:5,},点:{显示:true,填充:true,fillColor:“#ccc”,半径:5,},}],{xaxis:{mode:“ time” },颜色:[“#f7941e”,“#1db5cb”],网格:{backgroundColor:{颜色:[“#ffffff”,”#c0c0c0&“]},颜色:[“#666”] ,},图例:{显示:true,位置:“ nw”,边距:15,},}
);
);
} );
});
[/sourcecode]
[/源代码]
If using in PHP, just wrap the above code like this:
如果在PHP中使用,只需将上面的代码包装如下:
[sourcecode language=”php”]
[源代码语言=“ php”]
echo ‘
回声
//all the above code here
//以上所有代码
‘;
';
[/sourcecode]
[/源代码]
关键提示: (Critical Tip:)
I recommend making very small changes to layout and formatting. The entire chart will disappear on you with one malformed statement. And, with each attribute often having its own syntax, it’s really easy to break your charts.
我建议对布局和格式进行非常小的更改。 一条格式错误的语句将使整个图表消失在您身上。 而且,由于每个属性通常都有其自己的语法,因此很容易破坏图表。
其他要点 (Other Points)
You have lots of different kinds of graphs and charts available: line, pie, and bar. The Pie charts need their own tutorial because there are lots of ways to use them. The example file included with the documentation is really good for showing how to format pie charts.
您可以使用多种不同的图形和图表:线,饼图和条形图。 饼图需要自己的教程,因为有很多使用它们的方法。 该文档随附的示例文件非常适合显示如何格式化饼图。
The best way to really get in there and learn is to look at the big list of example files included in the documentation. They have just about everything, but it’s hard to follow without this primer.
真正进入那里并学习的最佳方法是查看文档中包含的大量示例文件。 他们几乎拥有一切,但是如果没有这份入门,就很难遵循。
Show off your work! I really want to see lots of big, lovely charts! We have so much data at our disposal and in the past it’s been difficult to display. I hope to see this system take hold as a standard so we can all build on it and create a community around Flot.
炫耀你的作品! 我真的很想看到很多大而可爱的图表! 我们有太多数据可供使用,过去很难显示。 我希望看到该系统成为标准,以便我们都可以在此基础上建立并围绕Flot创建社区。
翻译自: https://www.sitepoint.com/responsive-real-time-graphs-in-wordpress-finishing-touches/
wordpress响应慢


 1699
1699

 被折叠的 条评论
为什么被折叠?
被折叠的 条评论
为什么被折叠?
 到【灌水乐园】发言


