


 本文介绍了如何在Google Docs和Google Slides中插入流程图和图表,包括直接使用Google Drawing工具创建简单流程图,以及通过第三方应用LucidChart创建更专业的图表。此外,还提供了编辑和自定义图表的方法。

流程图中省略的图表怎么表示

Flowcharts and diagrams can help people understand confusing data. If you need one for your Google Docs or Slides file, you can create it without leaving your document. We’ll show you how.
流程图和图表可以帮助人们理解混乱的数据。 如果您需要一个Google文档或幻灯片文件,则无需离开文档即可创建它。 我们将向您展示如何。
在Google文档中插入流程图 (Insert a Flowchart In Google Docs)
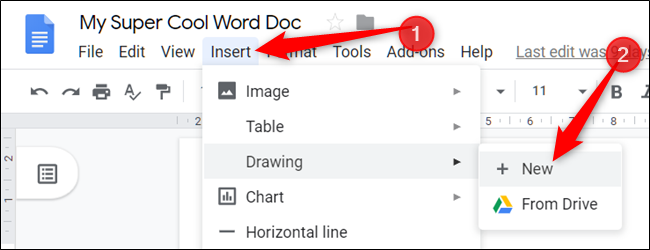
Fire up your browser, open a Docs file, and then click Insert > Drawing > + New.
启动浏览器,打开Docs文件 ,然后单击插入>绘图> +新建。
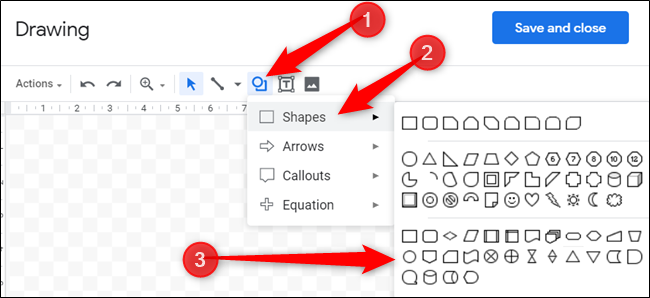
From the Google Drawing window, click the icon that looks like a circle on top of a square. Hover over “Shapes,” and then click the shape you want to use. Note that all the shapes at the bottom of the Shapes selector are for flowcharts.
在Google绘图窗口中,单击在正方形顶部看起来像一个圆圈的图标。 将鼠标悬停在“形状”上,然后单击要使用的形状。 请注意,“形状”选择器底部的所有形状均用于流程图。
Google Drawing is an extremely simple flowchart creator. It relies heavily on your drawing and organizational skills. After you select a shape, drag your mouse cursor to create it on the canvas.
Google绘图是一个非常简单的流程图创建者。 它在很大程度上取决于您的绘图和组织技能。 选择形状后,拖动鼠标光标在画布上创建它。
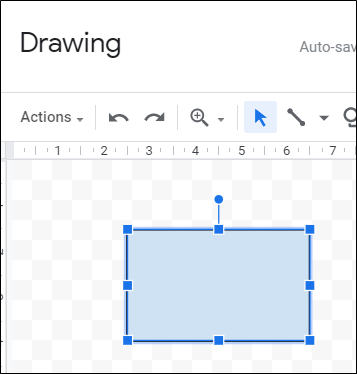
If you need to resize a shape, drag any of the squares that surround it to change it.
如果需要调整形状的大小,请拖动形状周围的任何正方形以进行更改。
You can also use keyboard shortcuts to copy and paste any shape you want to reuse. Press Ctrl+C (Windows/Chrome OS) or Cmd+C (macOS) to copy a shape. To paste a shape, press Ctrl+V (Windows/Chrome OS) or Cmd+V (macOS).
您还可以使用键盘快捷键来复制和粘贴要重复使用的任何形状。 按Ctrl + C(Windows / Chrome OS)或Cmd + C(macOS)复制形状。 要粘贴形状,请按Ctrl + V(Windows / Chrome OS)或Cmd + V(macOS)。
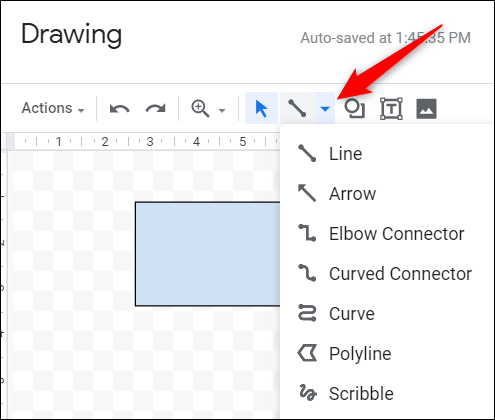
If you want to insert connecting lines between shapes and processes, click the down arrow next to the Line tool.
如果要在形状和过程之间插入连接线,请单击“线”工具旁边的向下箭头。
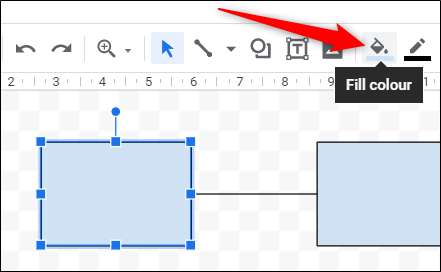
To change the color of a shape, select it, and then click the Fill Color icon.
要更改形状的颜色,请选择它,然后单击“填充颜色”图标。
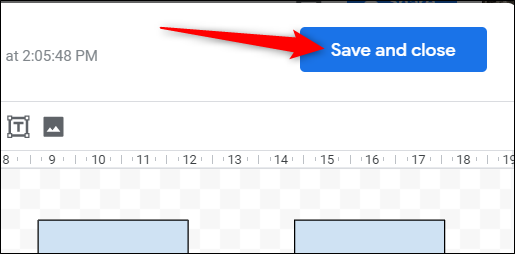
Repeat this process until you’ve inserted all the shapes you need to create a full flowchart. Click “Save and Close” to insert the drawing into your document.
重复此过程,直到您插入了创建完整流程图所需的所有形状为止。 单击“保存并关闭”以将工程图插入文档中。
 ()
()
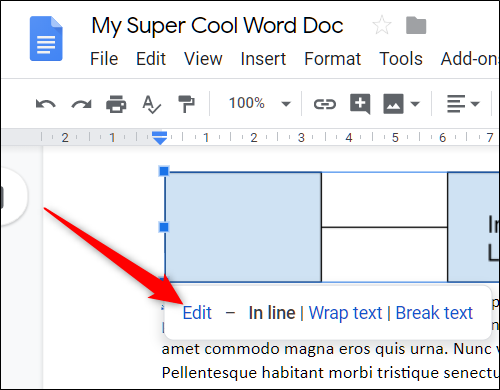
If you need to edit a flowchart after you insert it into a document, select it, and then click “Edit” to reopen it in Google Drawing.
将流程图插入文档后,如果需要编辑流程图,请选择它,然后单击“编辑”以在Google绘图中重新打开它。
在Google幻灯片中插入图表 (Insert a Diagram in Google Slides)
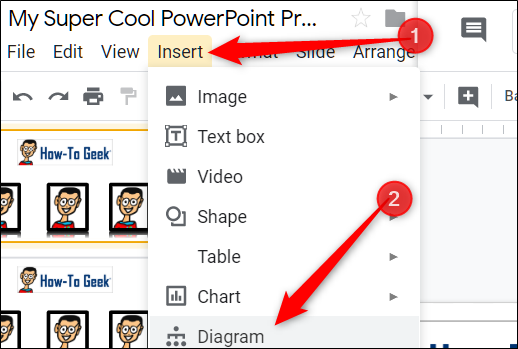
Fire up a Google Slides document and click Insert > Diagram.
启动Google幻灯片文档,然后单击插入>图表。
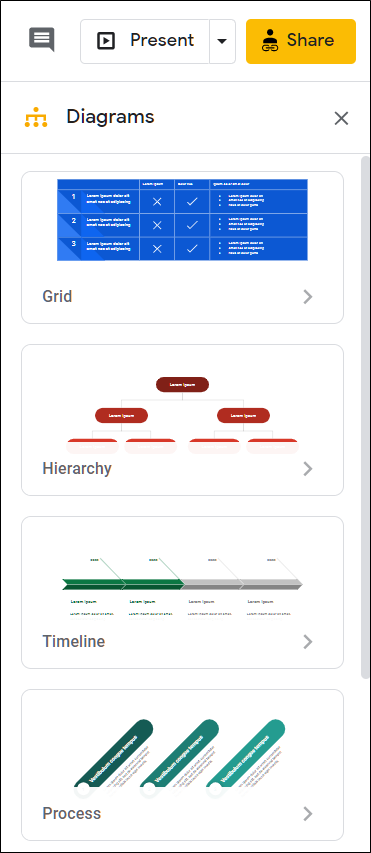
In the panel that opens on the right, choose a grid, hierarchy, timeline, process, relationship, or cycle diagram.
在右侧打开的面板中,选择表格,层次结构,时间线,过程,关系或周期图。
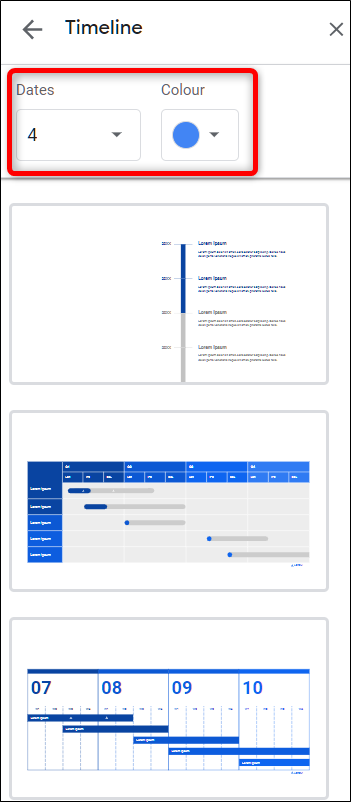
After you select the type of diagram you want, you see several templates. At the top, you can customize the color, and the number of levels, steps, or dates for each diagram. Click a template to insert it into your slide.
选择所需的图类型后,您将看到几个模板。 在顶部,您可以自定义颜色以及每个图的级别,步骤或日期的数量。 单击模板以将其插入幻灯片。
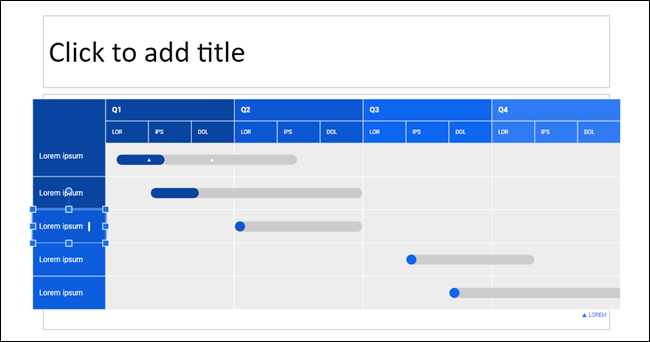
From here, you can click a box and customize or edit it to include your data.
在这里,您可以单击一个框,然后对其进行自定义或编辑以包括您的数据。
使用LucidChart创建流程图和图表 (Create Flowcharts and Diagrams with LucidChart)
If Google Drawing doesn’t do it for you, give the Google Docs add-on LucidChart Diagrams a shot. It’s easy to use and has tons of features that should satisfy anyone who needs a detailed, professional-looking diagram.
如果Google绘图无法满足您的需求,请尝试使用Google Docs附加组件LucidChart Diagrams。 它易于使用,并具有大量功能,可以满足需要详细,专业外观图的任何人的需求。
To use LucidChart, you have to sign up for a free account, which is limited to 60 objects per diagram, and three active diagrams. To get unlimited shapes and diagrams, basic plans start at $4.95 per month.
要使用LucidChart ,您必须注册一个免费帐户,每个帐户限于60个对象和三个活动图。 要获得无限的形状和图表,基本计划的价格为每月4.95美元。
You can use LucidChart for either Docs or Slides, but you have to install it in both.
您可以将LucidChart用于“文档”或“幻灯片”,但必须同时安装两者。
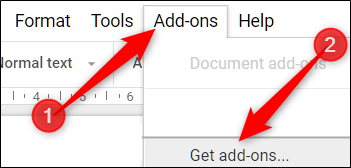
To add LucidChart to your document, open a new or existing file in Google Docs or Sheets, click “Add-ons,” and then click “Get Add-ons.”
要将LucidChart添加到您的文档中,请在Google文档或表格中打开一个新文件或现有文件,单击“加载项”,然后单击“获取加载项”。
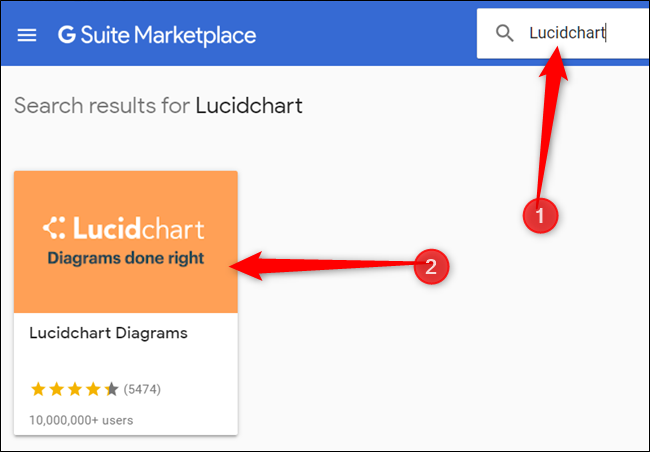
Next, type “LucidChart” in the search bar and hit Enter. Click the LucidChart icon.
接下来,在搜索栏中键入“ LucidChart”,然后按Enter。 单击LucidChart图标。
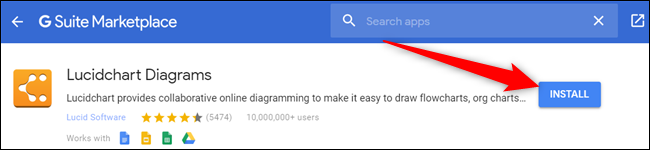
From the add-on’s page, click “Install.”
在加载项页面上,单击“安装”。
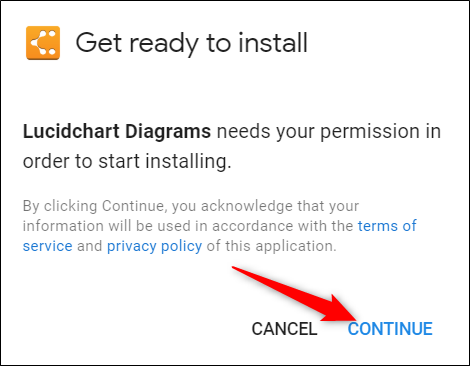
The add-on requires permission to access your document; click “Continue” to grant it.
该加载项需要访问您的文档的权限; 点击“继续”将其授予。
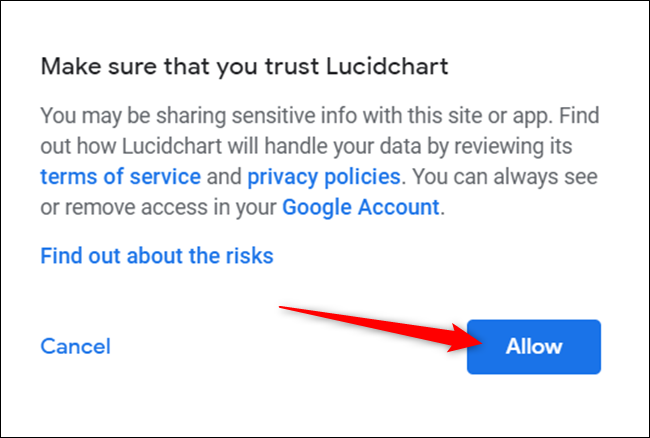
Review the list of permissions LucidChart requires, and then click “Allow.”
查看LucidChart所需的权限列表,然后单击“允许”。
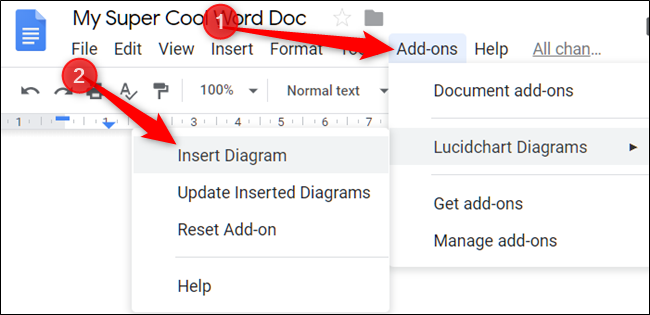
After it’s installed, click Add-ons > LucidChart Diagrams > Insert Diagram.
安装后,单击附件> LucidChart图>插入图。
From the panel that opens on the right, click the orange plus sign (+) icon.
在右侧打开的面板中,单击橙色加号(+)图标。

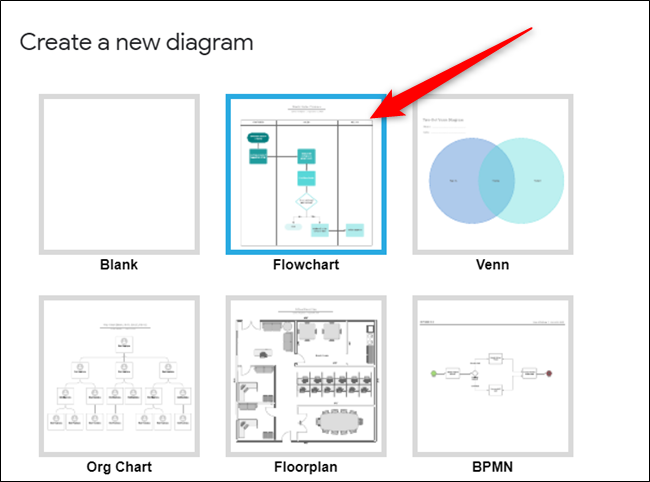
Select a template from the list.
从列表中选择一个模板。
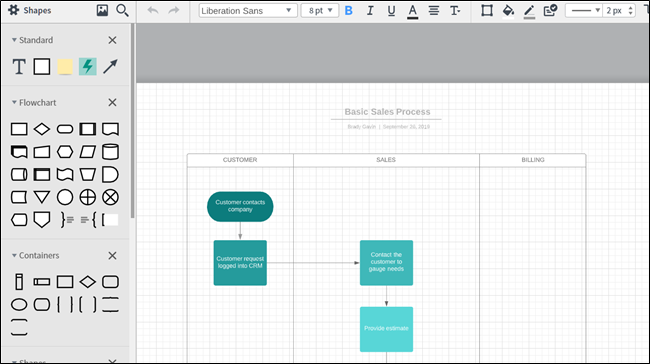
You’re redirected to LucidChart’s website, where you can use the editor to fully customize the chart or diagram you chose.
您将被重定向到LucidChart的网站,在这里您可以使用编辑器完全自定义所选的图表。
The editor is fairly intuitive, full of features, and easy to navigate. Even though you’re limited to 60 shapes per chart on a free account, that’s more than enough.
该编辑器非常直观,功能齐全,并且易于浏览。 即使您在一个免费帐户中每张图表被限制为60个形状,这绰绰有余。
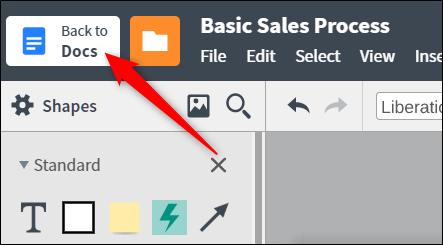
When you’re done with your chart, click “Back to Docs” at the top left of the page.
图表处理完毕后,请点击页面左上方的“返回文档”。
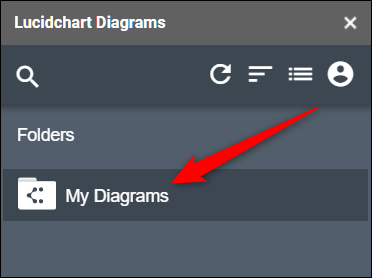
Click “My Diagrams” from the LucidChart add-on in Docs or Sheets.
从“文档”或“表格”中的LucidChart加载项中单击“我的图表”。
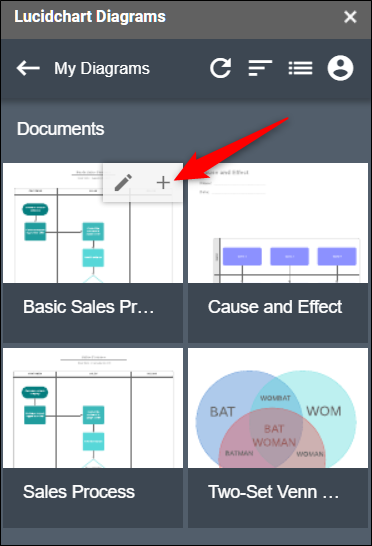
Hover over a diagram, and then click the plus sign (+) to insert it in your document.
将鼠标悬停在图表上,然后单击加号(+)将其插入文档中。
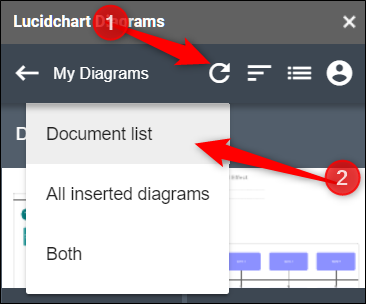
If you don’t see your diagram, click the circular arrow icon, and then click “Document list” to refresh them.
如果看不到图表,请单击圆形箭头图标,然后单击“文档列表”以刷新它们。
Google Drawing and LucidChart Diagrams are both viable options to insert diagrams and flowcharts into your documents.
Google绘图和LucidChart图表都是在文档中插入图表和流程图的可行选择。
However, if you don’t want to draw every process, shape, or line, then LucidChart is the best choice.
但是,如果您不想绘制所有过程,形状或线条,那么LucidChart是最佳选择。
翻译自: https://www.howtogeek.com/442036/how-to-add-flowcharts-and-diagrams-to-google-docs-or-slides/
流程图中省略的图表怎么表示


 12万+
12万+

 被折叠的 条评论
为什么被折叠?
被折叠的 条评论
为什么被折叠?
 到【灌水乐园】发言


