Microsoft released the latest version of the SQL Server Management Studio 17.4 a few weeks back. This release brings in exciting new features and bug fixes to the SSMS IDE for SQL Developers and DBAs. In this article, we will look at a new inbuilt tool for identifying security vulnerabilities in your database. We will also understand the improvements made to the XEvent Profiler and ShowPlan features.
几周前,Microsoft发布了最新版本SQL Server Management Studio 17.4。 此版本为SQL开发人员和DBA带来了SSMS IDE令人兴奋的新功能和错误修复。 在本文中,我们将研究一种新的内置工具,用于识别数据库中的安全漏洞。 我们还将了解对XEvent Profiler和ShowPlan功能所做的改进。
Check out my earlier articles to go through a bunch of SSMS Productivity Features and tips/tricks to increase your coding speed in the SSMS IDE:
查阅我以前的文章,了解一些SSMS生产力功能和提示/技巧,以提高您在SSMS IDE中的编码速度:
- SQL Server Management Studio 2016 Productivity EnhancementsSQL Server Management Studio 2016生产力增强
- 10 SSMS Tips and Tricks to boost your Productivity10个SSMS技巧和窍门可提高您的生产力
- Increase your Coding Speed in SQL Server Management Studio在SQL Server Management Studio中提高编码速度
SSMS is a free independent web installer and is decoupled from the core SQL Server Engine. You can download SQL Server Management Studio (SSMS) version 17.4 and check the release notes here
SSMS是一个免费的独立Web安装程序,并且与核心SQL Server Engine分离。 您可以下载SQL Server Management Studio(SSMS)版本17.4,并在此处查看发行说明。
SQL漏洞评估 (SQL Vulnerability Assessment)
Databases hold most of the sensitive data and are susceptible to security threats and attacks. With data frauds and cyber attacks on a rise, it is essential that you safeguard your data by implementing resilient security features. Microsoft has been committed towards their effort to build more secure products so that their customers are protected.
数据库包含大多数敏感数据,并且容易受到安全威胁和攻击。 随着数据欺诈和网络攻击的增加,至关重要的是,您必须通过实施弹性安全功能来保护数据。 Microsoft一直致力于开发更安全的产品,以保护其客户。
With the release of SQL Server Management Studio 17.4, there is a new inbuilt tool called SQL Vulnerability Assessment that will help SQL Developers/DBAs to scan their database for security vulnerabilities.
随着SQL Server Management Studio 17.4的发布,提供了一个名为SQL Vulnerability Assessment的新内置工具,该工具将帮助SQL Developers / DBA扫描其数据库中的安全漏洞。
This tool will basically run a set of predefined rules to identify potential vulnerabilities and deviations from Microsoft recommended best practices – primarily around permissions, configurations, exposure of sensitive data and more.
该工具将基本上运行一组预定义的规则,以识别潜在的漏洞和与Microsoft建议的最佳实践的偏离-主要围绕权限,配置,敏感数据的公开等等。
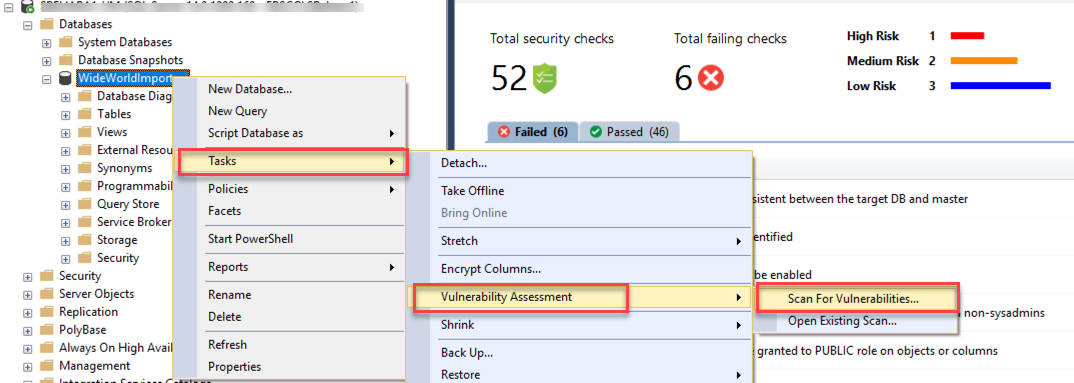
Once you have downloaded and installed SSMS 17.4, you can right click on your database, navigate to Tasks, select Vulnerability Assessment and click on Scan for Vulnerabilities.
下载并安装SSMS 17.4后,可以右键单击数据库,导航到“任务”,选择“漏洞评估”,然后单击“扫描漏洞”。
You can specify the location in your local machine where you want to save the scan results. By default, it stores it in the below path:
您可以在本地计算机上指定要保存扫描结果的位置。 默认情况下,它将其存储在以下路径中:
\\Documents\SQL Server Management Studio\Vulnerability Assessment Reports
\\ Documents \ SQL Server Management Studio \漏洞评估报告
This tool is kind of a static code analysis tool like SQLCop or SonarQube which triggers a set of rules against your codebase to identify anti-patterns. I executed this tool against few of our bigger databases at work, and it took just few seconds to run and generate the report. It ran some simple read-only SQL queries against the database instance without making any changes to either the data or schema.
该工具是一种静态代码分析工具,例如SQLCop或SonarQube ,它会针对您的代码库触发一组规则以识别反模式。 我在工作中的几个大型数据库上执行了此工具,而运行和生成报告只花了几秒钟。 它针对数据库实例运行了一些简单的只读SQL查询,而没有对数据或架构进行任何更改。
Once the scan is complete, the report is promptly displayed in the SSMS tab in a dashboard format.
扫描完成后,报告将以仪表板格式立即显示在SSMS选项卡中。
It shows the current security state of your database, the number of rules executed, details of the success/failed checks, issue details, and remediation steps.
它显示了数据库的当前安全状态,已执行规则的数量,成功/失败检查的详细信息,问题的详细信息以及补救步骤。
One of the rules which I liked was about following the principle of least privilege when granting permissions to database users – granting the minimum permissions necessary to a user or role to accomplish a given task. I found a lot of outliers to this security rule in my existing databases and went ahead and addressed the concerns.
我喜欢的规则之一是在向数据库用户授予权限时遵循最小特权的原则-为完成给定任务的用户或角色授予必需的最小权限。 我在现有数据库中发现了许多与该安全规则有关的异常情况,然后继续解决了这些问题。
Another cool feature about this tool is that you can customize the ruleset based on different databases by approving the selected rules as a baseline. Keep in mind that these are set of Microsoft recommended security rules and at this point, there is no provision to create your personalized new rules – especially because it is around database security. I did not notice any performance issue while running this assessment.
此工具的另一个很酷的功能是,您可以通过批准选定的规则作为基准,基于不同的数据库来自定义规则集。 请记住,这些都是Microsoft推荐的安全规则集,目前,尚无创建个性化新规则的规定-尤其是因为它涉及数据库安全性。 运行此评估时,我没有发现任何性能问题。
This new feature of scanning database for security issues and displaying the current security state in a dashboard format is a great add-on to SSMS.
扫描数据库中的安全问题并以仪表板格式显示当前安全状态的这一新功能是SSMS的一个很好的附加功能。
XEvent Profiler的改进 (Improvements to XEvent Profiler )
With SQL Server Management Studio v17.3, Microsoft introduced a new profiling tool called as ‘XEvent Profiler’ which will allow you to capture trace information from right inside the SSMS IDE. This is supposed to replace SQL profiler – which has been deprecated already. There has been a lot of excitement in the SQL Community about this new tool since it is built on top of Extended Events technology and directly integrated into SSMS.
在SQL Server Management Studio v17.3中,Microsoft引入了一种称为“ XEvent Profiler ”的新分析工具,该工具可让您从SSMS IDE内部捕获跟踪信息。 应该用它代替已经不推荐使用SQL事件探查器。 由于此新工具基于扩展事件技术构建并直接集成到SSMS中,因此在SQL社区中引起了很多兴奋。
In SQL Server Management Studio v17.4, it is encouraging to see that there are further improvements done to the XEvent Profiler.
在SQL Server Management Studio v17.4中,令人鼓舞的是,XEvent Profiler进行了进一步的改进。
XEProfiler has been renamed to XEvent Profiler, which spells out the technology it is built on top of – Extended Events.
XEProfiler已重命名为XEvent Profiler,它阐明了基于扩展事件构建的技术。
You can also search inside the Live Viewer window containing the extended event details. It is as simple as using the shortcut CTRL+F to search for the required search parameter.
您还可以在包含扩展事件详细信息的Live Viewer窗口内搜索。 就像使用快捷键CTRL + F搜索所需的搜索参数一样简单。
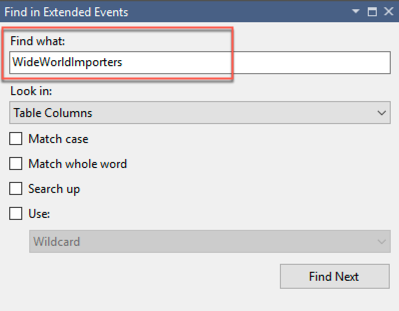
Using the Find Next button you can browse through all the search results for your input string.
使用“查找下一个”按钮,您可以浏览输入字符串的所有搜索结果。
While working with SSMS 17.3, I noticed that when you add additional columns to the Live Viewer such as database_name, it does not display the name of the database in the results pane. It shows it as NULL.
在使用SSMS 17.3时,我注意到当您向Live Viewer添加其他列(例如database_name)时 ,它不会在结果窗格中显示数据库的名称。 它显示为NULL。
I reported this issue to the Microsoft Product Team – Connect 3142981
我向Microsoft产品团队报告了此问题– Connect 3142981
Looking at the release notes of SSMS v17.4, there is a mention of the above Connect Issue item:
查看SSMS v17.4的发行说明,其中提到了上述“连接问题”项:
“Added database_name and client_hostname actions to appropriate events in XEvent Profiler sessions. For the change to take effect, you may need to delete existing QuickSessionStandard or QuickSessionTSQL session instances on the servers – Connect 3142981”
“为XEvent Profiler会话中的适当事件添加了database_name和client_hostname操作。 为了使更改生效,您可能需要删除服务器上现有的QuickSessionStandard或QuickSessionTSQL会话实例– Connect 3142981”
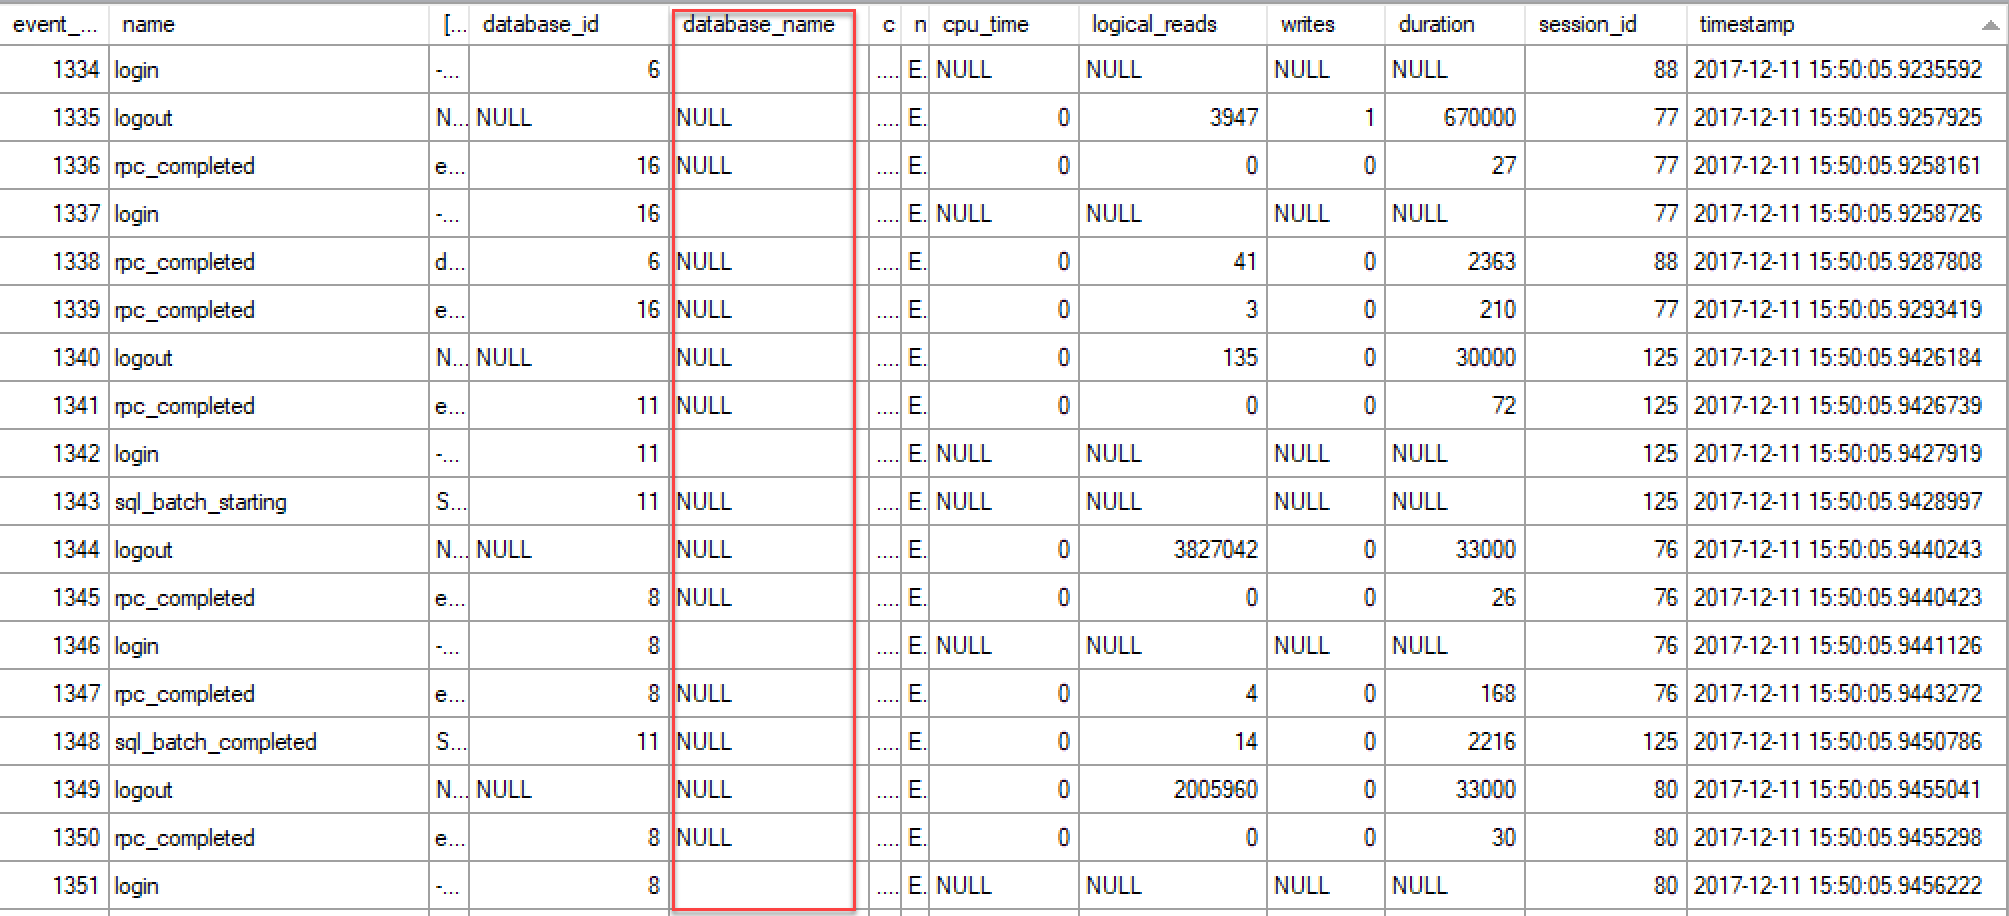
I installed SSMS 17.4 but still see the same issue. Please see below a screenshot of the Live Viewer which has the database_id populated correctly but not database_name.
我安装了SSMS 17.4,但仍然看到相同的问题。 请在下面看到Live Viewer的屏幕截图,其中正确填充了database_id ,但没有正确填充database_name 。
I have reported the issue to the Microsoft Product Team and hopefully it will be addressed soon. If you are facing the same issue, I would request you to up vote the item in Connect site
我已将此问题报告给Microsoft产品团队,希望很快会得到解决。 如果您遇到相同的问题,我将要求您对Connect网站中的项目进行投票
Showplan的改进 (Improvements to Showplan)
There has been a number of improvements done to the Execution Plan window during the recent releases of SQL Server Management Studio
在SQL Server Management Studio的最新版本中,对“执行计划”窗口进行了许多改进。
- compare Showplan feature allows side by side comparison of two execution plans 比较Showplan功能允许并排比较两个执行计划
- ability to increase/decrease the content of the execution plans 增加/减少执行计划内容的能力
- ability to Search in large execution plans 能够搜索大型执行计划
Analyzing a large complex SQL execution plan is challenging. Currently, you might be using different tools to help analyze execution plans, identify expensive operators and fine tune the queries.
分析大型复杂SQL执行计划具有挑战性。 当前,您可能正在使用其他工具来帮助分析执行计划,识别昂贵的操作员并微调查询。
Automating the execution plan analysis makes troubleshooting performance issues so much easier. In an earlier release of SSMS, Microsoft took the first step to automate this process of analyzing complex execution plans and identifying few common scenarios where execution plan may display inaccurate cardinality estimation.
自动化执行计划分析使解决性能问题变得更加容易。 在SSMS的早期版本中,Microsoft迈出了第一步,以自动化此过程来分析复杂的执行计划,并确定执行计划可能显示不准确基数估计的几种常见情况。
In SSMS 17.4, you will have the ability to perform a single plan analysis directly from actual execution plan produced. There is no need to save the. sqlplan file to perform the plan analysis for a particular query.
在SSMS 17.4中,您将能够直接从生成的实际执行计划中执行单个计划分析。 无需保存。 sqlplan文件对特定查询执行计划分析。
Right-click on the execution plan and you will see a new option called as Analyze Actual Execution Plan
右键单击执行计划,您将看到一个名为“ 分析实际执行计划”的新选项。
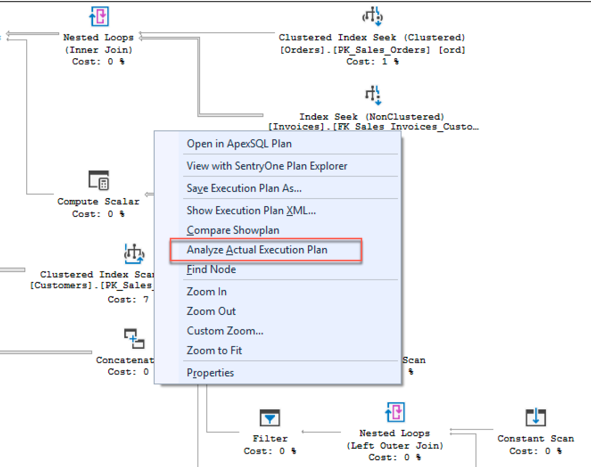
This will open a new panel called Showplan Analysis and will display potential issues present in the plan. For now, this feature identifies queries having Inaccurate Cardinality Estimation. It will display the operators which have a considerable difference between Actual and Estimated rows.
这将打开一个名为Showplan Analysis的新面板,并将显示该计划中存在的潜在问题。 目前,此功能可识别出基数估算值不准确的查询。 它将显示在实际行和估计行之间有相当大差异的运算符。
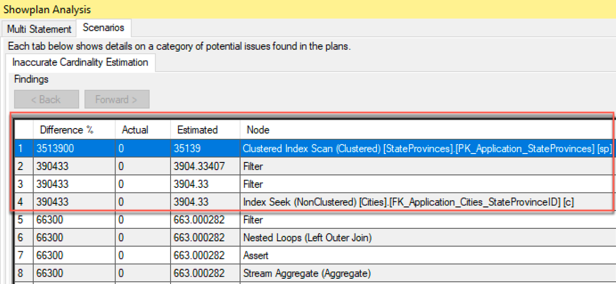
The right-hand side of the panel has a section called as Finding Details and contains information around this discrepancy and recommendations to potentially improve the query performance.
面板的右侧有一个名为“ 查找详细信息”的部分,其中包含有关此差异的信息以及可能改善查询性能的建议。

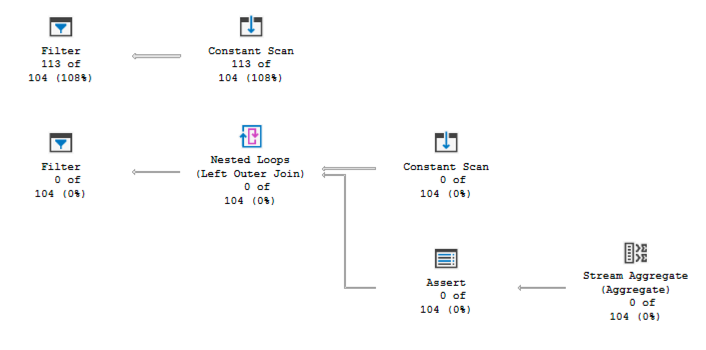
Finally, all the operator icons have been revamped to provide a superior look and feel
最后,所有操作员图标都进行了改进,以提供出色的外观和感觉
结论 (Conclusion)
Data Security and Integrity are critical aspects of an organization. Tools like SQL Vulnerability Assessment are an easy way to make developers/DBAs aware of the best practices for SQL security and take one step forward in making their database more resilient towards database breaches. Microsoft is continuously investing in making developers lives easier within SSMS IDE by improving the diagnostics toolset and integrating new capabilities like XEvent Profiler, Performance Dashboard Reports, Showplan improvements, Import Flat File Wizard and more.
数据安全性和完整性是组织的关键方面。 诸如SQL Vulnerability Assessment之类的工具是使开发人员/ DBA了解SQL安全最佳实践的一种简便方法,并且在使他们的数据库更能抵御数据库漏洞方面迈出了一步。 Microsoft不断投资,通过改进诊断工具集并集成XEvent Profiler,Performance Dashboard Reports,Showplan改进,Import Flat File Wizard等导入新功能,使开发人员在SSMS IDE中更轻松。






 405
405

 被折叠的 条评论
为什么被折叠?


