power bi 背景图
In my last article, Power BI Desktop Interactive chord diagrams, we underscored that Microsoft Power BI desktop has a rich set of customized visualization features. These visualizations can help to produce convert data to information in an efficient manner to an easy to understand format. We can freely download them from Microsoft AppSource
在上一篇文章Power BI Desktop Interactive和弦图中 ,我们强调Microsoft Power BI桌面具有丰富的自定义可视化功能集。 这些可视化有助于以有效的方式将数据转换为信息,并使其易于理解。 我们可以从Microsoft AppSource免费下载它们
In this part of the series, we will explore below points
在本系列的这一部分中,我们将探讨以下几点
- Pulse Chart in Power BI overview Power BI概述中的脉冲图
- Creating Pulse Chart in Power BI 在Power BI中创建脉冲图
- Importing data into Power BI dataset using SQL Server 使用SQL Server将数据导入Power BI数据集中
- Customizeing the Pulse Chart in Power BI 在Power BI中自定义脉冲图
- Examples of to create and learn Chord diagram 创建和学习和弦图的示例
脉搏图 (Pulse Charts)
Normally in the hospital emergency department, we can see that the cardiac monitoring device shows the patient’s heart rate continuously. In those devices, heart rates are being shown in the form of pulse chart. It automatically captures the data, creates a pulse chart and continuously moves forward.
通常在医院急诊室,我们可以看到心脏监测设备连续显示患者的心律。 在这些设备中,心率以脉搏图的形式显示。 它会自动捕获数据,创建一个脉搏图并不断向前移动。
Power BI also provides the option to create a Pulse chart. A pulse chart draws the events based on the time series. It allows customizing the chart as well. We can play, pause, move forward, backward in the chart. We can also observe the playback of the complete chart so that we can observe the trend directly.
Power BI还提供了创建脉冲图的选项。 脉冲图根据时间序列绘制事件。 它也允许自定义图表。 我们可以在图表中播放,暂停,前进,后退。 我们还可以观察完整图表的回放,以便我们可以直接观察趋势。
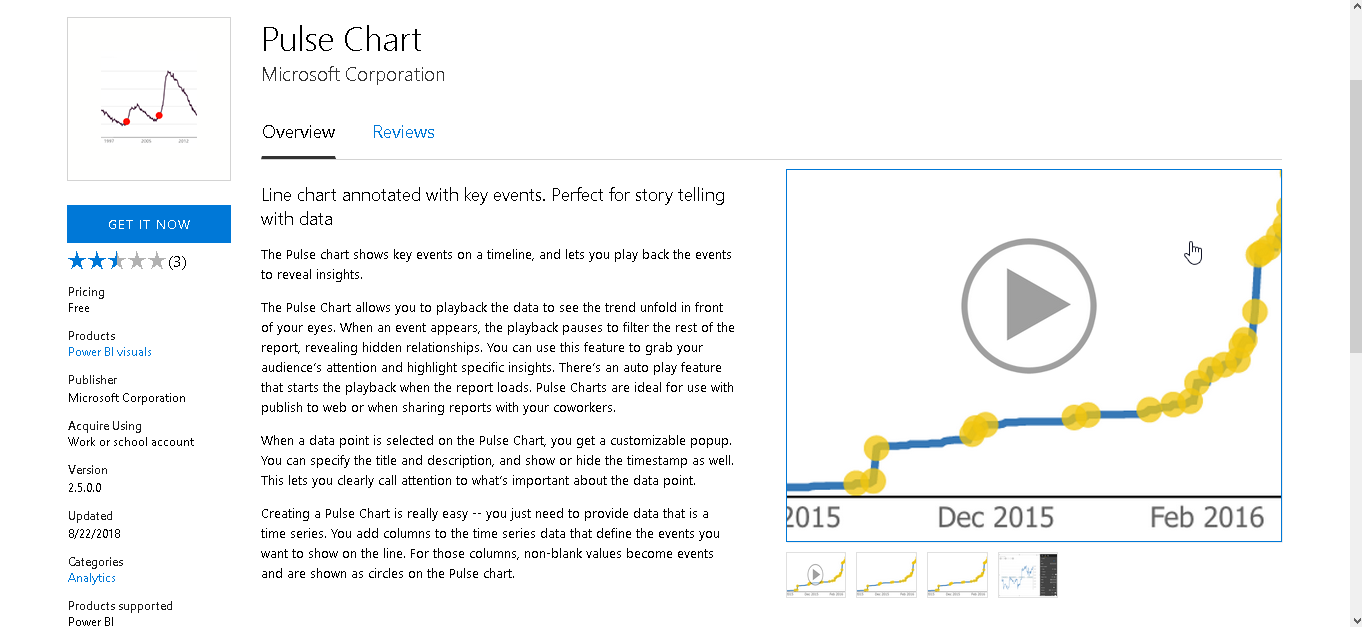
We can open the link Pulse Chart as shown below and download the Pulse chart to import in Microsoft Power BI Desktop.
我们可以打开如下所示的“ 脉冲图 ”链接,然后下载脉冲图以导入到Microsoft Power BI Desktop中。
使用Power BI Desktop创建脉冲图 (Creating a Pulse Chart with Power BI Desktop)
示例1:心率数据的脉搏图 (Example 1: Pulse Chart for Heart rate data)
To create the pulse chart, I have the below data into my database that shows the body temperature and heart rate data of a patient with the timelines.
为了创建脉搏图,我将以下数据存入数据库,该数据显示了具有时间表的患者的体温和心率数据。
We need to import the data into the Microsoft Power BI desktop. In my last article, I explained that we could import the data into Power BI Desktop through various methods. We imported the data from CSV in my last example. In this example, we are going to import data from SQL Server Database.
我们需要将数据导入Microsoft Power BI桌面。 在上一篇文章中,我解释了我们可以通过多种方法将数据导入Power BI Desktop。 在上一个示例中,我们从CSV导入了数据。 在此示例中,我们将从SQL Server数据库中导入数据。
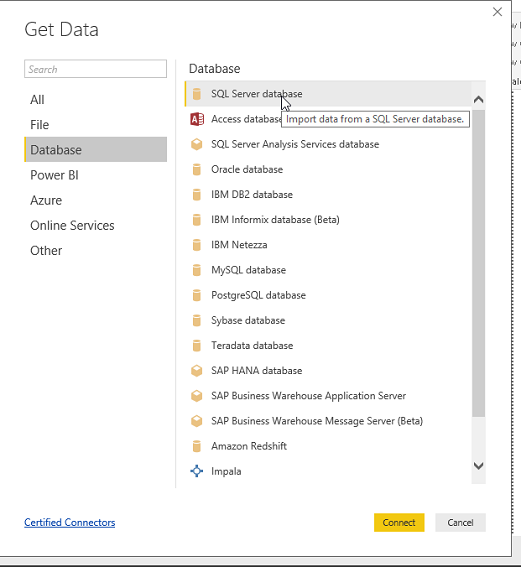
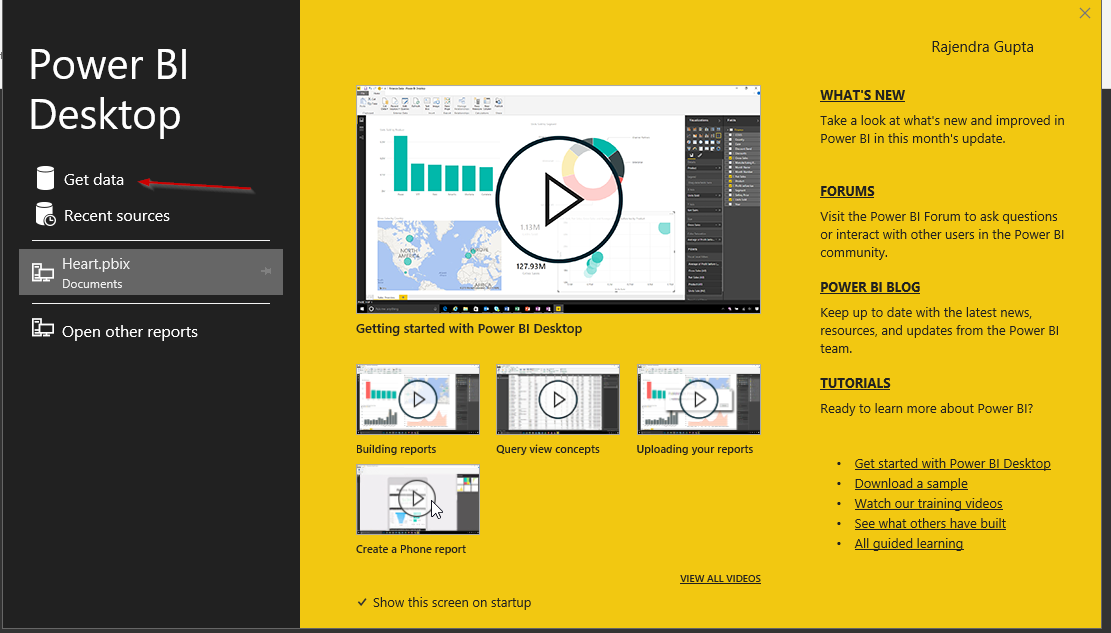
Click on Get data and select SQL Server Database.
单击获取数据,然后选择SQL Server数据库。

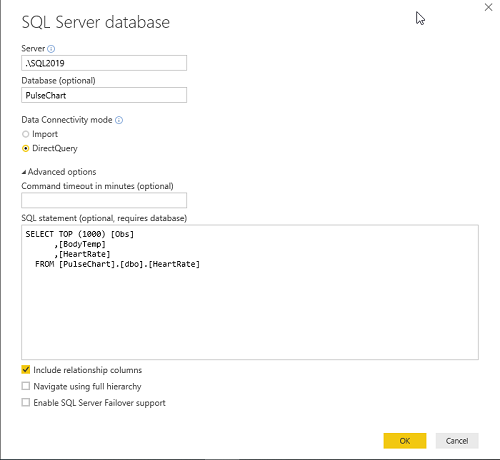
Now provide the below details to connect to the database.
现在提供以下详细信息以连接到数据库。
- Server\Instance name 服务器\实例名称
- Database Name (Optional) 数据库名称(可选)
- Data Connectivity Mode 数据连接模式
- Import: If we directly want to import the data from a single table 导入:如果我们直接想从单个表中导入数据
- DirectQuery: we can use this to import data through the query DirectQuery:我们可以使用它通过查询导入数据
Click on Ok that asks for additional connection information.
单击确定 ,询问其他连接信息。

Select the authentication method. If we want to use windows authentication, select ‘Use my current credentials’.
选择身份验证方法。 如果我们要使用Windows身份验证,请选择“使用我的当前凭据”。
Else click


 本文介绍了如何在Power BI Desktop中创建和自定义脉冲图,这种图表常用于展示时间序列数据,如心率和人口就业数据。通过导入数据,如从SQL Server,可以将数据可视化为易于理解的脉冲图,并能进行播放、暂停和定制图表标题、时间序列等。


 最低0.47元/天 解锁文章


 2618
2618


 被折叠的 条评论
为什么被折叠?


