


In the previous articles of this series (see the index at bottom), we discussed many aspects of the SQL Execution Plans, starting with the main concept of SQL Execution Plan generation, diving in the different types of the plans and showing how to analyze the components and operators of the SQL Execution Plans.
在本系列的前几篇文章中(请参阅底部的索引),我们讨论了SQL执行计划的许多方面,从SQL执行计划生成的主要概念入手,深入探讨了不同类型的计划,并展示了如何分析SQL执行计划的组件和运算符。
In all these articles, we presented the discussions using the default graphical user interface tool for Microsoft SQL Server, SQL Server Management Studio. And as we discussed in the SQL Execution Plan enhancements in SSMS 18.0 article, how Microsoft keeps enhancing the SQL Execution Plan aspect of SSMS. On the other hand, there are number of 3rd party tools that shine in the SQL Server Administration and Development market, that also follow the new releases of the SQL Server Engines and the enhancements in the existing features, to provide database administrators and developers an easy way to display, analyze and tune SQL Execution Plans of the submitted SQL Server queries.
在所有这些文章中,我们使用Microsoft SQL Server的默认图形用户界面工具SQL Server Management Studio进行了讨论。 正如我们在SSMS 18.0中的SQL执行计划增强功能中讨论的那样,Microsoft如何不断增强SSMSSQL执行计划方面。 在另一方面,也有第三方工具,闪耀在SQL Server管理和发展的市场,这也遵循了SQL Server引擎在现有功能的新版本和增强功能,提供数据库管理员和开发人员的数量显示,分析和调整已提交SQL Server查询SQL执行计划的简便方法。
In this article, we will go through one of those 3rd party tool, ApexSQL Plan, a free SQL execution plan viewer, that helps in opening, viewing, optimizing, exploring and analyzing SQL execution plans. What makes beneficial, in addition to being free, is that, it helps identifying the different query performance issues, analyzing the query waits and live performance statistics, displaying the actual relative cost of each plan operator, profiling the stored procedures performance, generating lazy profiling reports and comparing the estimated and actual query execution plans. And all these features are visualized using a customizable graphical query execution plan view.
在这篇文章中,我们将通过这些第三方工具之一,ApexSQL计划,一个免费SQL执行计划查看器,帮助中打开,查看,优化,探索和分析SQL执行计划。 除了免费之外,有益的是,它有助于识别不同的查询性能问题,分析查询等待和实时性能统计数据,显示每个计划操作员的实际相对成本,对存储过程的性能进行性能分析,生成延迟性能分析报告并比较估计和实际查询执行计划。 所有这些功能都使用可自定义的图形查询执行计划视图进行可视化。
In order to use ApexSQL Plan, you need first to download it from the ApexSQL Download page. The installation file for ApexSQL Plan is a small file, less than 40 MB size, as shown below:
为了使用ApexSQL Plan,您需要首先从ApexSQL下载页面下载它。 ApexSQL Plan的安装文件是一个小文件,小于40 MB,如下所示:
ApexSQL Plan can be installed to your machine or server, by easily running the installation file and going through the simple installation wizard, that starts with the Welcome page shown below:
通过轻松运行安装文件并通过简单的安装向导(可从以下所示的“欢迎”页面开始),可以将ApexSQL Plan安装到您的计算机或服务器上:
Check the End User License Agreement points then click on the Next button to accept the agreement and proceed to the next window, in which you need to specify where to install ApexSQL Plan, with minimum 156 MB free space on that drive, and if you need to create an icon for that tool on your desktop. After specifying the installation path of the ApexSQL Plan click Next:
检查“最终用户许可协议”要点,然后单击“ 下一步”按钮以接受该协议并进入下一个窗口,在该窗口中,您需要指定安装ApexSQL Plan的位置,该驱动器上的最小可用空间为156 MB,以及是否需要在桌面上为该工具创建图标。 指定ApexSQL Plan的安装路径后,单击“ 下一步” :
In the next step, ApexSQL Plan will detect the installed SQL Server Management Studio versions to decide which SSMS version to integrate ApexSQL Plan into. Specify the latest SSMS version to integrate the ApexSQL Plan into then click Install to start the installation, as shown below:
下一步,ApexSQL Plan将检测已安装SQL Server Management Studio版本,以决定将ApexSQL Plan集成到哪个SSMS版本中。 指定最新的SSMS版本以将ApexSQL计划集成到其中,然后单击“ 安装”以开始安装,如下所示:
The ApexSQL Plan installation progress bar is very indicative, showing the current status of the installation operation and which .dll file is being processed now, as shown below:
ApexSQL Plan安装进度条非常具有指示性,显示了安装操作的当前状态以及正在处理的.dll文件,如下所示:
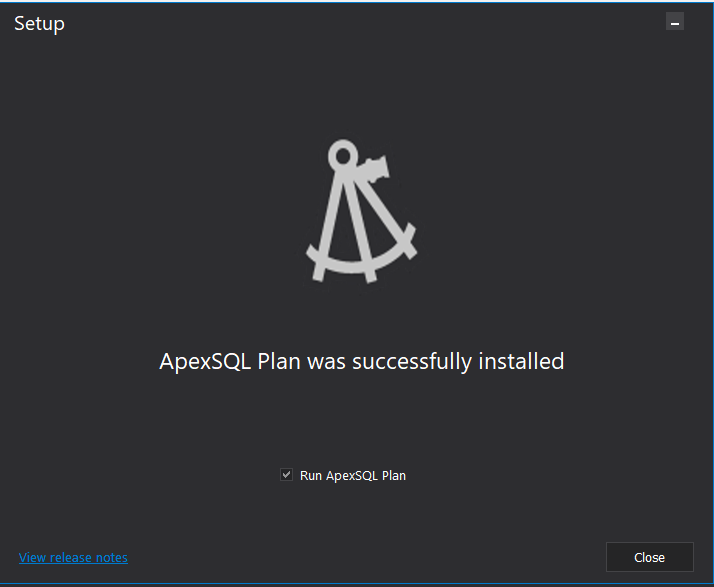
When the installation process completed successfully, you can view the release notes for ApexSQL Plan and click Close to start using ApexSQL Plan, as below:
安装过程成功完成后,您可以查看ApexSQL Plan的发行说明,然后单击“ 关闭”以开始使用ApexSQL Plan,如下所示:
When opening ApexSQL Plan, you will see that it consists of four main menus. The first menu is the Home menu, from which you can start a new Execution Plan session, open an existing one or save the current session for future analysis, and other analytical options as shown below:
打开ApexSQL Plan时,您会看到它包含四个主菜单。 第一个菜单是“ 主页”菜单,从中可以启动新的执行计划会话,打开现有会话或保存当前会话以供将来分析,以及其他分析选项,如下所示:
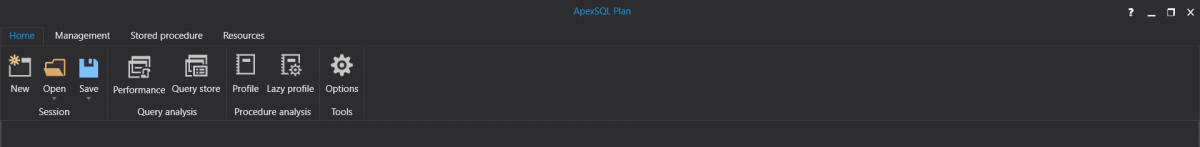
The Options button from the Home menu provides you with the ability to control the layout modes, styles, rotating, colors and theme, controls displaying extra information in the Execution plan, and other exporting options, as shown below:
“主页”菜单中的“ 选项”按钮使您能够控制布局模式,样式,旋转,颜色和主题,控制在执行计划中显示额外信息的控件以及其他导出选项,如下所示:

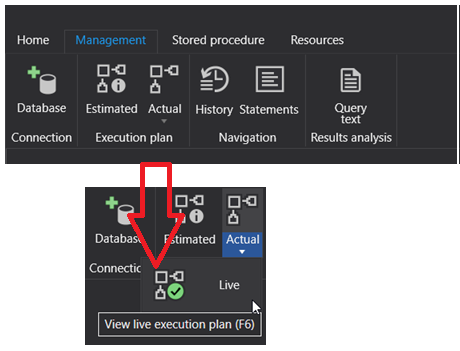
The Management menu is an important menu, from where you can specify the connection parameters to the SQL Server, the type of the Execution Plan to be generated, displaying the query statement and the generated Execution Plans history, as shown below:
管理菜单是一个重要菜单,您可以在其中指定与SQL Server的连接参数,要生成的执行计划的类型,显示查询语句和生成的执行计划历史记录,如下所示:
Browsing the Stored Procedure menu, you will see the different options that will help you in analyzing the parameterized stored procedures, showing the parameters history and the lazy report for that SP, as shown below:
浏览“ 存储过程”菜单时,您将看到不同的选项,这些选项将帮助您分析参数化的存储过程,显示该SP的参数历史记录和惰性报告,如下所示:
The last menu, but not the least, is the Resources menu that helps in contacting the ApexSQL Plan support team in case you face any issue and getting the latest updates for that tool, as shown below:
最后但并非最不重要的菜单是“ 资源”菜单,该菜单有助于在遇到任何问题并获得该工具的最新更新时与ApexSQL Plan支持团队联系,如下所示:
In a simple three steps, let us try to generate full execution plan diagram that can be resized, rescaled for a simple query and check how this wonderful tool can help us analyzing that query:
通过三个简单的步骤,让我们尝试生成完整的执行计划图,该图可以调整大小,调整为一个简单的查询,并检查这个出色的工具如何帮助我们分析该查询:
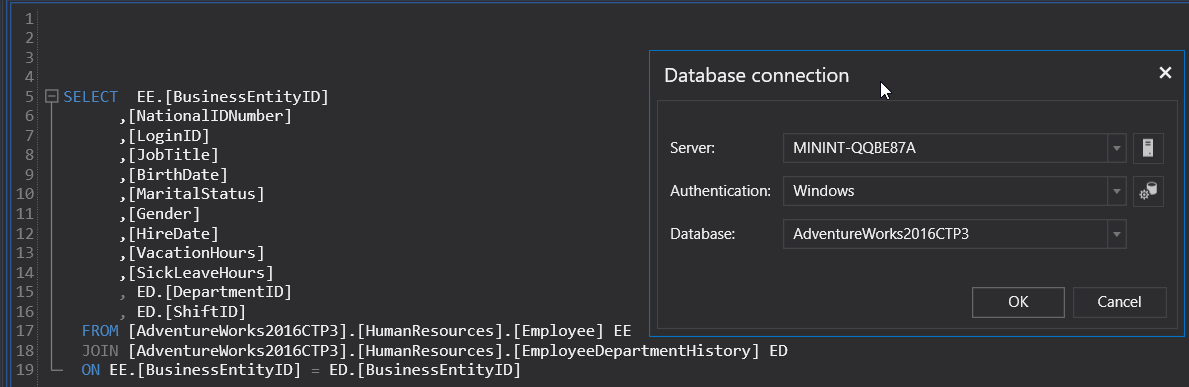
- Home menu, click on the 主菜单中,单击New button and type the query that you manage to analyze 新建按钮,然后键入您要分析的查询
- Management menu, click on the 管理菜单上,单击Database button and specify the SQL Server, the Authentication method and credentials and the database name, as below: 数据库按钮,然后指定SQL Server,身份验证方法和凭据以及数据库名称,如下所示:

And if the SQL Server Engine detects that there is a missing index that can be used to enhance the performance of your query, ApexSQL Plan will display that recommendation and the enhancement percentage of that index creation on your query, with the ability to copy the CREATE INDEX statement or create it directly, as shown below:
而且,如果SQL Server Engine检测到缺少索引可用于增强查询性能,则ApexSQL Plan将在查询中显示该建议和该索引创建的增强百分比,并具有复制CREATE的功能。 INDEX语句或直接创建它,如下所示:
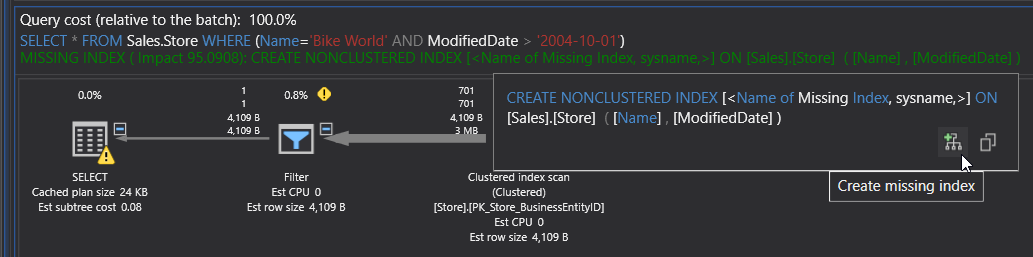
At the top of the generated SQL Execution Plan, you can see the execution statistical information of the submitted query, including the number of returned rows, number of reads performed, the query duration , the CPU cost and other useful information that helps in analyzing the query.
在生成SQL执行计划的顶部,您可以查看提交的查询的执行统计信息,包括返回的行数,执行的读取数,查询持续时间,CPU成本以及其他有助于分析查询。
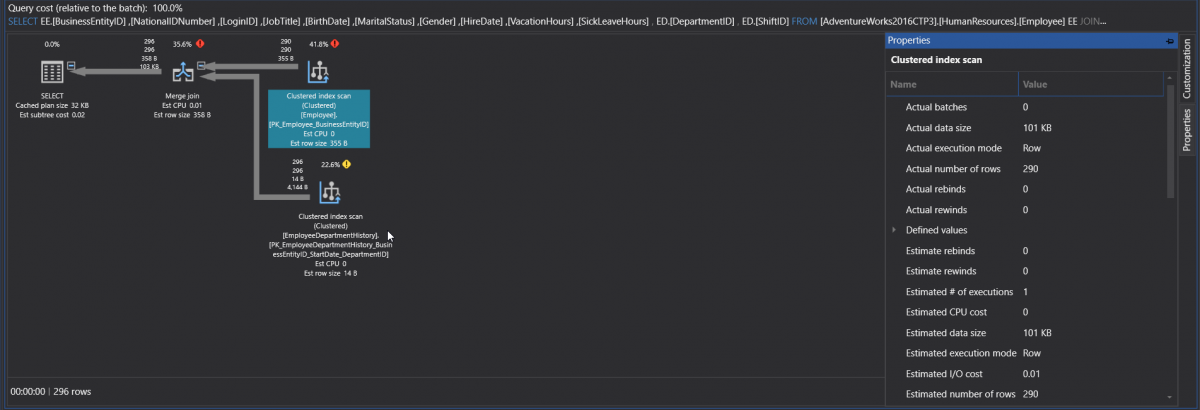
What also makes ApexSQL Plan very useful, is the colorful Execution Plan operators and the useful information shown beside each node and arrow, without the need to dig deeply on each operator tooltip to get a specific information. In addition, if you click on an operator, you can view the Properties window of that operator, that describes the operator execution cost and information as shown clearly below:
使ApexSQL Plan变得非常有用的是丰富多彩的Execution Plan运算符以及在每个节点和箭头旁边显示的有用信息,而无需深入研究每个运算符工具提示即可获得特定信息。 此外,如果单击某个运算符,则可以查看该运算符的“属性”窗口,该窗口描述了该运算符的执行成本和信息,如下所示:
And we cannot ignore the importance of the tooltip that will be displayed when pointing the mouse pointer on any operator or arrow, with the ability to copy the displayed information to the clipboard, as shown below:
而且,我们不能忽略将鼠标指针指向任何操作员或箭头时所显示的工具提示的重要性,并且能够将显示的信息复制到剪贴板,如下所示:
From the previous single operation of the Execution Plan generation, ApexSQL Plan hides any extra statistical information about the query execution. If you click on the I/O reads option from the Management menu, after configuring that tool to show the number of read and the execution result, it will show you a detailed information about the physical and logical I/O operations performed while executing the submitted query, as shown below:
从执行计划生成的先前单个操作中,ApexSQL计划会隐藏有关查询执行的所有其他统计信息。 如果从“ 管理”菜单中单击“ I / O读取”选项,则在将该工具配置为显示读取次数和执行结果之后,它将向您显示有关在执行I / O读取操作时执行的物理和逻辑I / O操作的详细信息。提交查询,如下图:
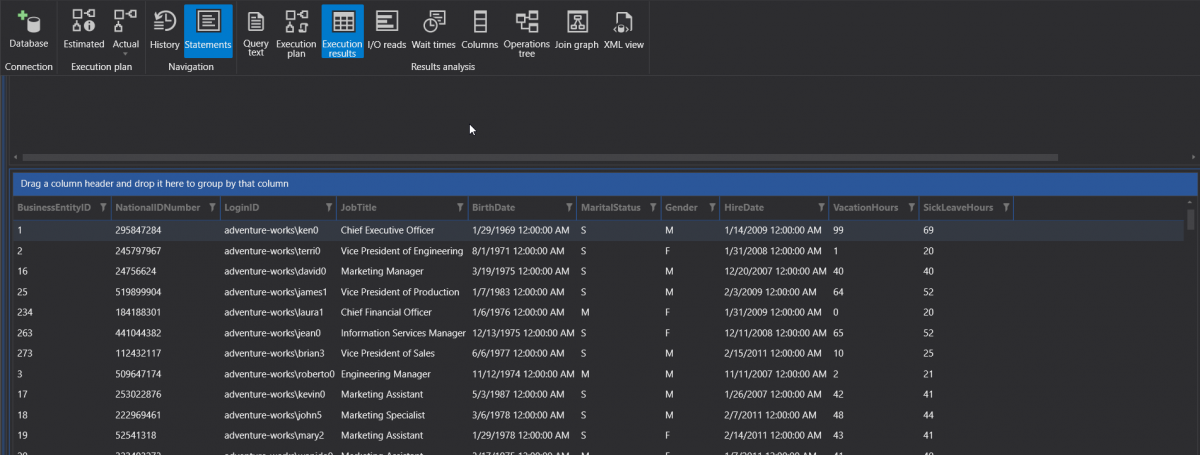
And the query result will be returned in a separate tab, as below:
查询结果将在单独的选项卡中返回,如下所示:
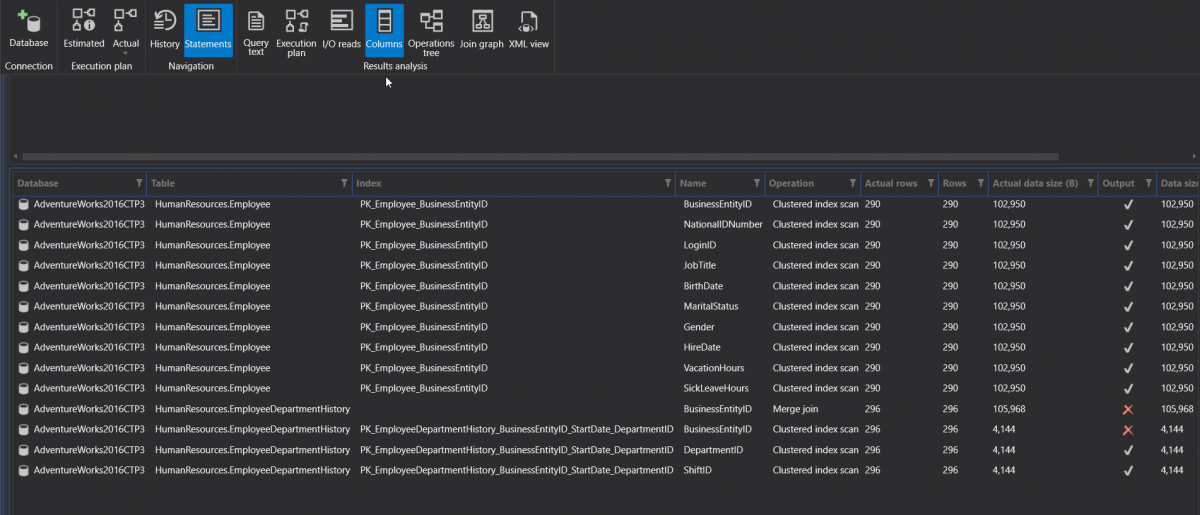
And from the same Management menu, you can see the list and the data size of the columns from each participating table, that the SQL Server Engine touched when executing that query, with the number of the rows and if it is returned by the query or not, by clicking on the Columns option, as shown below:
在同一“ 管理”菜单中,您可以查看每个参与表中SQL Server引擎在执行该查询时所触摸的列表和列的数据大小,行数以及是否由查询返回,或者通过单击“ 列”选项,如下所示:
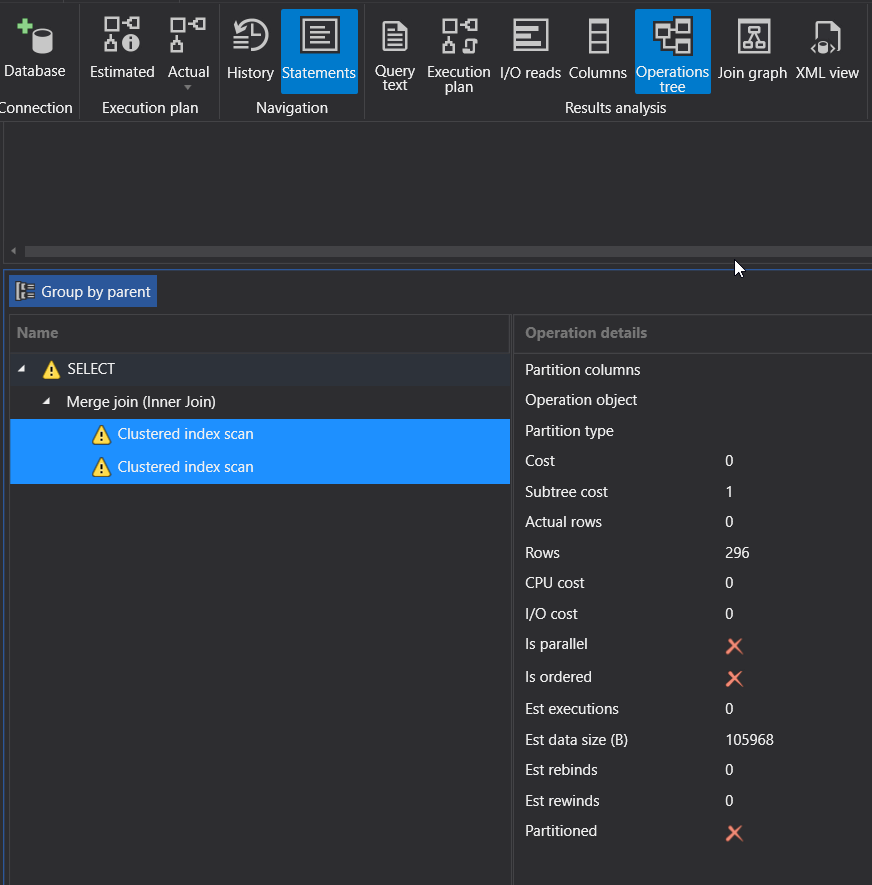
The Operations Tree option from the Management menu, will display the list of operations, such as index scan or seek, that are performed to retrieve the requested data in your query, with all statistical information about that operation, as shown below:
“ 管理”菜单中的“ 操作树”选项将显示用于检索查询中所请求数据的操作列表,如索引扫描或查找,以及有关该操作的所有统计信息,如下所示:
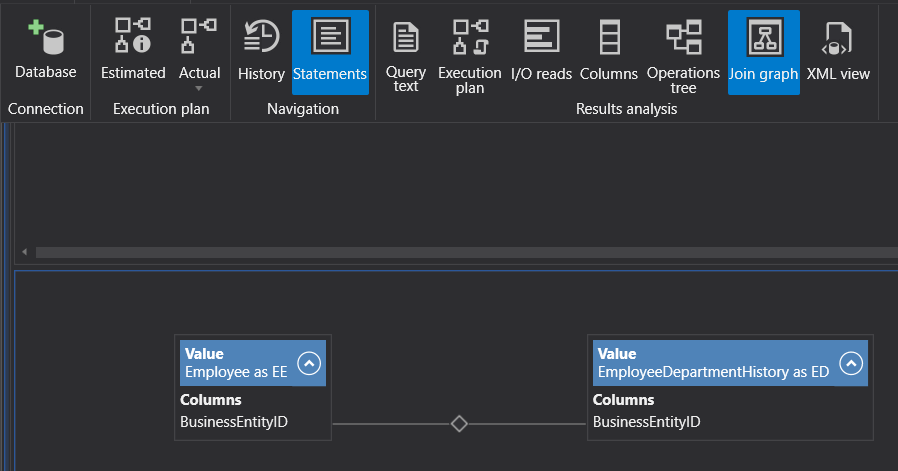
In case your query contains JOIN clause, the Join Graph option from the Management menu will display the graph that describes the JOIN operation between the participating tables, as below:
如果您的查询包含JOIN子句,则“ 管理”菜单中的“ 连接图”选项将显示描述参与表之间的JOIN操作的图,如下所示:
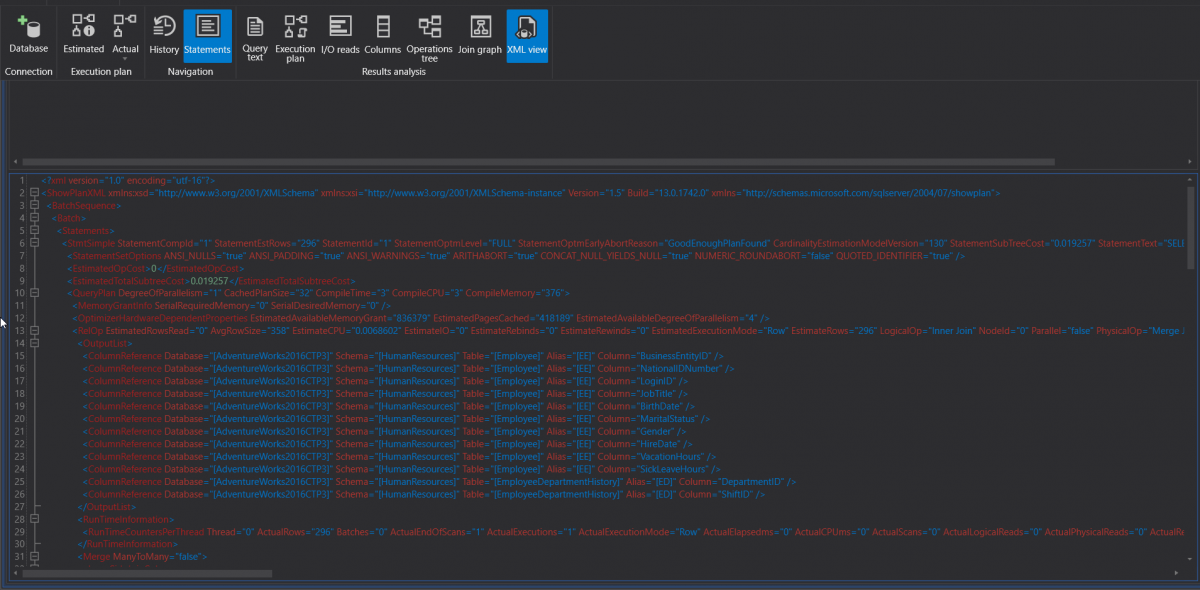
ApexSQL Plan allows you also to display the generated Execution Plan in XML format, using the XML View option from the Management menu, as shown below:
ApexSQL Plan还允许您使用“ 管理”菜单中的“ XML视图”选项以XML格式显示生成的执行计划,如下所示:
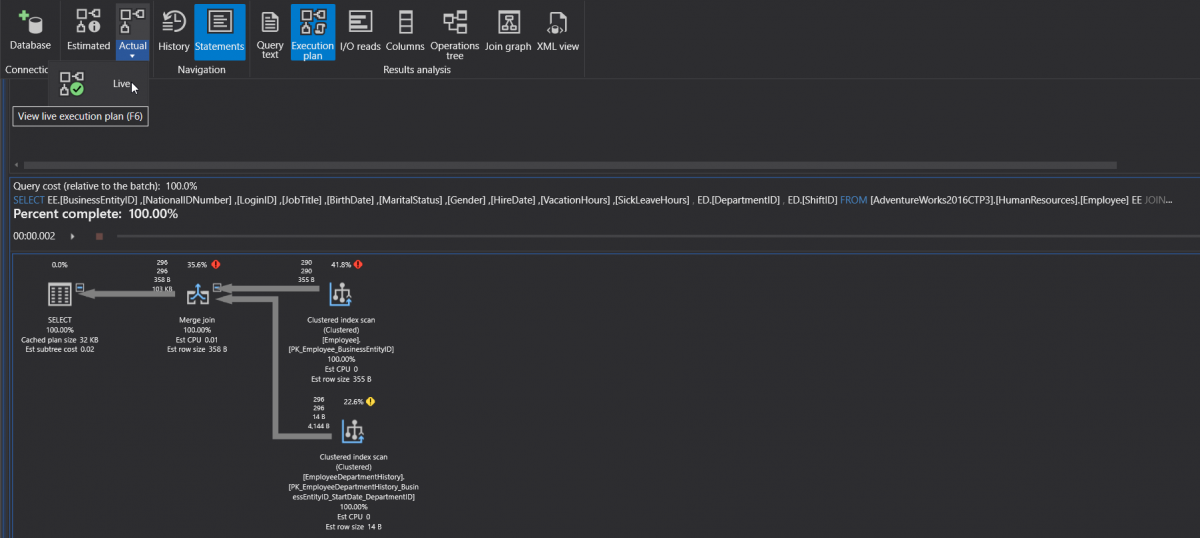
Similar to SQL Server Management Studio, ApexSQL Plan provides you with the ability to generate a Live Actual Execution Plan, to analyze the query execution process in real-time and observe the data flow during execution. If you need to check the same plan again, you need to repeat the plan generation and query execution another time in the case of SSMS. ApexSQL Plan will keep that generated plan for you as a movie, that will be recorded and repeated multiple time, without the need to execute it again, as shown below:
与SQL Server Management Studio相似,ApexSQL计划使您能够生成实时实际执行计划 ,以实时分析查询执行过程并观察执行期间的数据流。 如果需要再次检查同一计划,则对于SSMS,需要重复计划生成并再次查询执行。 ApexSQL Plan将为您保留生成的计划作为电影,该计划将被记录并重复多次,而无需再次执行,如下所示:
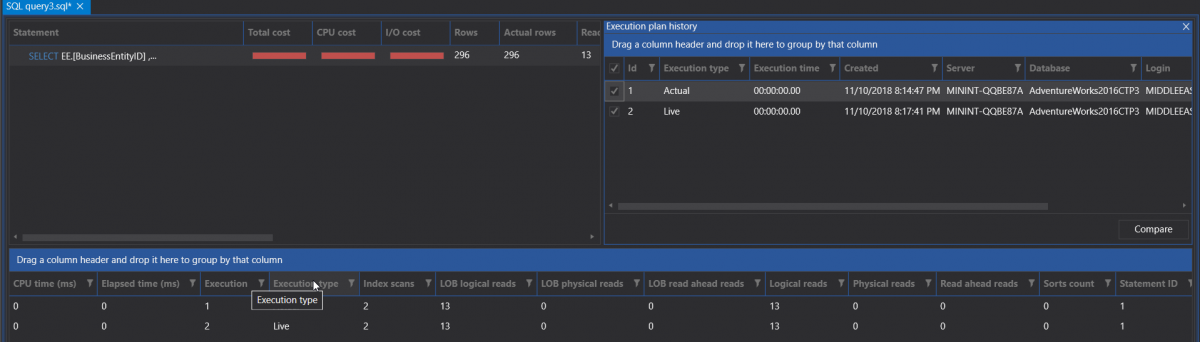
The History option of the Management menu allows you to check the different Execution Plans generated in that session and compare these plans before and after the query optimization, as shown below:
通过“ 管理”菜单的“ 历史记录”选项,您可以检查在该会话中生成的不同执行计划,并在查询优化前后比较这些计划,如下所示:
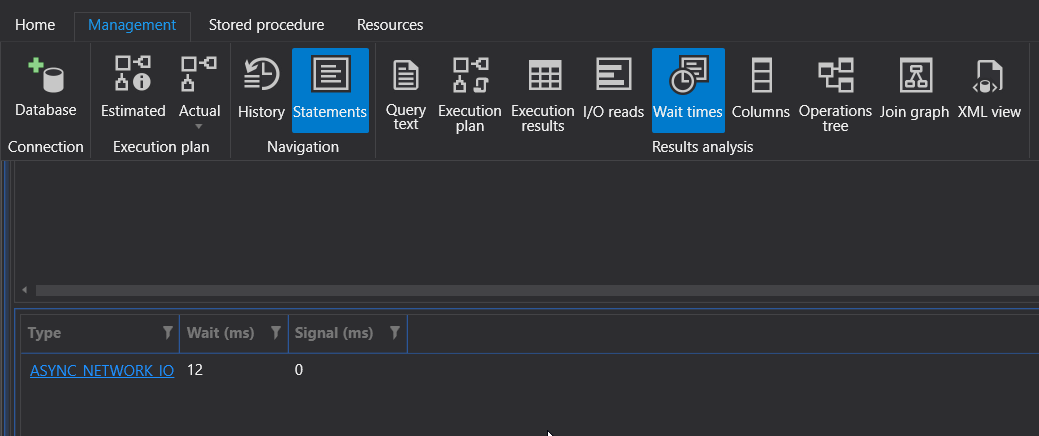
ApexSQL Plan provides you with the main performance monitoring key in SQL Server, that helps analyzing the query performance and identify the execution bottleneck with correct wait and signal time, by showing the list of resources that the submitted query is waiting for, from the Wait Times option of the Management menu, as shown clearly below:
ApexSQL计划可以让你在SQL Server中的主要性能监控的关键,是有助于分析查询性能和正确的等待和信号的时间确定的执行瓶颈,通过展示资源所提交的查询等待,从等待时间列表管理菜单中的选项,如下所示:
In this article, we discussed only sample of the features that are available in ApexSQL Plan. If you install it to your machine, you can discover other useful features, such the Query performance that provides you with the slowest queries recently executed, by defined criteria, including all key details, Open Query Store that helps reviewing the query execution data collected from the Query Store, the Query Store dashboard that helps checking the top queries based on average duration, execution count, executed rows, Deadlock diagrams analysis, Stored procedure profiling information and parameters analysis, and more.
在本文中,我们仅讨论了ApexSQL Plan中可用功能的示例。 如果将其安装到计算机上,则可以发现其他有用的功能,例如查询性能 ,它通过定义的条件(包括所有关键详细信息)为您提供最近执行的最慢查询, 打开查询存储可帮助查看从中收集的查询执行数据查询存储, 查询存储仪表板 ,可根据平均持续时间,执行次数,执行的行, 死锁图分析 , 存储过程分析信息和参数分析等帮助检查最热门的查询。
Still waiting! Go and install it to dive in its useful features. It is free!
还在等! 去安装它以了解其有用的功能。 这是免费的!
目录 (Table of contents)
翻译自: https://www.sqlshack.com/a-new-sql-execution-plan-viewer/


 4003
4003


 被折叠的 条评论
为什么被折叠?
被折叠的 条评论
为什么被折叠?
 到【灌水乐园】发言


