


In this article, we will describe SQL Server Profiler and how it can be used. In addition, we will mention the tools that are integrated with it- plans about its deprecation, and what are the alternatives?
在本文中,我们将介绍SQL Server Profiler及其使用方法。 此外,我们将提到与之集成的工具-有关其弃用的计划,还有哪些替代选择?
介绍 (Introduction)
SQL Server Profiler is a tracing tool provided by Microsoft since SQL Server 2000 version. It is used to trace activities and operations executed on a specific SQL Server database engine or Analysis Service to be analyzed later.
从SQL Server 2000版本开始,SQL Server Profiler是Microsoft提供的跟踪工具。 它用于跟踪在特定SQL Server数据库引擎或Analysis Service上执行的活动和操作,以便稍后进行分析。
SQL Server is responsible for two main operations:
SQL Server负责两个主要操作:
- Tracing: It can monitor all operations executed over an instance 跟踪 :它可以监视在实例上执行的所有操作
- Replay: It can rerun all operations logged in a trace later 重播 :稍后可以重新运行记录在跟踪中的所有操作
Profiler is a standalone tool installed with SQL Server. You can access it from Windows Explorer or SQL Server Management Studio.
Profiler是随SQL Server一起安装的独立工具。 您可以从Windows资源管理器或SQL Server Management Studio访问它。
Under Windows 10, you can write SQL Server Profiler from the Start menu, and the application will show in the results:
在Windows 10下,您可以从“开始”菜单编写SQL Server Profiler,应用程序将显示在结果中:
Figure 1 – Accessing Profiler from the Start menu
图1 –从“开始”菜单访问Profiler
Or you can simply find a shortcut of this tool under the Tools menu inside the SQL Server Management Studio as shown in the image below:
或者,您可以在SQL Server Management Studio内部的“ 工具”菜单下直接找到此工具的快捷方式,如下图所示:
Figure 2 – Accessing SQL Server Profiler from Management Studio
图2 –从Management Studio访问SQL Server Profiler
如何使用Profiler? (How to use Profiler?)
When you open the Profiler, the authentication form is shown. You have to select whether you need to connect to an Analysis Service instance or a Database Engine. Then you should enter the instance name, the authentication type, and the credentials:
当您打开Profiler时,将显示身份验证表单。 您必须选择是需要连接到Analysis Service实例还是数据库引擎。 然后,您应该输入实例名称,身份验证类型和凭据:
Figure 3 – Profiler authentication form
图3 – Profiler身份验证表单
When the connection is established, a new trace form is shown. In this form, there are two tabs: (1) General tab and (2) Events Selection.
建立连接后,将显示一个新的跟踪表单。 在此表单中,有两个选项卡:(1) 常规选项卡和(2) 事件选择 。
In this first tab, you have to enter the trace name. Then you can select whether you need to save the trace results into a table or external file and also if you need to pause the trace at a specific date-time.
在第一个选项卡中,您必须输入跟踪名称。 然后,您可以选择是否需要将跟踪结果保存到表或外部文件中,以及是否需要在特定日期时间暂停跟踪。
Also, you can select a trace template from a drop-down list based on your needs. Note that a template is a set of tuning events that are caught by the profiler trace. There are different predefine templates such as T-SQL, Tuning or you can select the standard (default) template or start from scratch by selecting the Blank template:
另外,您可以根据需要从下拉列表中选择跟踪模板。 请注意,模板是探查器跟踪捕获的一组调整事件。 有不同的预定义模板,例如T-SQL,Tuning,或者您可以选择标准(默认)模板或通过选择Blank模板从头开始:
Figure 4 – General tab of the Trace Properties form
图4 –“跟踪属性”表单的“常规”选项卡
In the Events Selection tab, you can select all events that you need to include in the trace, not that you can add some filters. As an example, if you need only to trace the operations executed in a specific database, then you can add a filter on the database name property. Note that even if you select a template in the General tab, you can edit the event’s selection:
在“事件选择”选项卡中,可以选择需要包括在跟踪中的所有事件,而不是可以添加一些过滤器。 例如,如果只需要跟踪在特定数据库中执行的操作,则可以在数据库名称属性上添加过滤器。 请注意,即使您在“常规”选项卡中选择模板,也可以编辑事件的选择:
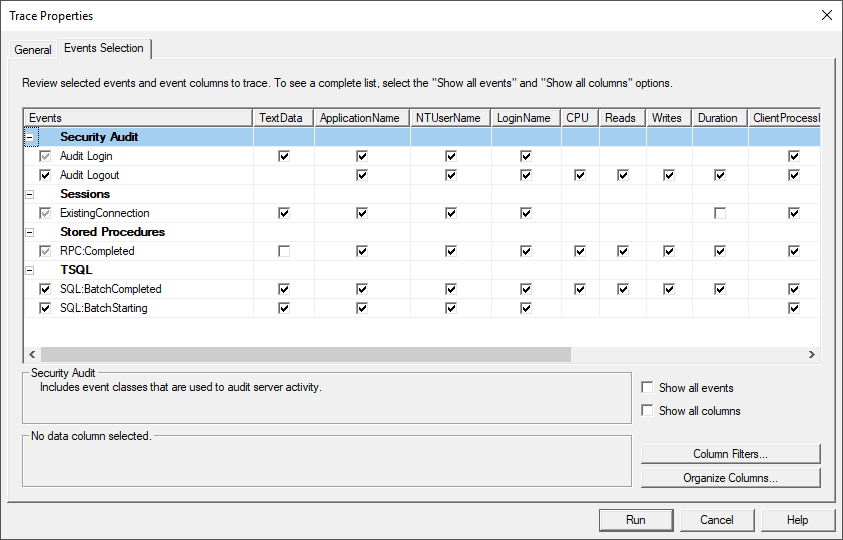
Figure 5 – Events selection tab of the Trace Properties from
图5 –跟踪属性的事件选择选项卡
For more details about creating and running a trace over a specific database, you can refer to a previously published article, where I used SQL Server Profiler to catch the SQL command executed by an SQL Server Integration Services package: SSIS OLE DB Source: SQL Command vs Table or View.
有关在特定数据库上创建和运行跟踪的更多详细信息,请参阅以前发布的文章,其中我使用SQL Server Profiler来捕获由SQL Server Integration Services程序包执行SQL命令: SSIS OLE DB源:SQL Command与表或视图 。
SQL Server Profiler can be used to detect what are the commands executed by an application over a database for security and tuning purposes. To read more about this tool, you can refer to the official documentation.
SQL Server Profiler可用于检测应用程序在数据库上出于安全和调整目的执行的命令。 要了解有关此工具的更多信息,可以参考官方文档 。
数据库引擎优化顾问 (Database Engine Tuning Advisor)
After quickly describing SQL Server Profiler, it is worth mentioning that there is another tool provided by SQL Server that can read and analyze the traces created by the Profiler. This tool is called SQL Server Tuning Advisor. You can access it from SQL Server Management Studio. This tool takes a profiler trace as input. It gives some recommendations (missing indexes, partitioning, etc.) to improve the Database Engine performance based on the operations saved within the trace. To read more about this tool, you can refer to the official documentation: Database Engine Tuning Advisor.
在快速描述了SQL Server Profiler之后,值得一提的是SQL Server提供了另一个工具,该工具可以读取和分析Profiler创建的跟踪。 该工具称为SQL Server Tuning Advisor。 您可以从SQL Server Management Studio访问它。 该工具将探查器跟踪作为输入。 它提供了一些建议(缺少索引,分区等),以基于跟踪中保存的操作来提高数据库引擎的性能。 要了解有关此工具的更多信息,可以参考官方文档: Database Engine Tuning Advisor 。
弃用和替代 (Deprecation and alternatives)
When you access the official documentation, you will see that SQL Server Profiler for Database Engine is deprecated and it might be removed in a future version. Also, they recommended avoiding using this feature anymore. While using this tool to trace Analysis Services, workloads are not deprecated.
当您访问官方文档时 ,您会发现SQL Server Profiler for Database Engine已被弃用,并且在以后的版本中可能会删除它。 此外,他们建议不再使用此功能。 使用此工具跟踪Analysis Services时,不会弃用工作负载。
As we mentioned at the beginning of this article, the Profiler is responsible for two operations: Trace and Replay. After deprecation, Microsoft decided to create a feature for each operation.
正如我们在本文开头所提到的,探查器负责两项操作:跟踪和重放。 弃用后,Microsoft决定为每个操作创建一个功能。
They recommended using Extended Events to create traces over a Database Engine, while they recommended using distributed replay to perform replay operations. While they still recommend using SQL Server Profiler to create traces and to perform replays over Analysis Services instance.
他们建议使用扩展事件在数据库引擎上创建跟踪,而他们建议使用分布式重放来执行重放操作。 他们仍然建议使用SQL Server Profiler创建跟踪并在Analysis Services实例上执行重播。
结论 (Conclusion)
In this article, we have described the old SQL Server tracing tool called Profiler. We mentioned this tool use cases and other SQL Server tools that can integrate with it. Finally, we mentioned the alternatives that can be used after it is deprecated for tracing the Database Engine only.
在本文中,我们描述了称为Profiler的旧SQL Server跟踪工具。 我们提到了此工具的用例以及可以与其集成的其他SQL Server工具。 最后,我们提到了不推荐使用的替代方法,仅可用于跟踪数据库引擎。
In the end, learning this feature is very important since it is effortless and easy to learn. Furthermore, it will get you more familiar with tracing and replay concepts, which makes learning new alternatives easier.
最后,学习此功能非常重要,因为它既轻松又易于学习。 此外,它将使您更加熟悉跟踪和重播概念,这使学习新的替代方法更加容易。
翻译自: https://www.sqlshack.com/an-overview-of-the-sql-server-profiler/


 6725
6725


 被折叠的 条评论
为什么被折叠?
被折叠的 条评论
为什么被折叠?
 到【灌水乐园】发言


