


 本文介绍了SSRS报表构建器的基础知识,演示了一个基本的SSRS报表示例,并详细讲解了如何使用SSRS报表构建器创建、管理和发布报表。通过实际操作,读者将学会创建数据源连接、数据集,设计报表并部署到SQL Server Reporting Services。
ssrs报表教程
The SSRS report builder is a powerful tool for data visualization. In this article, we will take a first step into familiarizing ourselves with the SSRS report builder and we will also demonstrate a very basic SSRS report example. Additionally, we will review the self-service business intelligence approach just because this approach can be implemented through the SSRS report builder very easily.
SSRS报告构建器是用于数据可视化的强大工具。 在本文中,我们将迈出第一步来熟悉SSRS报告构建器,并且还将演示一个非常基本的SSRS报告示例。 此外,我们将回顾自助服务商业智能方法,因为该方法可以非常容易地通过SSRS报告生成器实现。
自助式商务智能 (Self-Service BI)
IT departments get report development request from business departments thousands of times a day. Unfortunately, IT departments have limited developer source and capacity, and it is for this reason that they can’t respond to every BI development request. How can we address this issue?
IT部门每天都会收到数千次来自业务部门的报表开发请求。 不幸的是,IT部门的开发人员来源和能力有限,因此,他们无法响应每个BI开发请求。 我们如何解决这个问题?
- We can hire more developers 我们可以雇用更多开发商
- We can hire freelancers 我们可以聘请自由职业者
- Or we can implement the Self-Service BI approach 或者我们可以实施自助服务BI方法
#C is the right and effective solution for this issue because non-technical persons can learn to develop their own reports and dashboards through prepared datasets. Key stakeholders can gain the ability to develop and create their own reports so that the IT department dependency and waiting time will decrease. To accomplish this, though, report and BI tools must be so easy and understandable by non-technical users.
#C是解决此问题的正确而有效的解决方案,因为非技术人员可以通过准备的数据集学习开发自己的报告和仪表板。 关键利益相关者可以获得开发和创建自己的报告的能力,从而减少IT部门的依赖性和等待时间。 但是,要做到这一点,报表和BI工具必须非常容易,并且非技术用户也可以理解。
The purpose of the Self-Service BI approach is to provide report or dashboard development capability to non-technical users thus, will give more freedom and responsibility. The main question is how we can implement this approach with SQL Server Reporting Services? Microsoft has obviously taken this into consideration because the SSRS report builder is a very simple report design tool and they can be easily learned and used by non-technical staff. At the same time, BI developers can provide key users with shared datasets, to abstract users from learning how to retrieve data from desired data warehouse or relational database. Additionally, SQL Server Reporting Services offers a significant feature which is the My Report Folder. This feature offers a private and personal storage to users so that users can deploy and use their SSRS report in this folder. As a result, Self-Service BI allows non-technical staff to generate report by themselves so that it can decrease the costs which related to business intelligence implementation.
自助服务BI方法的目的是为非技术用户提供报告或仪表板开发功能,从而赋予他们更多的自由和责任感。 主要问题是如何使用SQL Server Reporting Services实施此方法? 微软显然已经考虑了这一点,因为SSRS报表生成器是一个非常简单的报表设计工具,并且非技术人员可以轻松学习和使用。 同时,BI开发人员可以为关键用户提供共享的数据集,以使用户抽象学习如何从所需的数据仓库或关系数据库中检索数据。 此外,SQL Server Reporting Services提供了一项重要功能,即“ 我的报表文件夹”。 此功能为用户提供私有和个人存储,以便用户可以在此文件夹中部署和使用其SSRS报告。 结果,自助服务BI允许非技术人员自己生成报告,从而可以减少与商业智能实施相关的成本。
准备样品数据 (Preparing to sample data)
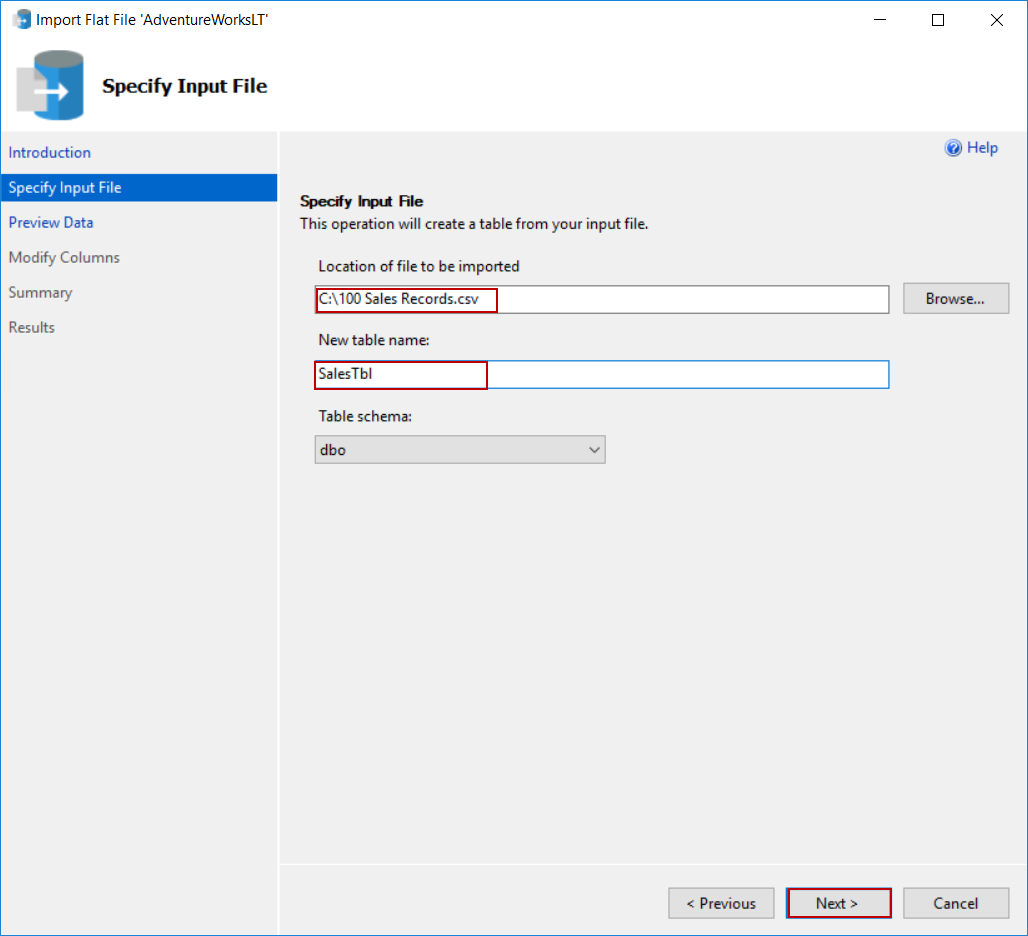
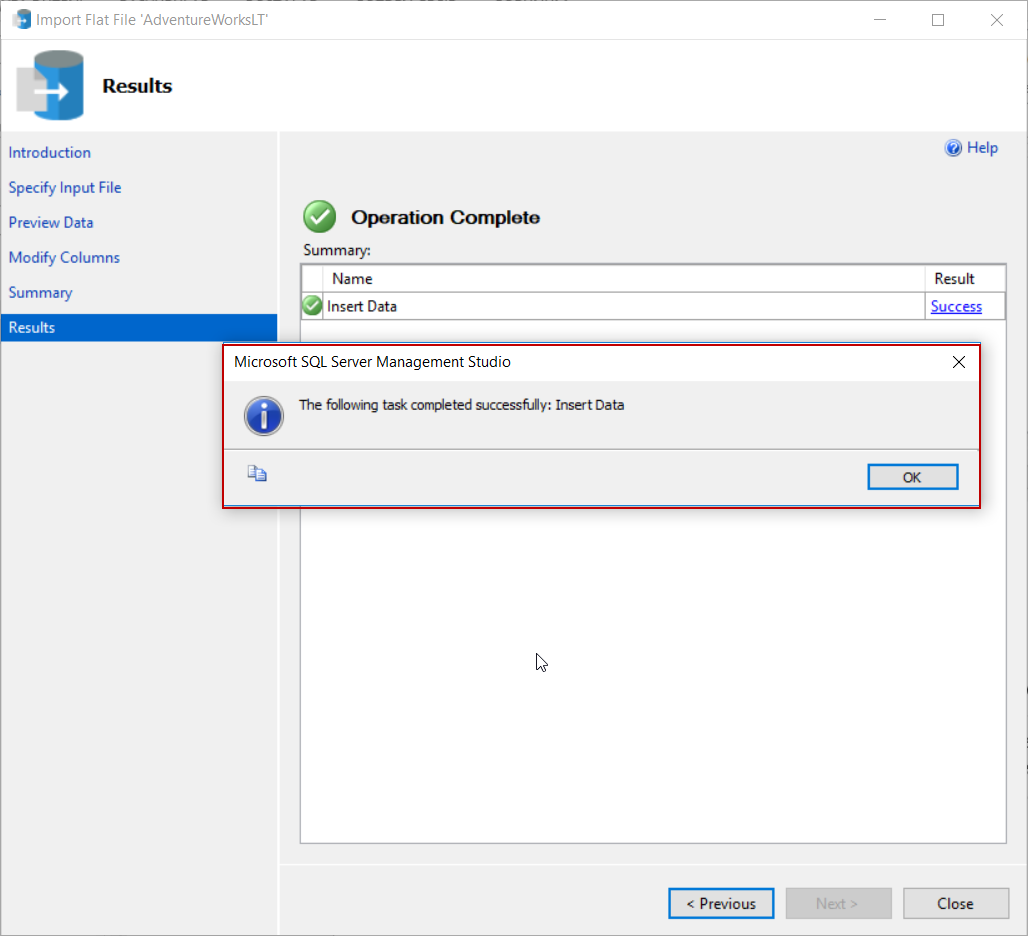
Before we start our SSRS report builder demonstration, we need a sample dataset. For this, we will download the sample sales csv file and load it to Azure SQL database. It is very basic operation so we can complete the following steps easily. Additionally, you can apply the following steps on premise installation of any SQL Server version.
在开始SSRS报告构建器演示之前,我们需要一个样本数据集。 为此,我们将下载示例销售csv文件并将其加载到Azure SQL数据库。 这是非常基本的操作,因此我们可以轻松完成以下步骤。 此外,您可以在任何SQL Server版本的前提安装中应用以下步骤。
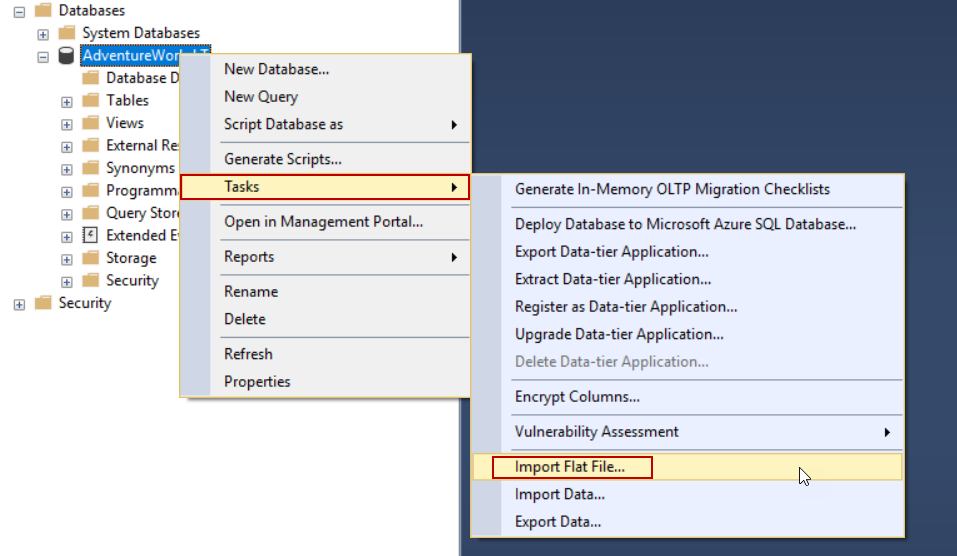
- Connect to Azure SQL or any premise installation through SQL Server Management Studio 通过SQL Server Management Studio连接到Azure SQL或任何前提安装
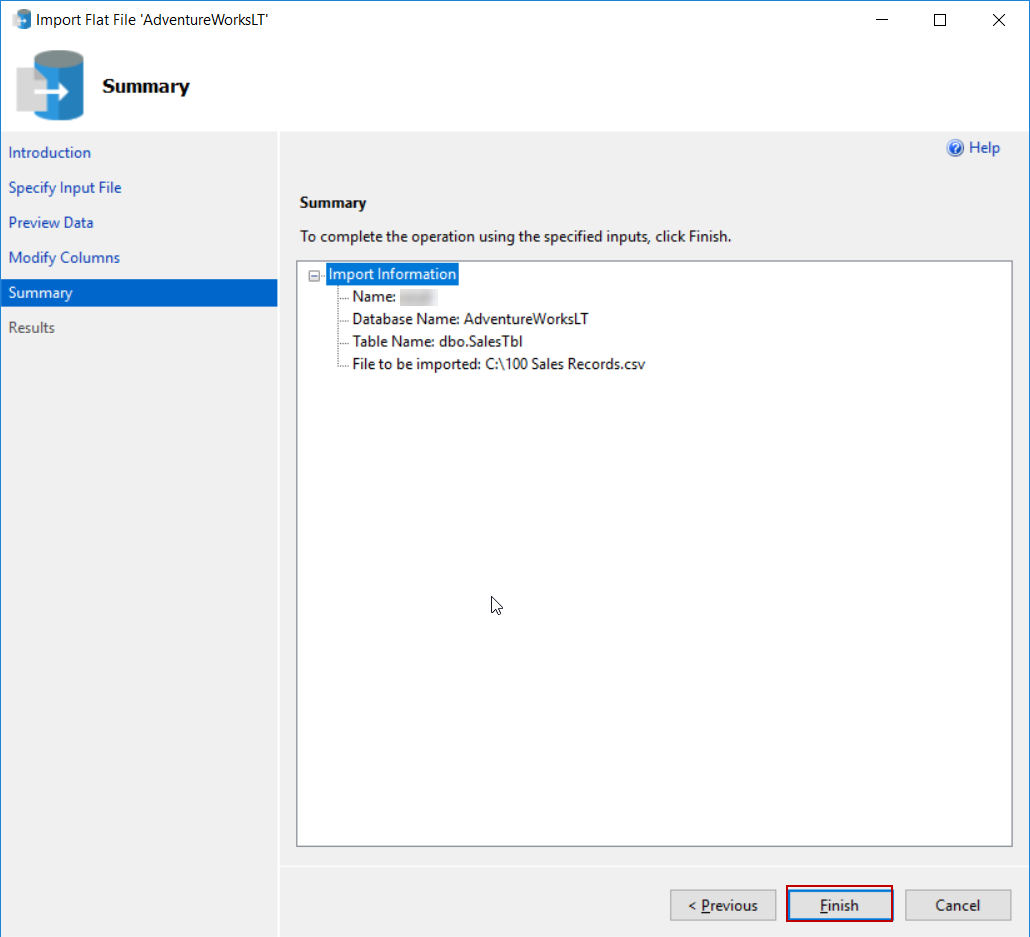
- Tasks > 任务” >“ Import Flat File… 导入平面文件...”。
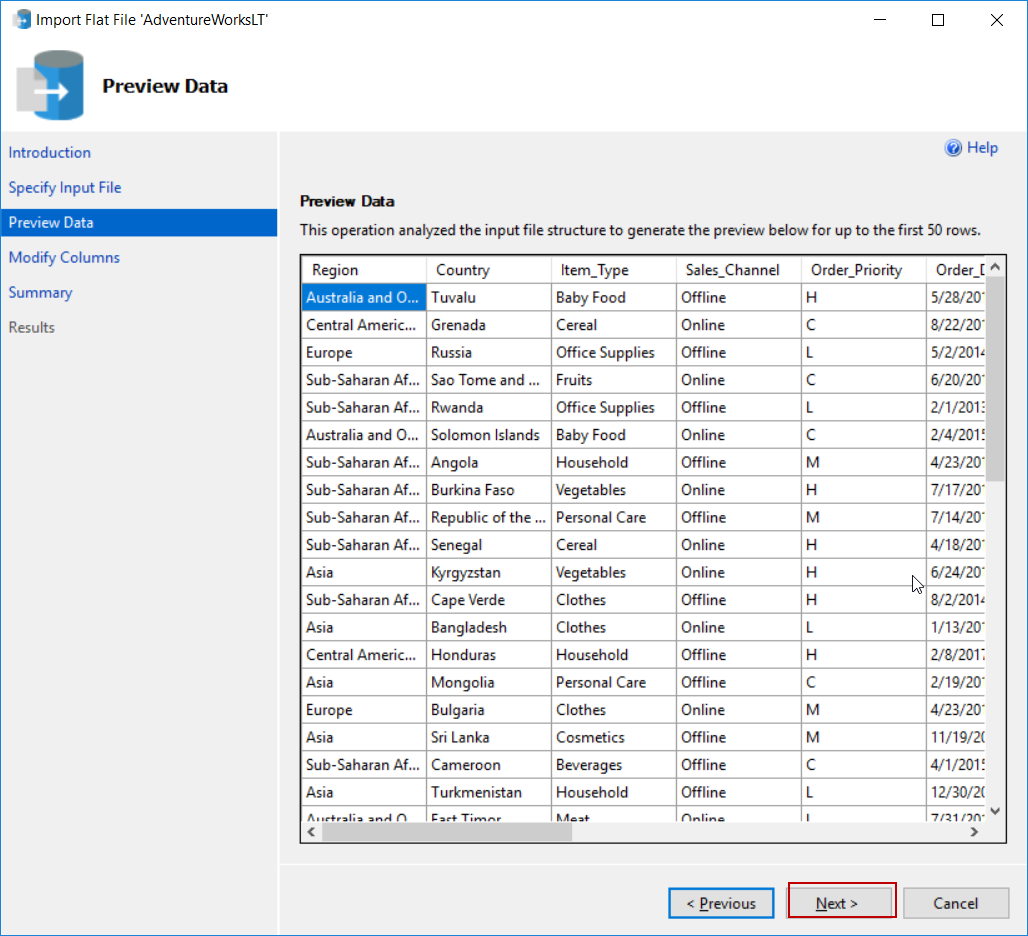
- Next in the下一步 Preview Data step 预览数据步骤
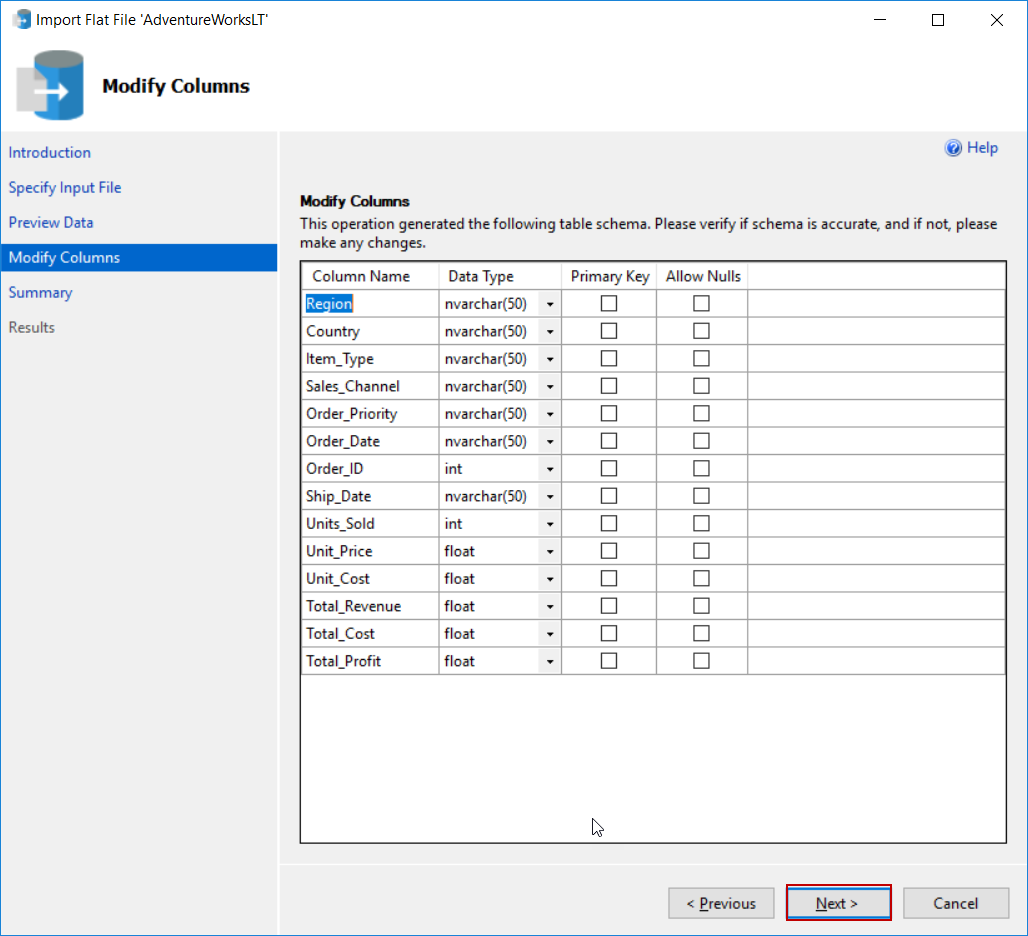
- Next in the下一步 Modify Columns step 修改列步骤
- Finish in the Summary step 完成 ”
使用SSRS报表生成器创建我们的第一个报表 (Create our first report with SSRS Report Builder)
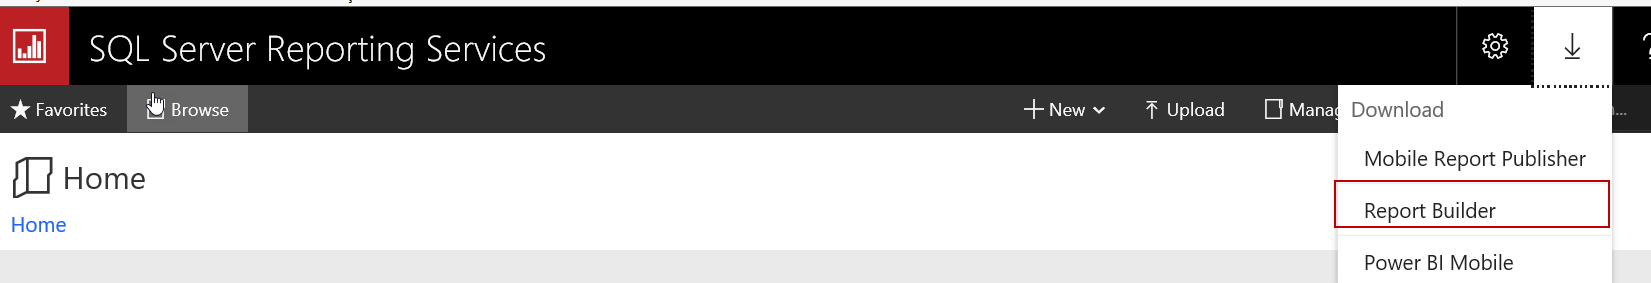
The SSRS Report Builder is a report creation tool which allows users to create, manage and publish reports to SQL Server Reporting Services. We can also create shared datasets with the help of the report builder. The Report builder has a standalone installation so we can easily setup and configure it. We can find out the installation link in the web portal of SQL Server Reporting Services. When we click this link it redirects to download page.
SSRS报表生成器是一个报表创建工具,允许用户创建,管理报表并将其发布到SQL Server报表服务。 我们还可以在报表构建器的帮助下创建共享数据集。 报告构建器具有独立安装,因此我们可以轻松地设置和配置它。 我们可以在SQL Server Reporting Services的Web门户中找到安装链接。 当我们单击此链接时,它将重定向到下载页面。
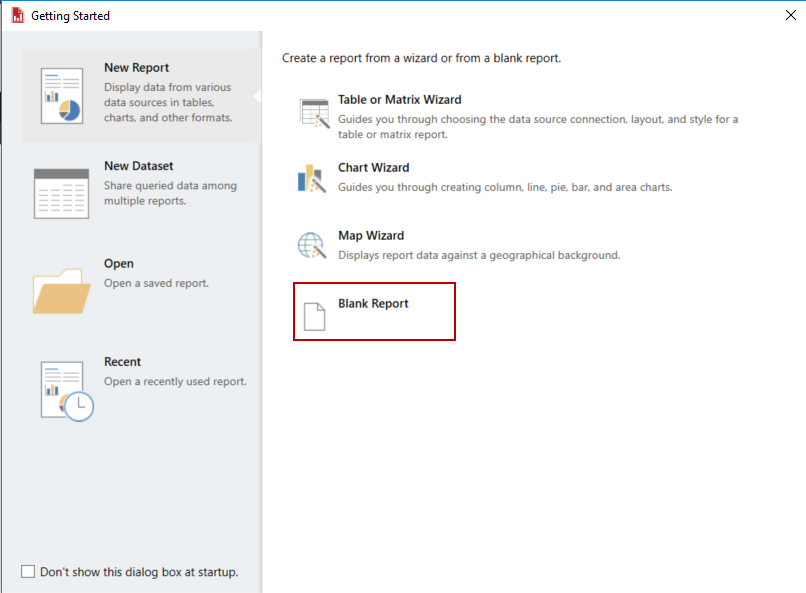
We will skip the SSRS report builder installation steps because it is pretty self-explainable. When we launch the report builder, “Getting Started” screen is displayed. In this screen, we have four options;
我们将跳过SSRS报表构建器的安装步骤,因为它很容易解释。 当我们启动报告构建器时,将显示“入门”屏幕。 在此屏幕中,我们有四个选项;
- New Report: In this tab, we can quickly create reports through the various wizard options or we can choose the blank report option. In the blank report option, we need to set some options manually 新建报告:在此选项卡中,我们可以通过各种向导选项快速创建报告,也可以选择空白报告选项。 在空白报告选项中,我们需要手动设置一些选项
- New Dataset: This option enables creating shared-datasets 新数据集:此选项可用于创建共享数据集
- Open: With help of this option, we can open reports which are stored in the folders or in the SQL Server Reporting Services 打开:借助此选项,我们可以打开存储在文件夹或SQL Server Reporting Services中的报告
- Recent: In this tab, we can find out the reports created previously 最近:在此标签中,我们可以找到之前创建的报告
We will select the Blank Report option and then report builder design page will appear.
我们将选择“ 空白报告”选项,然后将显示“报告构建器设计”页面。
The Report builder main screen is not very complicated and it allows us to create reports easily. Let’s demonstrate creating a report and learn much more about the SSRS report builder. In this demonstration, we will accomplish the following steps;
报告构建器主屏幕不是很复杂,它使我们可以轻松创建报告。 让我们演示如何创建报告,并进一步了解SSRS报告构建器。 在此演示中,我们将完成以下步骤;
- Create a datasource connection 创建数据源连接
- Create a dataset 创建一个数据集
- Design report with report builder 使用报告生成器设计报告
- Deploy created report builder report to My Folder path 将创建的报告构建器报告部署到“我的文件夹”路径
创建数据源 (Create a datasource )
In the right side of the report builder we can see the Report Data panel which helps to manage Data Sources and Datasets and also in this panel we can manage report parameters and built-in fields. Now, we will create a connection between Azure SQL and report builder. Right click in the Data Sources folder and then select Add Data Source.
在报告构建器的右侧,我们可以看到“报告数据”面板,该面板有助于管理数据源和数据集,并且在该面板中,我们还可以管理报告参数和内置字段。 现在,我们将在Azure SQL和报表生成器之间创建一个连接。 右键单击“ 数据源”文件夹,然后选择“ 添加数据源” 。
SQL Server Reporting Services allows us to use two types of connection methods;
SQL Server Reporting Services允许我们使用两种类型的连接方法:
- Use a shared connection or report model: In this method we can use a shared data source. This type of data sources helps us to avoid repeated data source because this type data source can be used number of times according to report user authorizations 使用共享连接或报告模型 :在这种方法中,我们可以使用共享数据源。 这种类型的数据源可以帮助我们避免重复的数据源,因为根据报告用户的授权可以多次使用这种类型的数据源。
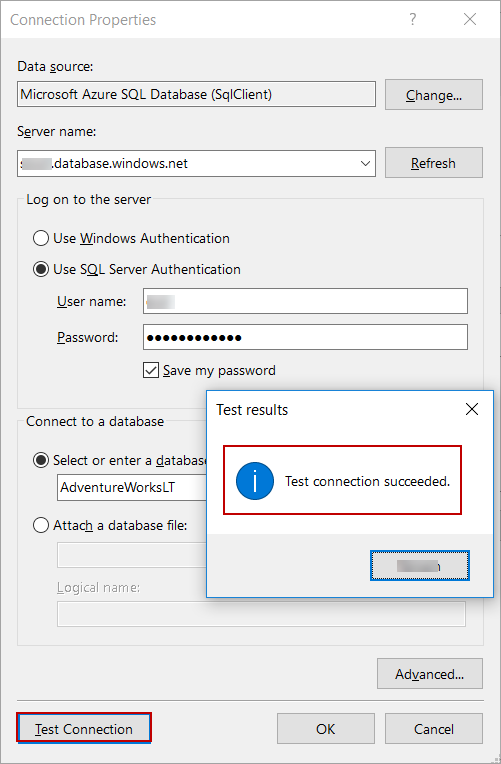
- Use a connection embedded in my reports: This method creates individual connection and also, we have to create connection in the report. Now, let’s return to our demonstration after this step, the 使用嵌入在我的报表中的连接:此方法创建单个连接,而且,我们必须在报表中创建连接。 现在,让我们回到该步骤之后的演示中,出现“ Data Source Properties screen appears so we can add target data source which we want to connect. In this screen, we can find out various data sources, however we will select Microsoft Azure SQL Database and 数据源属性”屏幕,以便我们可以添加要连接的目标数据源。 在此屏幕中,我们可以找到各种数据源,但是我们将选择“ Microsoft Azure SQL数据库”并Use a connection embedded in my reports. We build click Build to set connection properties and credentials 使用“我的报表中嵌入的连接” 。 我们构建单击构建以设置连接属性和凭据
Fill the Server name and other required connection settings and then check the connection with Test Connection.
填写服务器名称和其他必需的连接设置,然后使用“ 测试连接”检查连接 。
创建一个数据集 (Create a dataset )
In this step we will create a dataset, we use datasets in order to retrieve data from target data source. Right click on Datasets folder and select Add Dataset… and then we will select a datasource which we created in the Create a datasource connection step and write a very basic query which returns all data of the SalesTbl
在这一步中,我们将创建一个数据集,我们将使用数据集来从目标数据源中检索数据。 右键单击Datasets文件夹,然后选择Add Dataset… ,然后我们将选择在Create a datasource connection步骤中创建的数据源,并编写一个非常基本的查询,该查询将返回SalesTbl的所有数据
SELECT * FROM dbo.SalesTbl
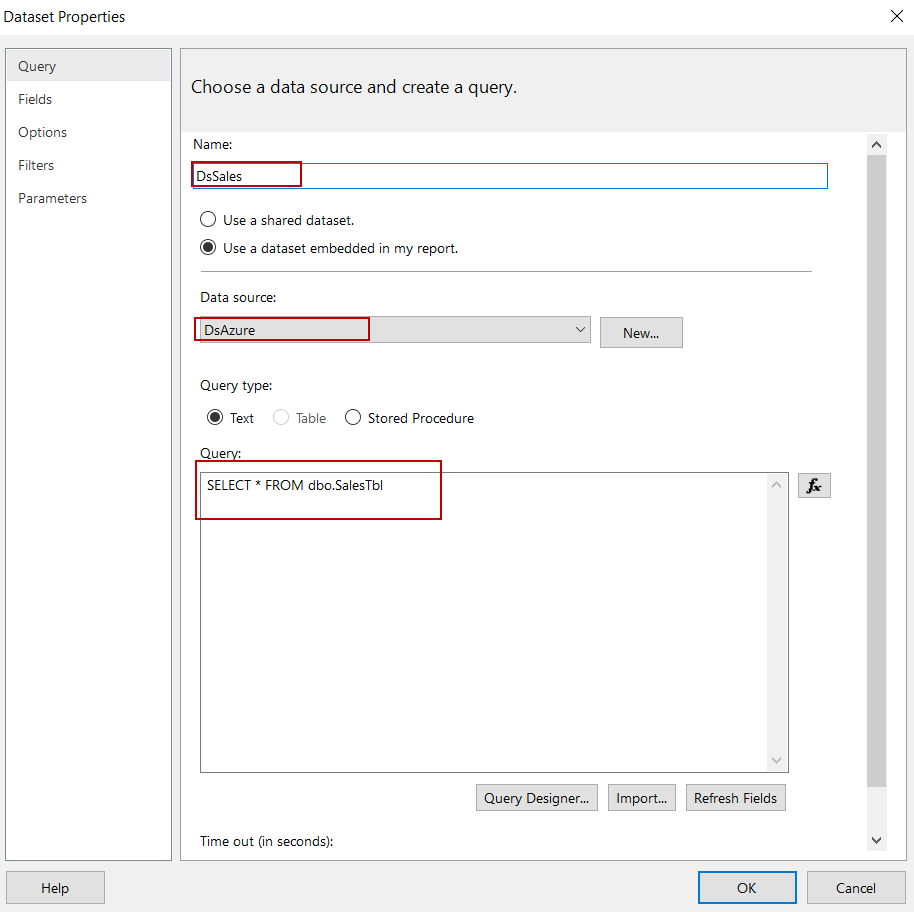
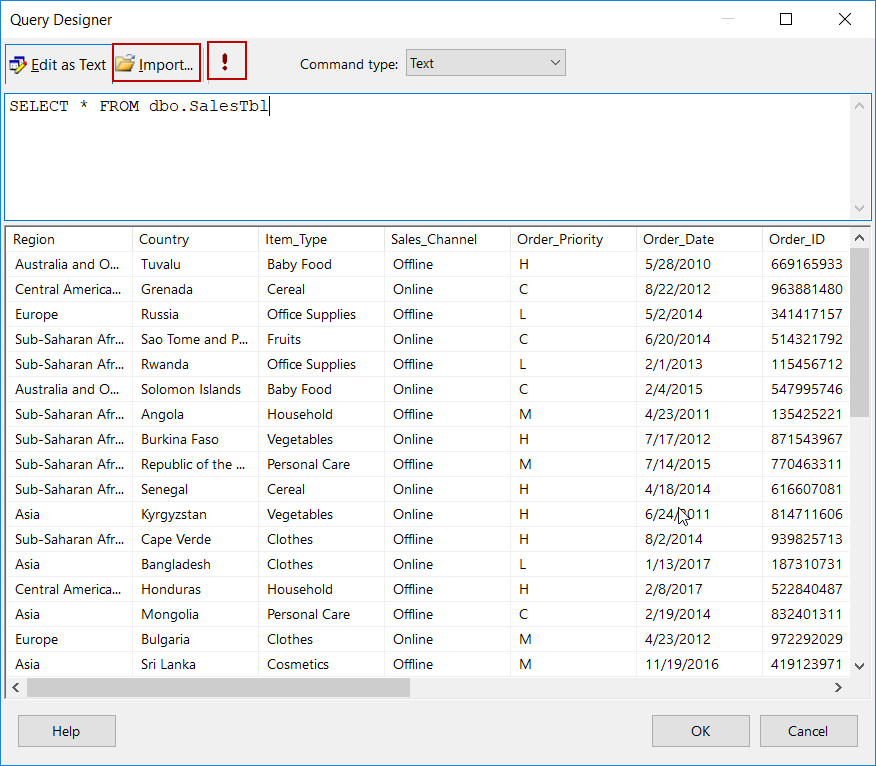
The Data properties screen includes various settings and configuration tab according to dataset. In the Query tab we can select data source and also we can manage the query types and text. If we click Query Designer, we can execute queries. The Exclamation mark (!) button executes the queries and we can also import prepared queries t-sql through import option.
数据属性屏幕根据数据集包括各种设置和配置选项卡。 在查询选项卡中,我们可以选择数据源,还可以管理查询类型和文本。 如果单击查询设计器,则可以执行查询。 惊叹号( ! )按钮执行查询,我们也可以通过import选项导入准备好的查询t-sql。
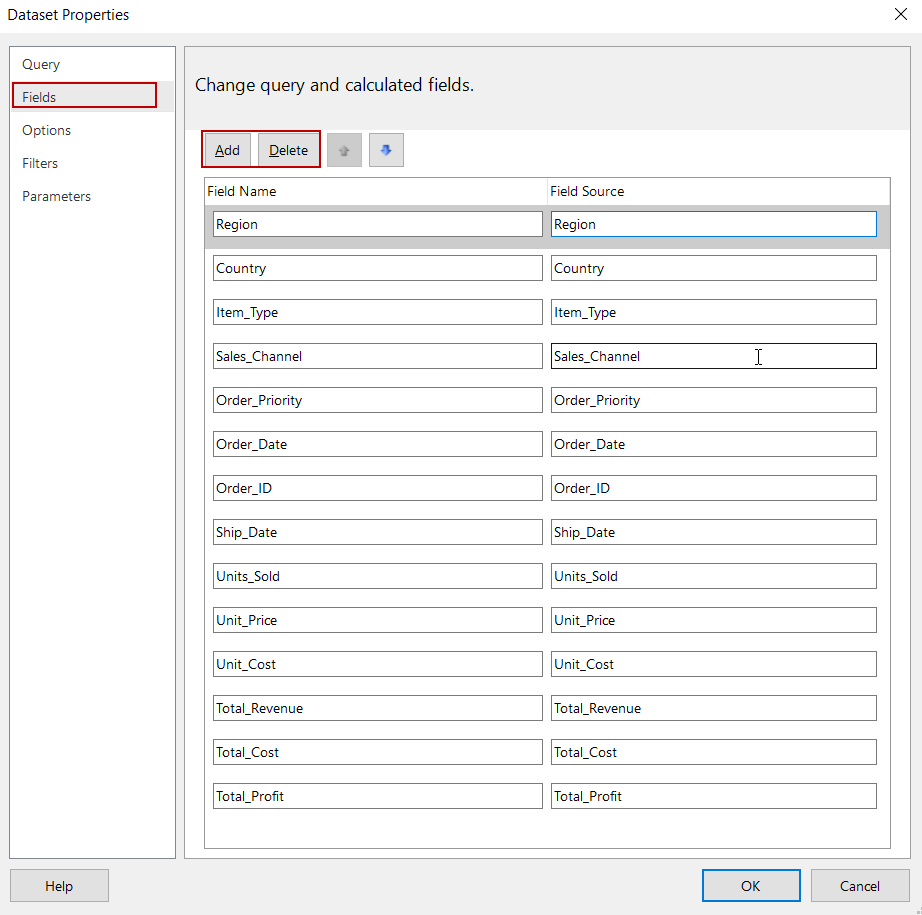
In field tab we can add and delete columns of the dataset and we can also change the columns names.
在字段选项卡中,我们可以添加和删除数据集的列,还可以更改列名。
The Filter tab helps us to filter dataset with specified filter expression, this filter does not affect the dataset query. It only influences dataset rows after the query execution so query populates all data to dataset and the filter expression refines the data.
“过滤器”选项卡帮助我们使用指定的过滤器表达式过滤数据集,该过滤器不会影响数据集查询。 它仅影响查询执行后的数据集行,因此查询会将所有数据填充到数据集中,并且过滤器表达式会精炼数据。
In the Parameter tabs, we can find out and define parameters which are related to dataset so we can use parametrized queries in the report builder dataset.
在“参数”选项卡中,我们可以查找和定义与数据集相关的参数,以便可以在报表构建器数据集中使用参数化查询。
设计报告 (Designing a report)
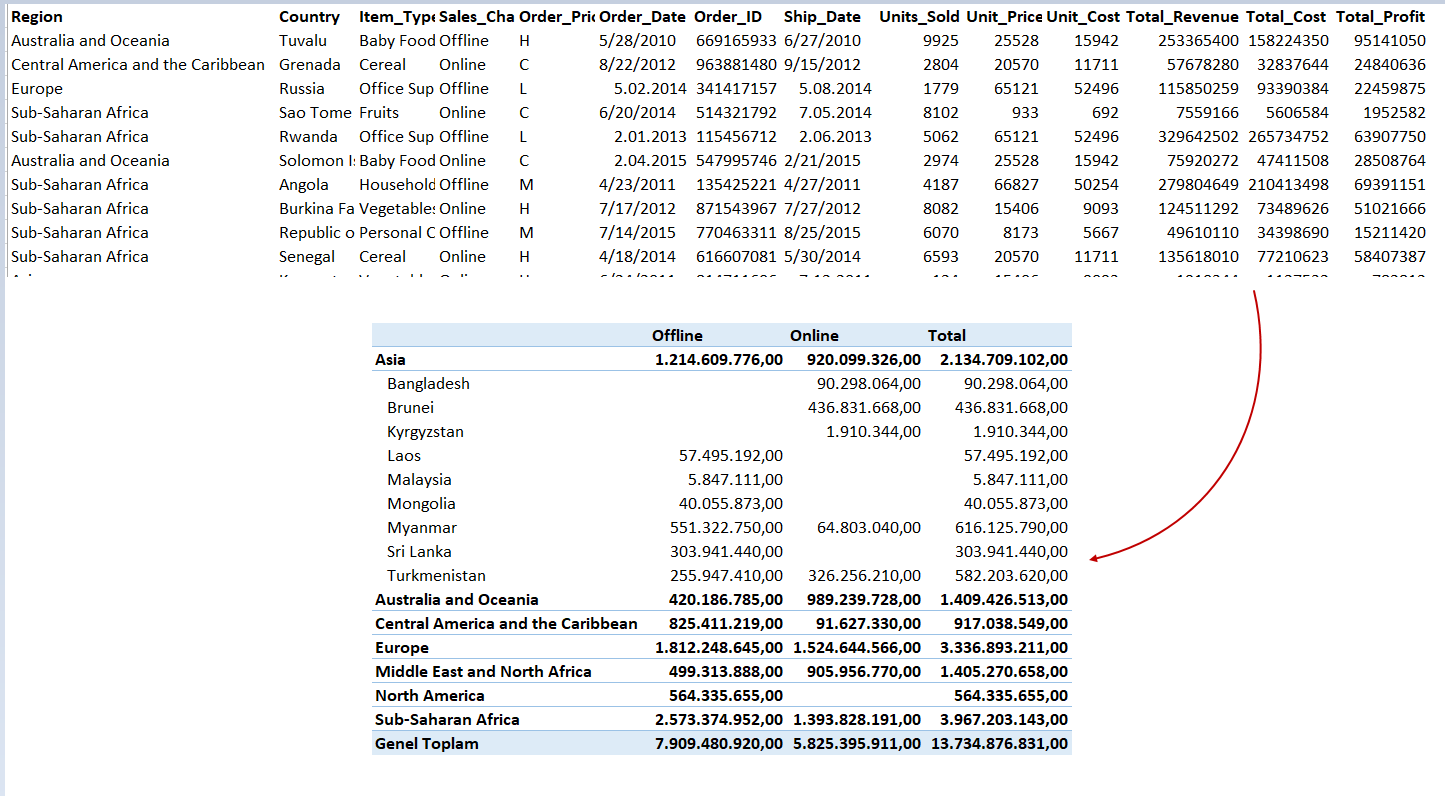
The Matrix helps us to aggregate data summaries such as excel pivot table. Through the matrix, we can group and summarize data in several formats. At the end of this section, our report design should look similar to following illustration.
矩阵可帮助我们汇总数据摘要,例如excel数据透视表。 通过矩阵,我们可以以几种格式对数据进行分组和汇总。 在本节的最后,我们的报告设计应类似于下图。
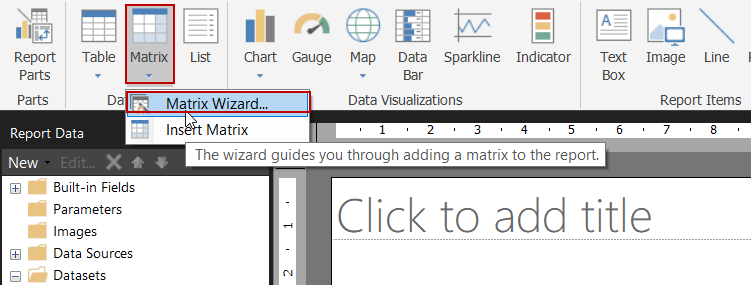
At first, we will select the Matrix Wizard in order to create a summarized report.
首先,我们将选择矩阵向导以创建汇总报告。
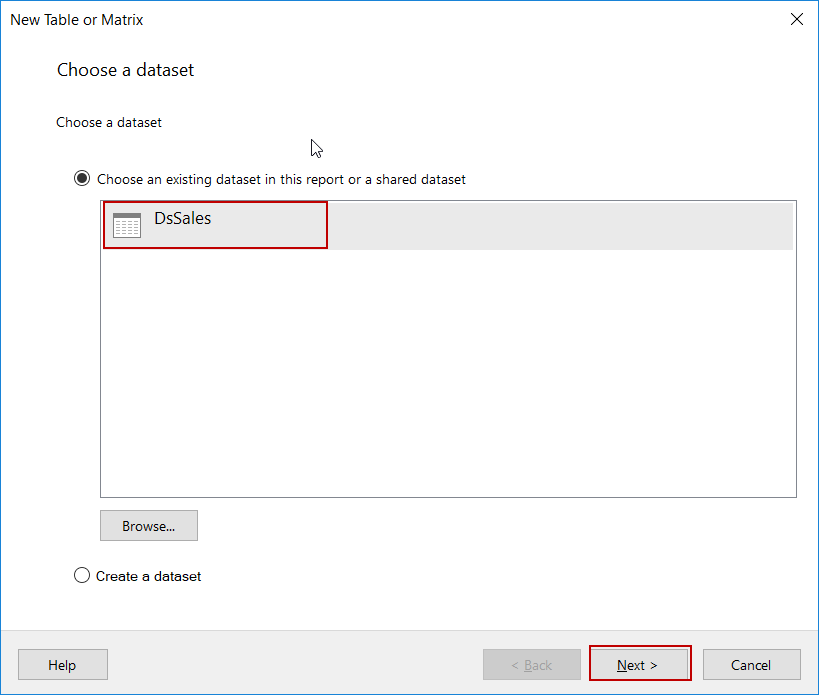
Select the dataset in which we want to display the data in summarized format.
选择我们要在其中以汇总格式显示数据的数据集。
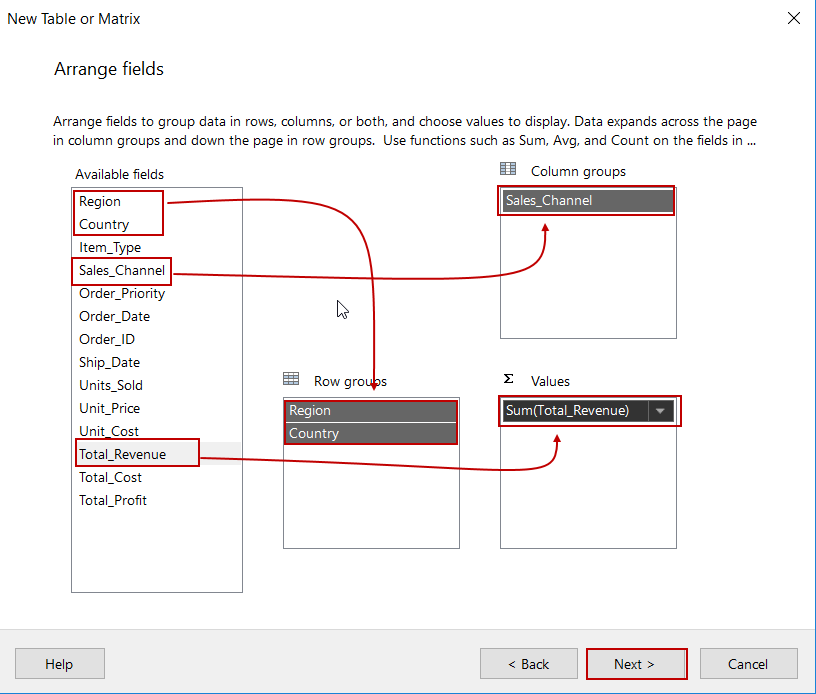
In the next screen, we will arrange the row and column we want to group and also we have to select column we want to aggregate in sum.
在下一个屏幕中,我们将排列要分组的行和列,还必须选择要汇总的列。
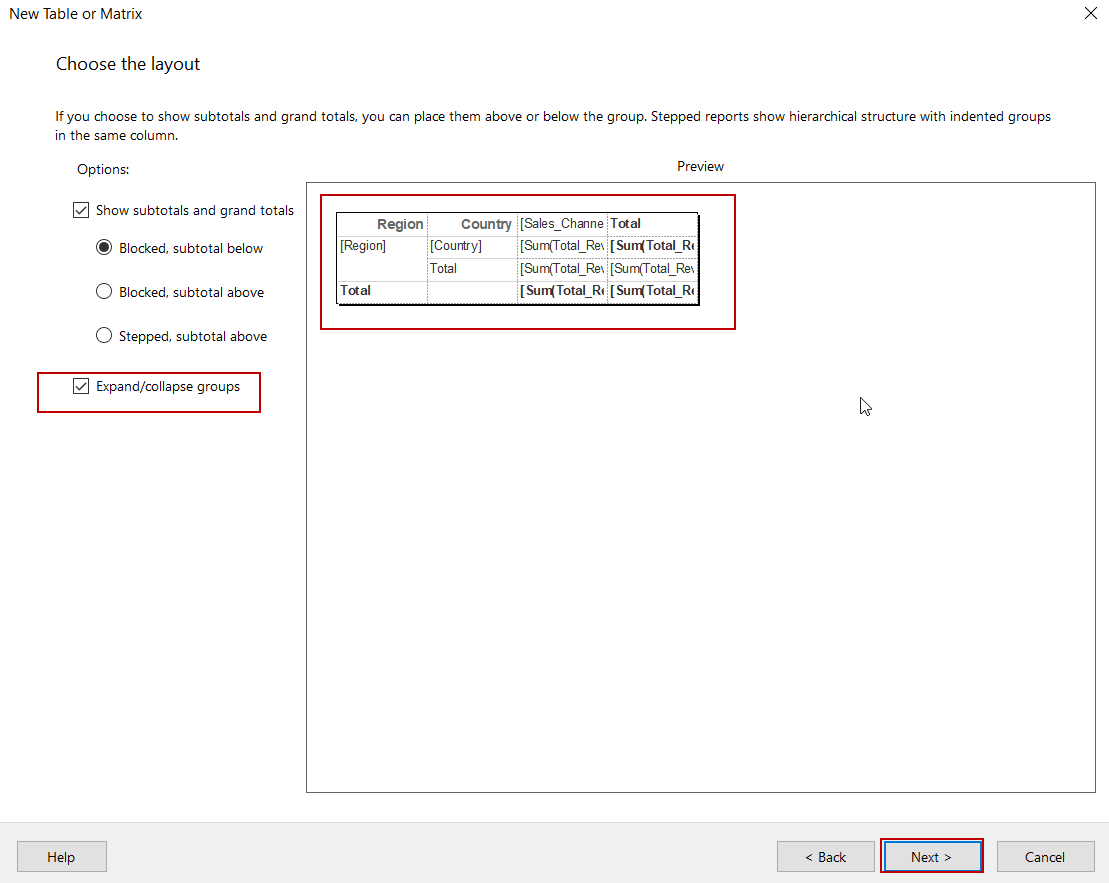
We will check the Expand/collapse groups in the layout screen in order to enable drilldown toggles so that report readers can use report interactively.
我们将在布局屏幕中检查“ 展开/折叠”组 ,以启用向下钻取切换,以便报表阅读器可以交互使用报表。
Click Finish
点击完成
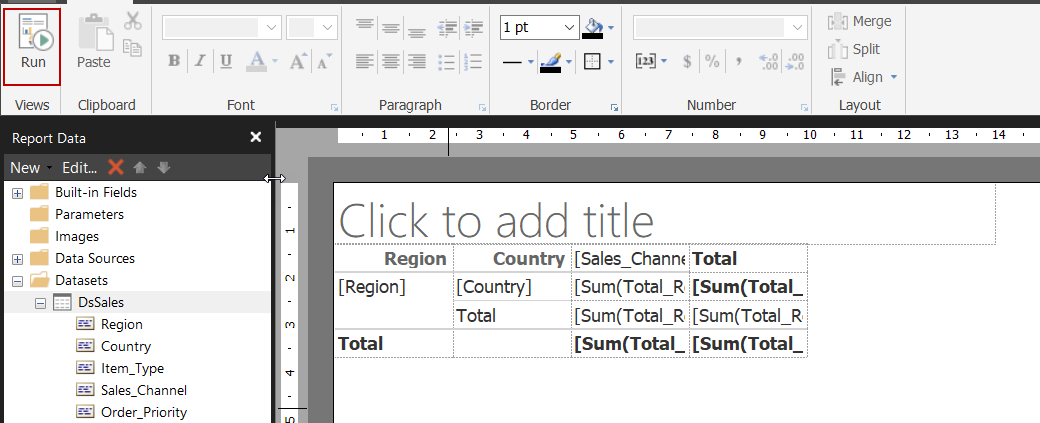
We will Run the report
我们将运行报告
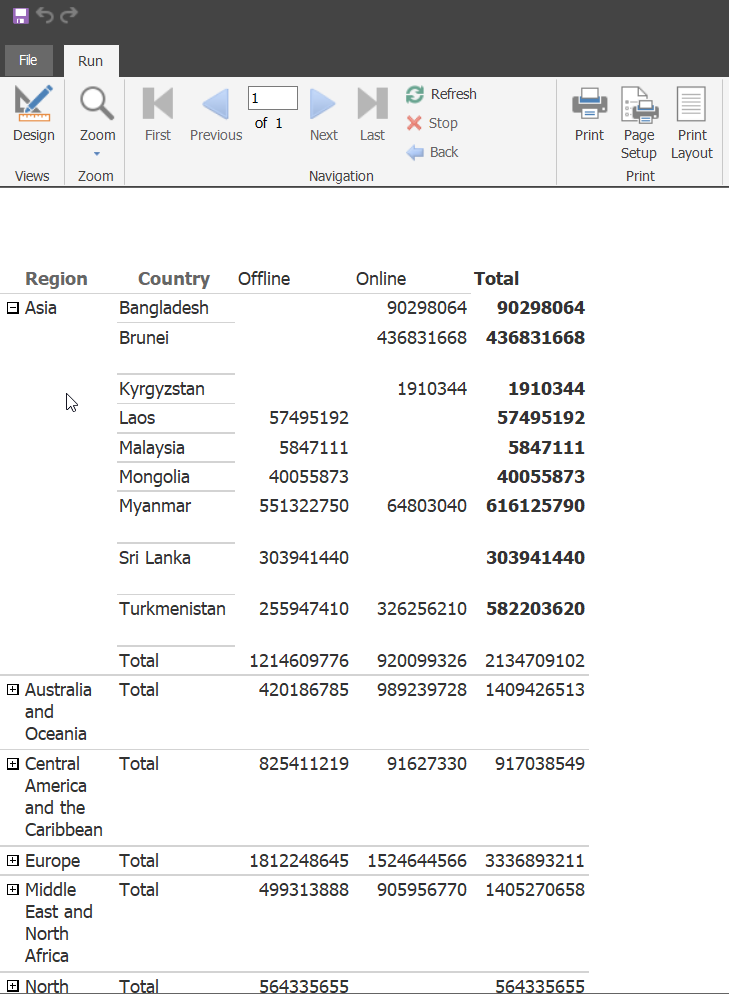
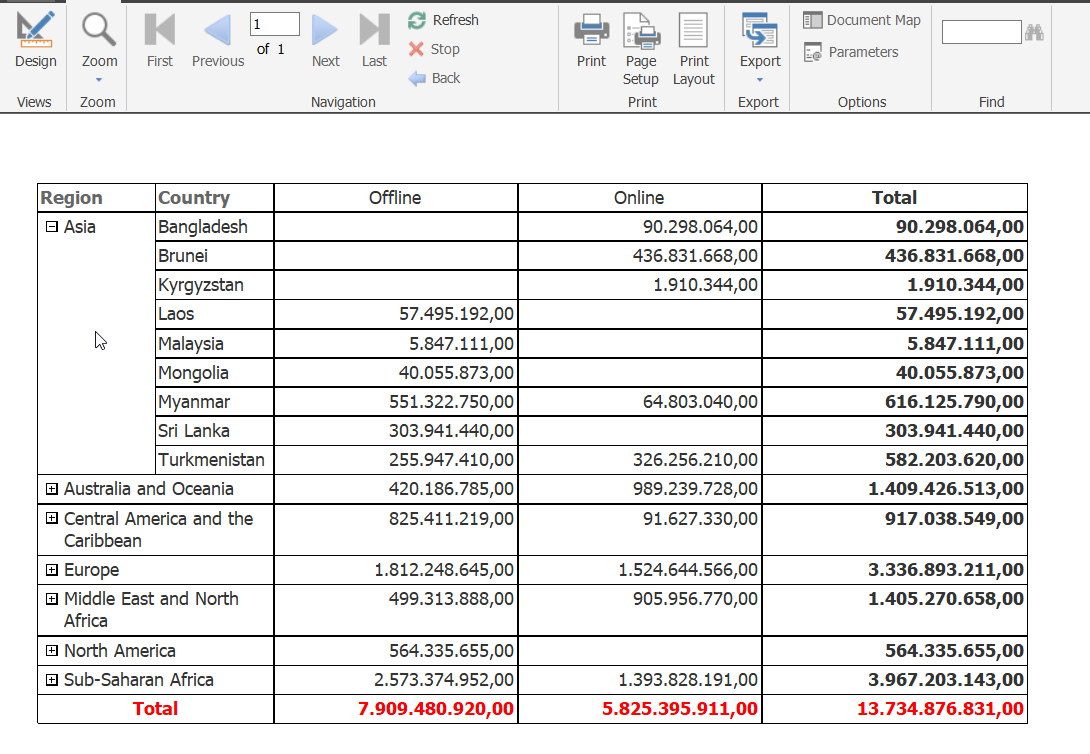
The output of the report will be as follows
该报告的输出如下
We completed the report design but this report still needs some style improvements.
我们已经完成了报表设计,但是此报表仍需要一些样式上的改进。
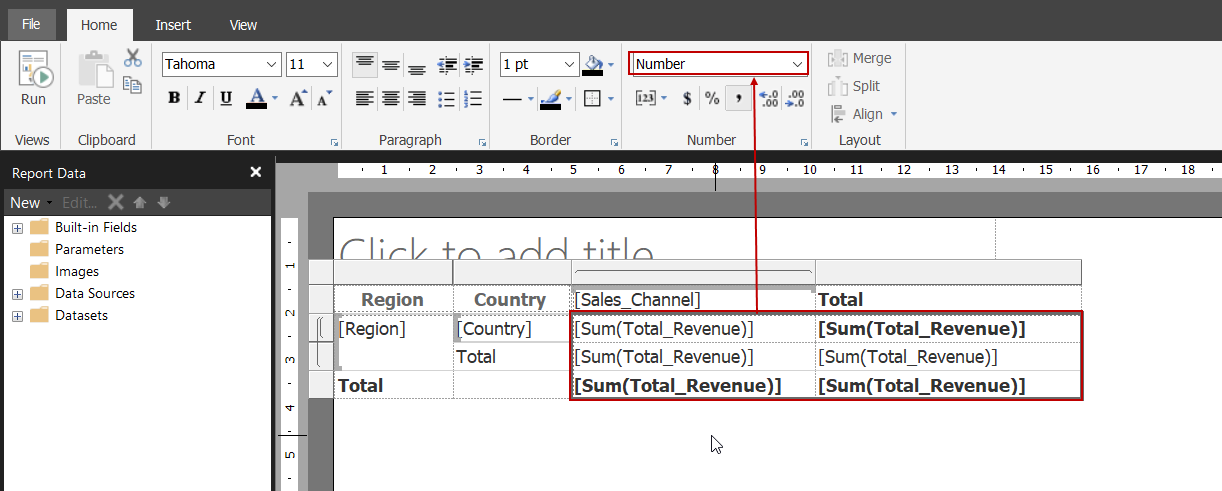
Select the numerical cells and then change the format of cells to Number.
选择数字单元格,然后将单元格的格式更改为Number 。
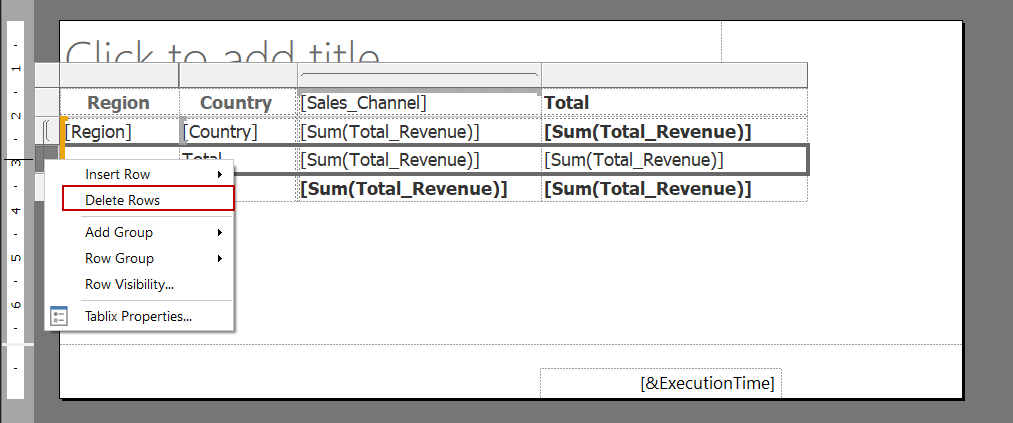
We will remove the Country subtotals row.
我们将删除国家/地区小计行。
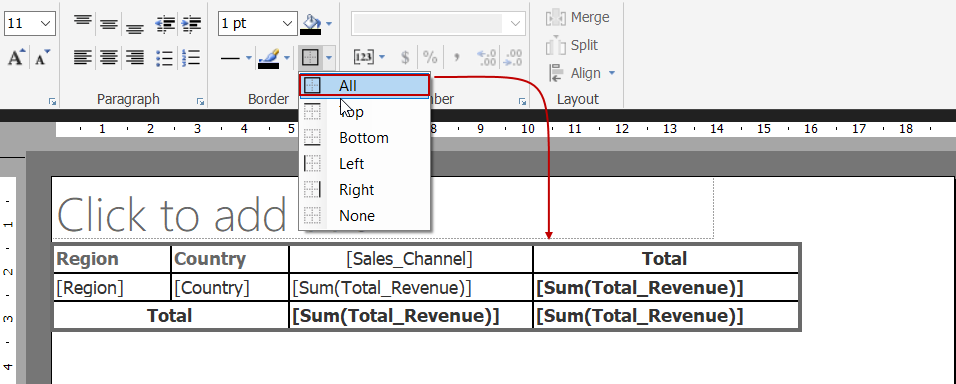
We will apply borders to cell so that the report layout will be shown smoother.
我们将边框应用于单元格,以便报表布局显示得更流畅。
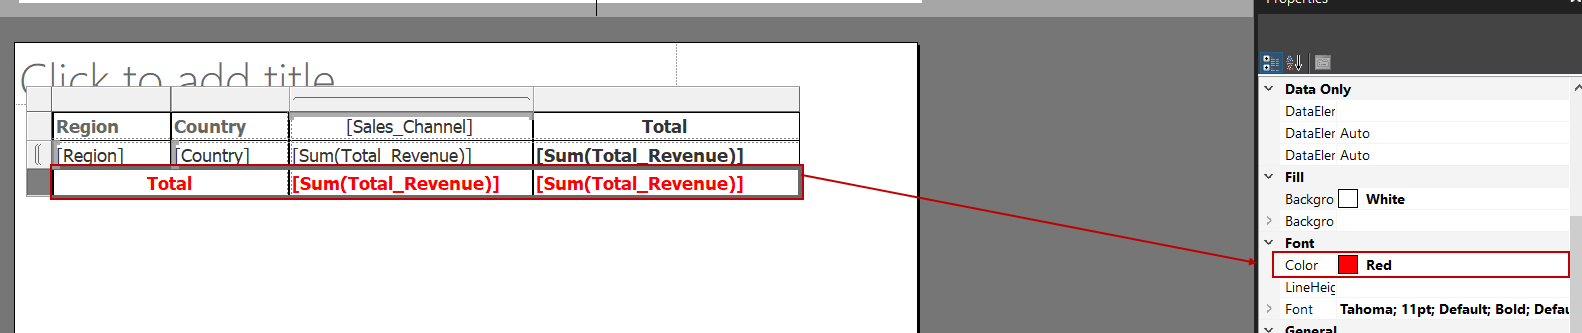
We will change the font color of the total row to Red.
我们将总行的字体颜色更改为Red 。
We will Run the report again.
我们将再次运行报告。
Finally, we completed our design with SSRS report builder and now we will deploy this report to My Reports Folder. However, we need to enable My Reports folder.
最后,我们使用SSRS报表构建器完成了设计,现在将报表部署到“我的报表”文件夹中。 但是,我们需要启用“我的报告”文件夹。
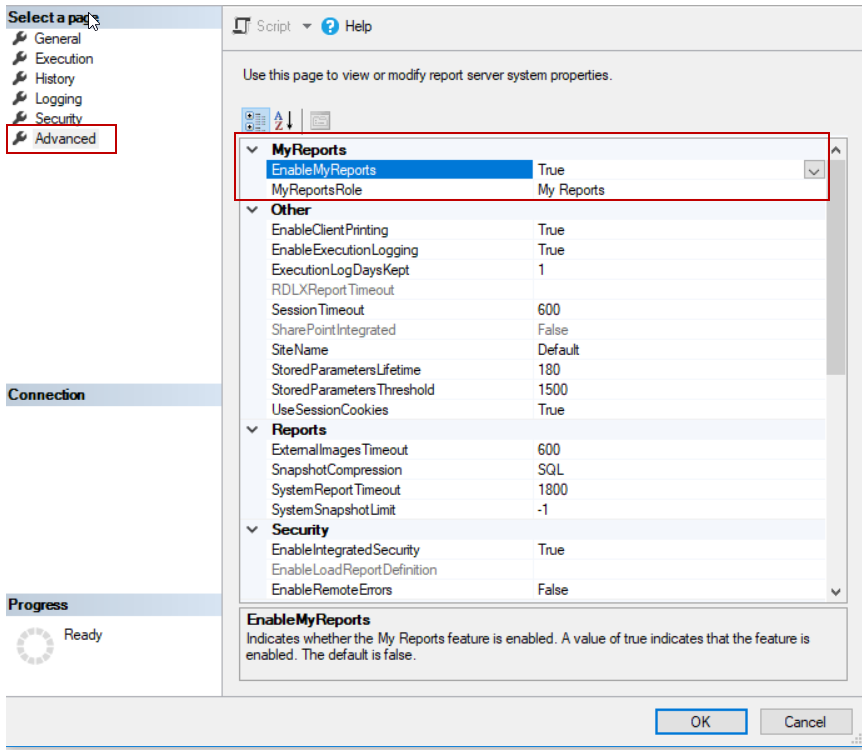
Connect to SQL Server Reporting Service through SQL Server Management Studio and then right click to report server. Navigate to advanced tab and set true to EnableMyReports parameter.
通过SQL Server Management Studio连接到SQL Server报告服务,然后右键单击以报告服务器。 导航到“高级”选项卡,并将true设置为EnableMyReports参数。
My Reports folder will be shown in the SSRS web portal.
我的报告文件夹将显示在SSRS Web门户中。
Now, we will publish the report to SSRS. Click the File menu and then select Save As and then connect to report server.
现在,我们将报告发布到SSRS。 单击文件菜单,然后选择另存为 ,然后连接到报表服务器。
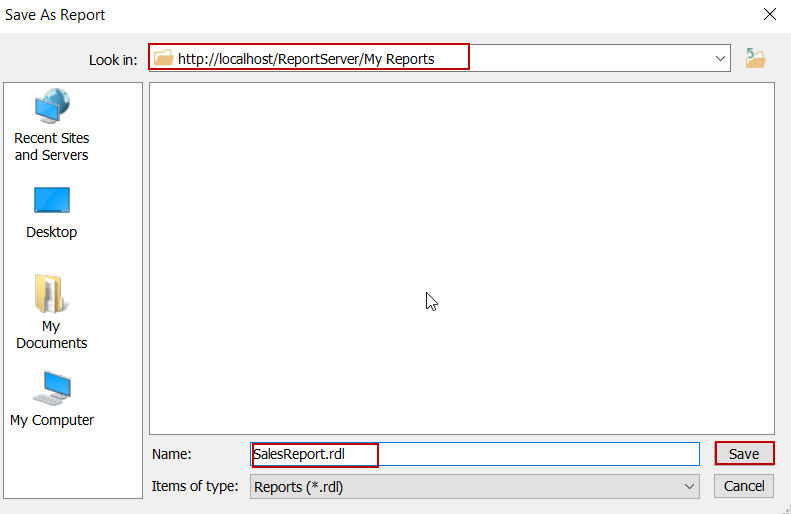
We can find out the report under the My Folder after the deployment process.
部署过程结束后,我们可以在“ 我的文件夹”下找到报告。
结论 (Conclusion)
In this article, we mentioned about how to design SSRS reports with the SSRS report builder. The report builder comes to the forefront with easy usage so it takes more advantage in self-service BI implementations.
在本文中,我们提到了如何使用SSRS报告构建器设计SSRS报告。 报表构建器以易于使用而走在前列,因此在自助式BI实现中具有更多优势。
翻译自: https://www.sqlshack.com/ssrs-report-builder-introduction-and-tutorial/
ssrs报表教程


 427
427

 被折叠的 条评论
为什么被折叠?
被折叠的 条评论
为什么被折叠?
 到【灌水乐园】发言


