


–is-dba
Along with the release of SQL server 2016 CTP 3 now comes the preview of a brand new feature for on premise databases – the Query Store. This feature enables performance monitoring and troubleshooting through the log of executed queries.
随着SQL Server 2016 CTP 3的发布,现在提供了内部数据库的一项全新功能的预览-查询存储。 此功能可通过执行查询的日志来进行性能监视和故障排除。
This blogpost will cover the following aspects of the Query Store feature:
该博客文章将涵盖查询存储功能的以下方面:
- Introduction 介绍
- How to activate it 如何激活
- Configuration options 配置选项
- What information is found in the Query Store 在查询存储中找到什么信息
- How to use the feature 如何使用功能
- What’s in it for me 对我有什么好处
介绍 (Introduction)
The new feature Query Store enables everyone with responsibility for SQL server performance and troubleshooting with insight to the actual queries and their query-plans. It simplifies the old way of setting up tracing, logging and event handling to a standard, out of the box, feature.
Query Store的新功能使每个人对SQL服务器的性能和故障排除负有责任,可以洞悉实际查询及其查询计划。 它简化了将跟踪,日志记录和事件处理设置为标准即装即用功能的旧方法。
It enables you to find causes for performance differences due to a change in query plans. It also captures historic data from queries, plans, statistics (runtime), and keeps these for later review. This storage is divided into configured time-slots.
它使您能够查找由于查询计划的更改而导致性能差异的原因。 它还从查询,计划,统计信息(运行时)中捕获历史数据,并保留这些数据供以后查看。 该存储分为已配置的时隙。
All in all, this feature enables you to monitor, capture and analyze performance issues in the server with a few standard settings.
总而言之,此功能使您可以通过一些标准设置来监视,捕获和分析服务器中的性能问题。
如何激活 (How to activate it)
The feature can be enabled in to ways – from SSMS with mouse-clicks or from T-SQL statements.
可以通过多种方式启用该功能-通过单击鼠标的SSMS或T-SQL语句。
从Management Studio启用查询存储 (Enable Query Store from Management Studio)
From the Object Explorer pane, right-click the database and select the Properties option.
在“对象资源管理器”窗格中,右键单击数据库,然后选择“ 属性”选项。
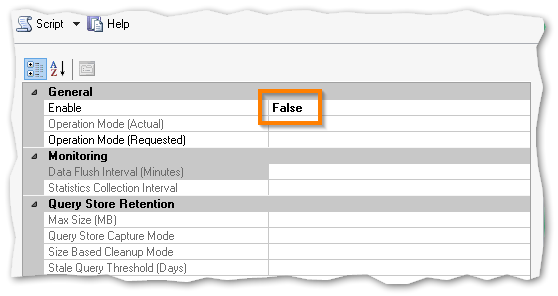
Click the Query Store tab and change the ‘Enable’ to TRUE:
单击查询存储选项卡,然后将“启用”更改为TRUE:
从T-SQL语句启用查询存储 (Enable Query Store from T-SQL statement)
In a new query window, the following statement enables the Query Store feature on the database ‘QueryStoreDB’:
在新的查询窗口中,以下语句在数据库“ QueryStoreDB”上启用查询存储功能:
ALTER DATABASE QueryStoreDB SET QUERY_STORE = ON;
配置选项 (Configuration options)
The Query Store has a series of configuration options. All of them can be set from SQL Server Management Studio through th GUI or using T-SQL statements.
查询存储具有一系列配置选项。 所有这些都可以在SQL Server Management Studio中通过GUI或使用T-SQL语句进行设置。
OPERATION_MODE – This can be READ_WRITE or READ_ONLY and states if the Query Store is to collect new data (READ_WRITE) or not to collect data and just hold current data (READ_ONLY).
OPERATION_MODE –可以为READ_WRITE或READ_ONLY,并指出查询存储区是要收集新数据(READ_WRITE)还是不收集数据而仅保留当前数据(READ_ONLY)。
CLEANUP_POLICY – Specifies through the STALE_QUERY_THRESHOLD_DAYS the number of days for the query store to retain data.
CLEANUP_POLICY –通过STALE_QUERY_THRESHOLD_DAYS指定查询存储保留数据的天数。
DATA_FLUSH_INTERVAL_SECONDS – Gives the interval in which the data written to the Query Store is persisted to the disk. The frequency, which is asynchronous, for which the transfer occurs is configured via DATA_FLUSH_INTERVAL_SECONDS.
DATA_FLUSH_INTERVAL_SECONDS –提供写入查询存储区的数据持久保存到磁盘的时间间隔。 通过DATA_FLUSH_INTERVAL_SECONDS配置发生异步的频率。
MAX_STORAGE_SIZE_MB – This gives the maximum size of the total data in the Query Store. If and when the limit is reached, the OPERATION_MODE is automatic changed to READ_ONLY and no more data is collected.
MAX_STORAGE_SIZE_MB –这给出了查询存储中总数据的最大大小。 如果达到限制,则将OPERATION_MODE自动更改为READ_ONLY,并且不再收集任何数据。
INTERVAL_LENGTH_MINUTES – Gives the interval at which the data from runtime execution stats is aggregated. The option gives the fixed time window for this aggregation.
INTERVAL_LENGTH_MINUTES –给出运行时执行统计数据的汇总间隔。 该选项为该聚合提供了固定的时间窗口。
SIZE_BASED_CLEANUP_MODE – When the data in the Query Store gets close to the configured number in MAX_STORAGE_SIZE_MB this option can control the automatic cleanup process.
SIZE_BASED_CLEANUP_MODE –当查询存储中的数据接近MAX_STORAGE_SIZE_MB中配置的数字时,此选项可以控制自动清理过程。
QUERY_CAPTURE_MODE – Gives the Query Store option to capture all queries or relevant queries based on execution count and resource usage.
QUERY_CAPTURE_MODE –提供查询存储选项,以根据执行计数和资源使用情况捕获所有查询或相关查询。
MAX_PLANS_PER_QUERY – The maximum number of execution plans maintained for queries.
MAX_PLANS_PER_QUERY –为查询保留的最大执行计划数。
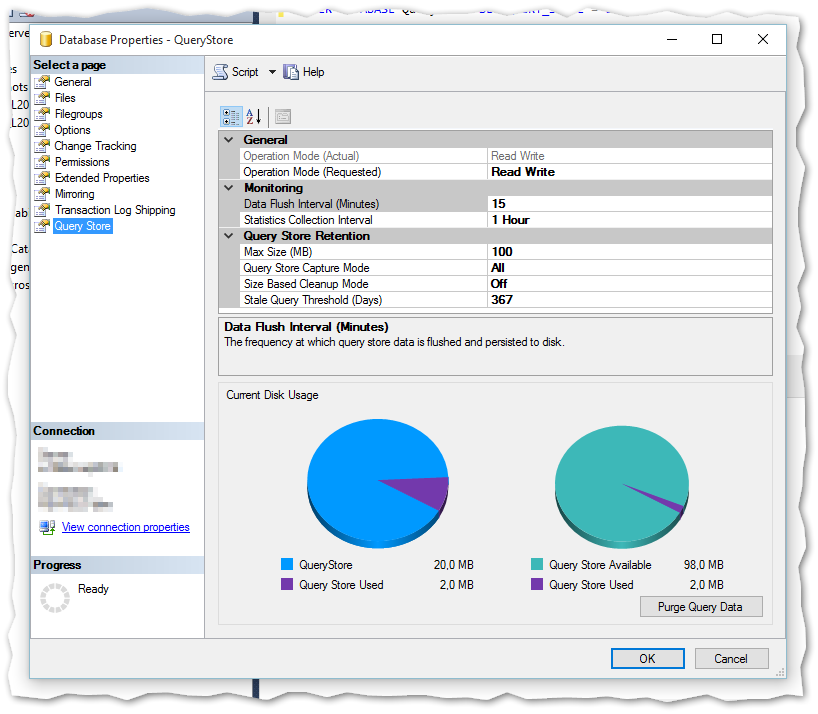
From SQL Server Management Studio, the window look like below when the Query Store is enabled. Also in the bottom of this window, you can see the current disk usage:
在SQL Server Management Studio中,启用查询存储后,窗口如下所示。 同样在此窗口的底部,您可以看到当前磁盘使用情况:
The T-SQL syntax for setting the Query Store options is as follows:
用于设置查询存储选项的T-SQL语法如下:
ALTER DATABASE <database name>
SET QUERY_STORE (
    OPERATION_MODE = READ_WRITE,
    CLEANUP_POLICY =
    (STALE_QUERY_THRESHOLD_DAYS = 30),
    DATA_FLUSH_INTERVAL_SECONDS = 3000,
    MAX_STORAGE_SIZE_MB = 500,
    INTERVAL_LENGTH_MINUTES = 15,
    SIZE_BASED_CLEANUP_MODE = AUTO,
    QUERY_CAPTURE_MODE = AUTO
    MAX_PLANS_PER_QUERY = 1000
);
在查询存储中可以找到什么信息 (What information can be found in the Query Store)
Specific queries in the SQL server normally has evolving execution plans over time. Thisis due to e.g. schema changes, changes in statistics, indexes etc. Also the plan cache evicts execution plans due to a memory pressure. The result is that the query performance troubleshooting can be non-trivial and time consuming to resolve.
SQL服务器中的特定查询通常会随着时间的推移制定不断发展的执行计划。 这是由于(例如)模式更改,统计信息的更改,索引等引起的。由于内存压力,计划缓存还会驱逐执行计划。 结果是查询性能故障排除可能非常繁琐并且解决起来很耗时。
The Query Store retains multiple execution plans per query. Therefore, it can be used to enforce certain execution plans to specific queries. This is called plan forcing (see below for stored procedure to do this).
查询存储为每个查询保留多个执行计划。 因此,它可用于对特定查询强制执行某些执行计划。 这称为计划强制(执行此操作的存储过程,请参见下文)。
Prior to SQL 2016 the hint ‘USE PLAN’ was used, but now it is a fairly easy task to enforce a specific execution plan to the query processor.
在SQL 2016之前,使用了提示“ USE PLAN”,但现在,将特定的执行计划强制执行到查询处理器是一项相当容易的任务。
More scenarios for using the Query Store:
使用查询存储的更多方案:
- Find and fix queries that have a regression in performance due to plan changes 查找和修复由于计划更改而导致性能下降的查询
- Overview of how often and in which context a query has been executed, helping the DBA on performance tuning tasks 概述执行查询的频率和上下文,帮助DBA执行性能调整任务
- Overview of the historic plan changes for a given query 给定查询的历史计划更改概述
- Identity top n queries (by time, CPU time, IO, etc.) in the past x hours 过去x小时内身份排名前n位的查询(按时间,CPU时间,IO等)
- Analyze the use of resources (IO, CPU and memory) 分析资源(IO,CPU和内存)的使用
The Query Store contains two stores – a plan store and a runtime stats store. The Plan Store persists the execution plan information and the Runtime Stats Store persists the execution statistics information. Information is written to the two stores asynchronously to optimize performance.
查询存储包含两个存储-计划存储和运行时状态存储。 计划存储保留执行计划信息,而运行时统计存储保留执行统计信息。 信息被异步写入两个存储以优化性能。
The space used to hold the runtime execution information can grow over time, so the data is aggregated over a fixed time window as per setting made in the configuration.
用于保存运行时执行信息的空间会随着时间而增长,因此,根据配置中的设置,数据会在固定的时间窗口内聚合。
When the Query Store feature is enabled in the database, a set of system views will be ready for queries.
在数据库中启用查询存储功能后,将可以使用一组系统视图进行查询。
sys.database_query_store_options
sys.query_context_settings
sys.query_store_query
sys.query_store_query_text
sys.query_store_plan
sys.query_store_runtime_stats
sys.query_store_runtime_stats_interval
sys.database_query_store_options
sys.query_context_settings
sys.query_store_query
sys.query_store_query_text
sys.query_store_plan
sys.query_store_runtime_stats
sys.query_store_runtime_stats_interval
Furthermore, a series of system stored procedures can be called:
此外,可以调用一系列系统存储过程:
sp_query_store_flush_db
sp_query_store_reset_exec_stats
sp_query_store_force_plan
sp_query_store_unforce_plan
sp_query_store_remove_plan
sp_query_store_remove_query
sp_query_store_flush_db
sp_query_store_reset_exec_stats
sp_query_store_force_plan
sp_query_store_unforce_plan
sp_query_store_remove_plan
sp_query_store_remove_query
如何使用查询存储 (How to use Query Store)
The Query Store comes with 4 standard reports as shown below:
查询存储附带4个标准报告,如下所示:
All standard reports can be modified in several ways to fit your personal needs. This is done by selection in drop-downs and point-and-click.
可以通过多种方式修改所有标准报告,以满足您的个人需求。 这是通过在下拉菜单中选择并单击鼠标来完成的。
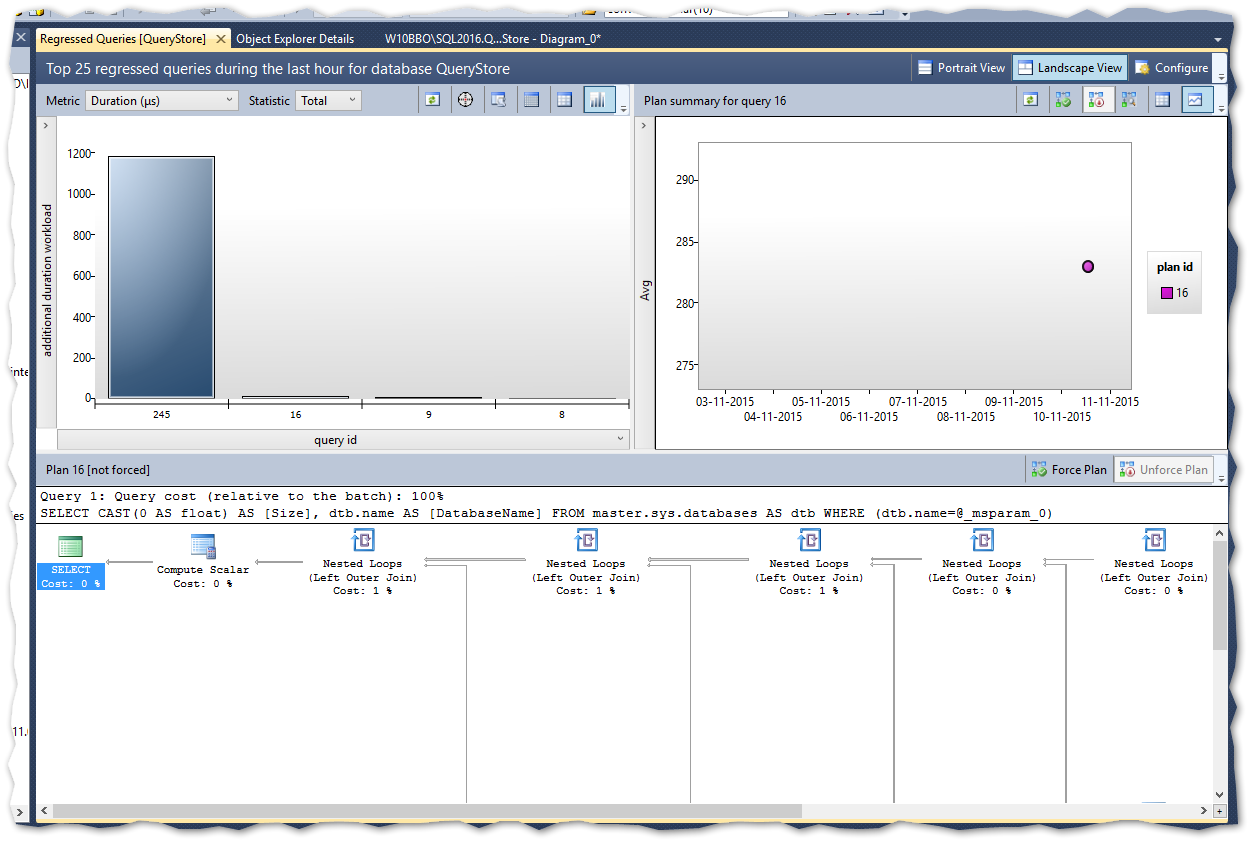
The Regressed Queries gives an overview of the top 25 most resource consuming queries in the last hour. This includes the execution plan, a time table to see when and for how long the query took to run etc.:
回归查询提供了最近一小时中最消耗资源的前25个查询的概述。 这包括执行计划,时间表以查看查询运行的时间和时间等。
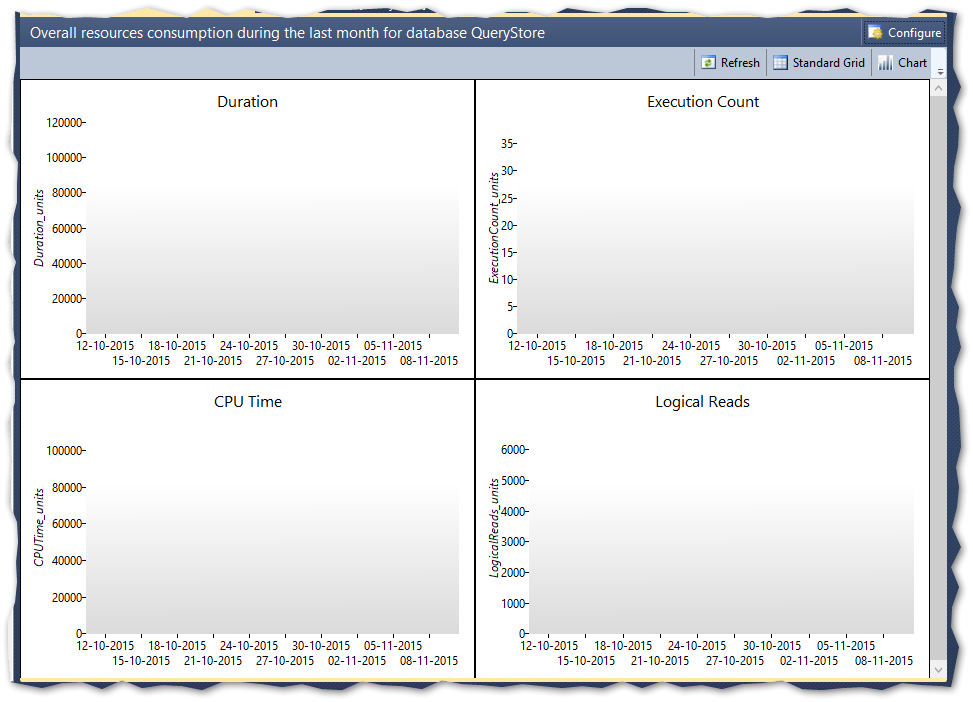
The Overall Resource Consumption shows 4 charts as standard based on duration, execution count, CPU time and Logical reads:
总体资源消耗根据持续时间,执行次数,CPU时间和逻辑读取显示4个标准图表:
The Top Resource Consuming Queries report shows in the same format as Regressed Queries only non-aggregated and with more details.
“ 资源消耗最多的查询”报告以与“ 回归查询 ”相同的格式显示 仅未汇总,并且具有更多详细信息。
The Tracked Queries report shows detailed data from the selected query – here you need to find and remember the query id – this can be found, among other ways, from below queries against the Query Store system views.
跟踪查询报告显示了所选查询的详细数据-在这里您需要查找并记住查询ID-除其他方法外,还可以从下面针对查询存储系统视图的查询中找到。
The data from the Query Store can be accessed from the above described system views. Examples of usage can be found below.
可以从上述系统视图访问查询存储中的数据。 使用示例可以在下面找到。
Top 5 queries with the longest average execution time the last hour
前一小时平均执行时间最长的前5个查询
SELECT TOP 5
   rs.avg_duration
   ,qt.query_sql_text
   ,rs.last_execution_time
FROM
   sys.query_store_query_text AS qt
   RIGHT JOIN sys.query_store_query AS q
      ON qt.query_text_id = q.query_text_id
   RIGHT JOIN sys.query_store_plan AS p
      ON q.query_id = p.query_id
   RIGHT JOIN sys.query_store_runtime_stats AS rs
      ON p.plan_id = rs.plan_id
WHERE  1=1
   AND rs.last_execution_time > DATEADD(hour, -1, GETUTCDATE())
ORDER BY
   rs.avg_duration DESC;
Last 10 queries executed on the server
在服务器上执行的最后10个查询
 SELECT TOP 10 qt.query_sql_text, q.query_id,
    qt.query_text_id, p.plan_id, rs.last_execution_time
FROM sys.query_store_query_text AS qt
JOIN sys.query_store_query AS q
    ON qt.query_text_id = q.query_text_id
JOIN sys.query_store_plan AS p
    ON q.query_id = p.query_id
JOIN sys.query_store_runtime_stats AS rs
    ON p.plan_id = rs.plan_id
ORDER BY rs.last_execution_time DESC;
Queries with more than one execution plan
具有多个执行计划的查询
SELECT
q.query_id
,qt.query_sql_text
,p.query_plan AS plan_xml
,p.last_execution_time
FROM (SELECT COUNT(*) AS count, q.query_id
FROM sys.query_store_query_text AS qt
JOIN sys.query_store_query AS q
    ON qt.query_text_id = q.query_text_id
JOIN sys.query_store_plan AS p
    ON p.query_id = q.query_id
GROUP BY q.query_id
HAVING COUNT(distinct plan_id) > 1) AS qm
JOIN sys.query_store_query AS q
    ON qm.query_id = q.query_id
JOIN sys.query_store_plan AS p
    ON q.query_id = p.query_id
JOIN sys.query_store_query_text qt
    ON qt.query_text_id = q.query_text_id
ORDER BY query_id, plan_id;
Source: Monitoring Performance By Using the Query Store
来源: 使用查询存储监视性能
对我有什么好处 (What’s in it for me)
Well, I hope that the answer to this is pretty obvious to you after reading this post 🙂
好吧,我希望阅读完这篇文章后答案对您来说很明显🙂
The Query Store feature enables any person responsible for database performance to monitor, analyze and keep track of queries, execution plans and resource usage through system views or standard reports from within SQL Server Management Studio.
使用查询存储功能,任何负责数据库性能的人员都可以通过SQL Server Management Studio中的系统视图或标准报告来监视,分析和跟踪查询,执行计划和资源使用情况。
结论 (Conclusion)
This new feature is a great add-on for the DBA (or accidental DBA) that needs to keep the analytical data in a standard form, and have an availability of query statistics and troubleshooting.
对于需要将分析数据保持为标准格式的DBA(或意外DBA)而言,此新功能是非常有用的附加功能,并且具有查询统计信息和故障排除功能。
This blogpost is based on the latest CTP of SQL Server 2016 (CTP 3.0) which can be downloaded here:
SQL Server Evaluations
此博客文章基于SQL Server 2016的最新CTP(CTP 3.0),可在此处下载:
SQL Server评估
翻译自: https://www.sqlshack.com/query-store-your-databases-flight-recorder/
–is-dba


 158
158

 被折叠的 条评论
为什么被折叠?
被折叠的 条评论
为什么被折叠?
 到【灌水乐园】发言


