


sql server 统计
With the release of SQL Server 2016 also comes a great new feature to get a live view of the current execution plan for an active query.
随着SQL Server 2016的发布,还提供了一项很棒的新功能,可以实时查看当前查询的执行计划。
This blogpost will cover the aspects of this new feature including:
该博客文章将涵盖此新功能的各个方面,包括:
- Introduction 介绍
- How to activate 如何激活
- How to use and read the output 如何使用和读取输出
- Downsides – if any 缺点–如果有的话
介绍 (Introduction)
The introduction of live query plans are in the current release of SQL Server 2016 CTP 2.2 a new feature from Microsoft, which hopefully will be in the final release.
在当前版本SQL Server 2016 CTP 2.2中,引入了实时查询计划,这是Microsoft的一项新功能,有望在最终版本中使用。
The feature provides real-time insights to the SQL Server engine’s query execution process. This in a visual matter when data flows from one plan operator to the next in the execution. The display will cover the usual elements of an execution plan – this including the number of rows handled, the time spend, progress of the single operators and other well-known statistics of a query execution.
该功能提供对SQL Server引擎的查询执行过程的实时见解。 当数据从一个计划操作员流向执行中的下一个计划员时,这在视觉上是可观的。 该显示将涵盖执行计划的常规元素–包括处理的行数,时间花费,单个运算符的进度以及其他众所周知的查询执行统计信息。
One of the good news in this feature is the ability to show and analyze the query even before it has finished. This is good when debugging complex queries – the operators are shown with their individual performance, giving the DBA or other persons responsible for the database a faster view of the places to make the performance optimization.
此功能的一个好消息是即使在查询完成之前也可以显示和分析查询。 当调试复杂的查询时,这很好–可以向操作员显示他们各自的性能,从而使DBA或其他负责数据库的人员可以更快地查看位置以进行性能优化。
激活 (Activation)
In SQL Server Management Studio, there is a new option when right clicking the query window – “Include Live Query Statistics”:
在SQL Server Management Studio中,右键单击查询窗口时有一个新选项–“包括实时查询统计信息”:
For some reason, there is no keyboard shortcut to activate that functionality. Maybe this will come in the RTM release of SSMS for SQL Server 2016.
由于某些原因,没有键盘快捷键可以激活该功能。 也许这将出现在SQL Server 2016的SSMS的RTM版本中。
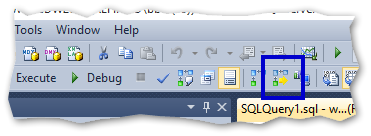
This function can also be activated from the top-menu in SSMS 2016 CTP 2.2:
也可以从SSMS 2016 CTP 2.2的顶部菜单激活此功能:
Note: this feature also works on SQL Server 2014 SP1 – as the feature relies on underlying DMV’s from this service pack.
注意:此功能还可以在SQL Server 2014 SP1上使用-因为该功能依赖于此Service Pack中的基础DMV。
If the session running the query has enabled either statistics XML (SET STATISTICS XML ON;) or statistics profile (SET STATISTICS PROFILE ON;) then the Live Query Statistics can also be reached from the activity monitor.
如果运行查询的会话已启用统计信息XML(SET STATISTICS XML ON;)或统计信息配置文件(SET STATISTICS PROFILE ON;),那么也可以从活动监视器访问实时查询统计信息。
The DBA can also activate a server wide setting to enable Live Query Statistics on all sessions with the extended event query_post_execution_showplan – for more info click here
DBA还可以激活服务器范围的设置,以使用扩展事件query_post_execution_showplan在所有会话上启用实时查询统计信息–有关更多信息,请单击此处。
Right click the current query in Active Expensive Queries and choose ‘Show Live Execution Plan’:
在Active Expensive Queries中右键单击当前查询,然后选择“显示实时执行计划”:
The observant reader will now ask – why are the names not the same across the SSMS? Well – I don’t know actually.
现在,细心的读者会问-为什么SSMS中的名称不同? 好吧-我真的不知道。
安全 (Security)
A database level SHOWPLAN is required to populate the Live Query Statistics and the server level VIEW SERVER STATE permission in order to see the live statistics.
需要数据库级别的SHOWPLAN来填充实时查询统计信息和服务器级别的VIEW SERVER STATE权限才能查看实时统计信息。
And voila!
瞧!
The query runs against an enlarged table from the AdventureWorksDW2012 with more than six mill. rows.
该查询针对的是来自AdventureWorksDW2012的扩展表,该表有6个以上的工厂。 行。
…and with a bit more complex query (not optimal query design at all):
…查询更加复杂(根本不是最佳查询设计):
输出 (The output)
The output from the Live Query Statistics can be read like any other execution plan. The operators are the same and the depper statistics can be revealed like usual with hovering the cursor on the single operators:
可以像其他任何执行计划一样读取实时查询统计信息的输出。 运算符相同,并且可以像往常一样通过将光标悬停在单个运算符上来显示depper统计信息:
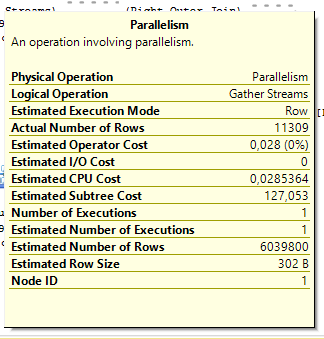
The data in these statistics will not change as the query runs – you have to move the cursor and hover again to get an updated info on the specific operators.
查询运行时,这些统计信息中的数据将不会更改–您必须移动光标并再次悬停以获取有关特定运算符的更新信息。
The DMV used is sys.dm_exec_query_profiles which can be queried and gives the same results in text-form as the graphic animations. But it is a lot more efficient and easier to decode the animations than the text-based results.
使用的DMV是sys.dm_exec_query_profiles ,可以查询该文本并以文本形式提供与图形动画相同的结果。 但是,与基于文本的结果相比,对动画进行解码的效率更高且更容易。
抓住 (The catch)
What great new feature – and it also works on SQL Server 2014 SP1 as mentioned earlier. But there is a catch – as always:
这是什么了不起的新功能-它也可以在前面提到SQL Server 2014 SP1上运行。 但是有一个陷阱-一如既往:
- If the query are using columnstore indexes then the live window will not show 如果查询使用列存储索引,则实时窗口将不会显示
- If the query are using tables that are memory optimized then the live window will not show 如果查询使用的是经过内存优化的表,则实时窗口将不会显示
- NSP (Natively Stored Procedures) are not supported 不支持NSP(本机存储过程)
It only works on SQL Server 2014 SP 1 and onwards. But who isn’t using one of those in production now .
它仅适用于SQL Server 2014 SP 1及更高版本。 但是谁现在不使用生产中的一种。
结论 (Conclusion)
The new feature Live Query Statistics are great for performance tuning of queries and the DBA that want to see the live performance of data loading in the database. The feature works like a charm and is, from my perspective, a nice feature.
新功能“实时查询统计”非常适合查询的性能调整和想要查看数据库中数据加载实时性能的DBA。 从我的角度来看,该功能就像一个魅力一样,是一个不错的功能。
I hope this post makes a great start for you to work with the Live Query Statistics. This post is written based on the current CTP of SQL Server 2016 (CTP 2.2) which can be downloaded here.
我希望这篇文章为您使用实时查询统计信息提供了一个良好的开端。 这篇文章是根据SQL Server 2016(CTP 2.2)的当前CTP编写的,可以在此处下载。
If the feature is updated in later versions of SQL Server 2016, then this post will be updated accordingly.
如果此功能在更高版本SQL Server 2016中进行了更新,则此帖子将进行相应的更新。
翻译自: https://www.sqlshack.com/behold-the-new-live-query-stats-in-sql-server-2016/
sql server 统计


 227
227

 被折叠的 条评论
为什么被折叠?
被折叠的 条评论
为什么被折叠?
 到【灌水乐园】发言


