


 本文详细介绍了如何在SQL、Power BI和Excel中计算移动平均值。通过示例,展示了如何在SQL中利用窗口函数计算移动平均,以及在Power BI和Excel中设置移动平均线的过程,帮助读者理解在不同平台上进行数据平滑分析的方法。
sql power bi
In this article, I’m going to talk in detail about the moving average in SQL and how to find out the same in Power BI and Excel. This might be a new topic for many newbies who have started out in this field, but I’m sure this will help anyone who is trying to work on smoothing averages in SQL or in Power BI.
在本文中,我将详细讨论SQL中的移动平均线以及如何在Power BI和Excel中找到相同的移动平均线。 对于这个领域的许多新手来说,这可能是一个新话题,但是我敢肯定,这将对试图在SQL或Power BI中平滑平均值的任何人有所帮助。
Moving Average in SQL or Power BI, as it goes by the name, is a type of average function that is moving; in other words, it is calculated over a period. This is an important scenario while dealing in finance where often analysts tend to work on smoothing the stock prices, for example, over a period and find out the trend of the prices. This trend then aids in defining whether the average is an upward or downward moving trend. This article will focus on how to calculate the moving average in SQL and then we will look at an example to implement the same in Power BI and Excel as well. It is also known by Rolling Average or Running Average.
顾名思义,SQL或Power BI中的移动平均线是一种正在移动的平均函数。 换句话说,它是在一段时间内计算得出的。 这是在进行金融交易时的一种重要情况,在这种情况下,分析师通常倾向于在一段时间内努力使股票价格趋于平稳,并找出价格趋势。 然后,该趋势有助于定义平均值是上升还是下降趋势。 本文将重点介绍如何在SQL中计算移动平均值,然后我们来看一个在Power BI和Excel中也实现同样的示例。 也称为滚动平均或运行平均。
For the sake of this article, we will try to analyze the share price of Facebook, the data of which is easily available to download from yahoo finance website. I have downloaded the data for the last 5 years and saved it in a CSV file.
为了本文的目的,我们将尝试分析Facebook的股价,该数据很容易从yahoo金融网站上下载。 我已经下载了过去5年的数据,并将其保存在CSV文件中。
SQL中的移动平均线 (Moving Average in SQL)
To begin with, let us first import the CSV file into SQL Server so that we can execute our queries accordingly.
首先,让我们首先将CSV文件导入SQL Server,以便我们可以相应地执行查询。
Right-click on the Database on which you wish to import the data and select Tasks and then select Import Flat File. Proceed through the dialog boxes and get it imported into the database.
右键单击要在其上导入数据的数据库 ,然后选择“ 任务” ,然后选择“ 导入平面文件” 。 继续执行对话框,然后将其导入数据库。
Once the data is imported into a table in SQL, we can go ahead and execute our queries. In this article, I’m going to use the WINDOW function in SQL – the OVER clause to calculate the average of every row with consideration of the values from the records before and after that specific row.
将数据导入SQL中的表后,我们可以继续执行查询。 在本文中,我将使用SQL中的WINDOW函数– OVER子句 ,并考虑到该特定行之前和之后的记录中的值,计算每行的平均值。
Now that our data is ready, let us try to calculate a moving average in SQL of 5 days on the closing prices. This means each row will consider 2 rows both before and after the current record, calculate the sum of the price and then divide it by 5. For the first row, since there are no rows before that, the logic remains the same, but only the 2 later records are calculated. Similar is the case for the last record where only the 2 previous records will be calculated since there are no records after that.
现在我们的数据已经准备好,让我们尝试用SQL收盘价计算5天的移动平均线。 这意味着每行将在当前记录之前和之后考虑2行,计算价格总和,然后将其除以5。对于第一行,由于在此之前没有行,因此逻辑保持不变,但仅计算后的2条记录。 最后一条记录的情况与此类似,因为仅计算前2条记录,因为此后没有记录。
SELECT
  [Date]
  ,[Close]
  ,AVG([Close]) OVER (
    ORDER BY [Date]
    ROWS BETWEEN 2 PRECEDING AND 2 FOLLOWING
  ) MovingAverageFiveDay
FROM [FB]
This is not all. This technique can be applied to calculate the moving average in SQL for different periods based on the requirement. If we want to calculate the moving average of 15 days, such that it can include 7 previous and 7 next days, we can just rewrite the query as follows.
这还不是全部。 可以根据需要将该技术应用于计算不同时期SQL移动平均值。 如果我们要计算15天的移动平均值,以使其可以包括前7天和后7天,则可以按如下所示重写查询。
SELECT
  [Date]
  ,[Close]
  ,AVG([Close]) OVER (
    ORDER BY [Date]
    ROWS BETWEEN 7 PRECEDING AND 7 FOLLOWING
  ) MovingAverageFifteenDay
FROM [FB]
As you can see in the figure above, the average is now based upon 7 previous and 7 next records, including the current one.
正如您在上图中所看到的,现在的平均值是基于前7条和后7条记录(包括当前记录)。
Power BI中的移动平均线 (Moving Average in Power BI)
Power BI as we all know is one of the most fantastic tools in the visualization world. One of the main advantages of using Power BI is that it helps us with some pre-defined calculations, which we can create just with a few clicks without writing a single line of DAX. Of course, you can write your own DAX in case you want to customize; however, the New Quick Measure really does the tough job.
众所周知,Power BI是可视化领域中最出色的工具之一。 使用Power BI的主要优点之一是,它可以帮助我们进行一些预定义的计算,我们只需单击几下就可以创建这些计算,而无需编写一行DAX。 当然,您可以编写自己的DAX以防自定义; 但是, 新的快速衡量确实确实很难。
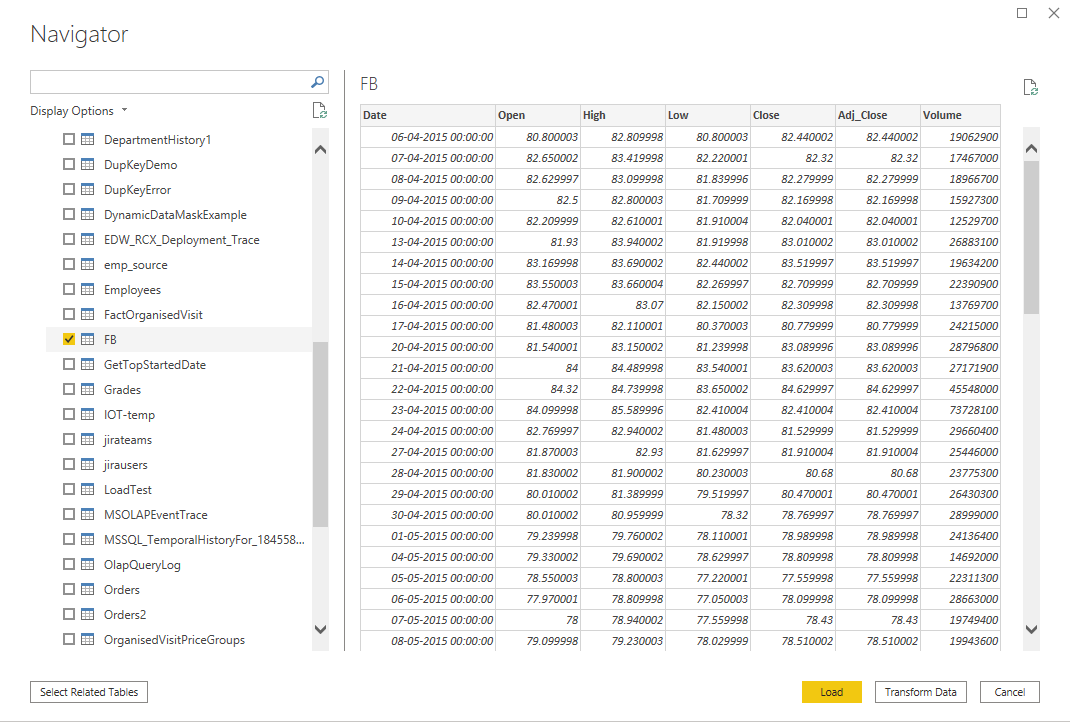
Let us first fetch the data into the Power BI data model. Select Get Data and then from SQL Server. Provide the necessary details and get the data imported into the data model. Click Load once completed and the data will be imported.
让我们首先将数据提取到Power BI数据模型中。 选择获取数据 ,然后从SQL Server中选择 。 提供必要的详细信息,并将数据导入到数据模型中。 完成后单击“ 加载” ,数据将被导入。
Once the data is imported, click on the “Line and Clustered Column Chart” and drag and drop the Date to the Axis and the Close to the Column Values pane. Also, an important thing to note here is that since the dataset has five years of data, we will only visualize it by months and remove the Day from the hierarchy.
导入数据后,单击“ 折线和聚簇柱形图 ”,然后将“ 日期 ”拖放到“ 轴”和“ 靠近 列值”窗格中。 另外,这里要注意的重要一点是,由于数据集具有五年的数据,因此我们只能按月可视化它,并从层次结构中删除“ 天 ”。
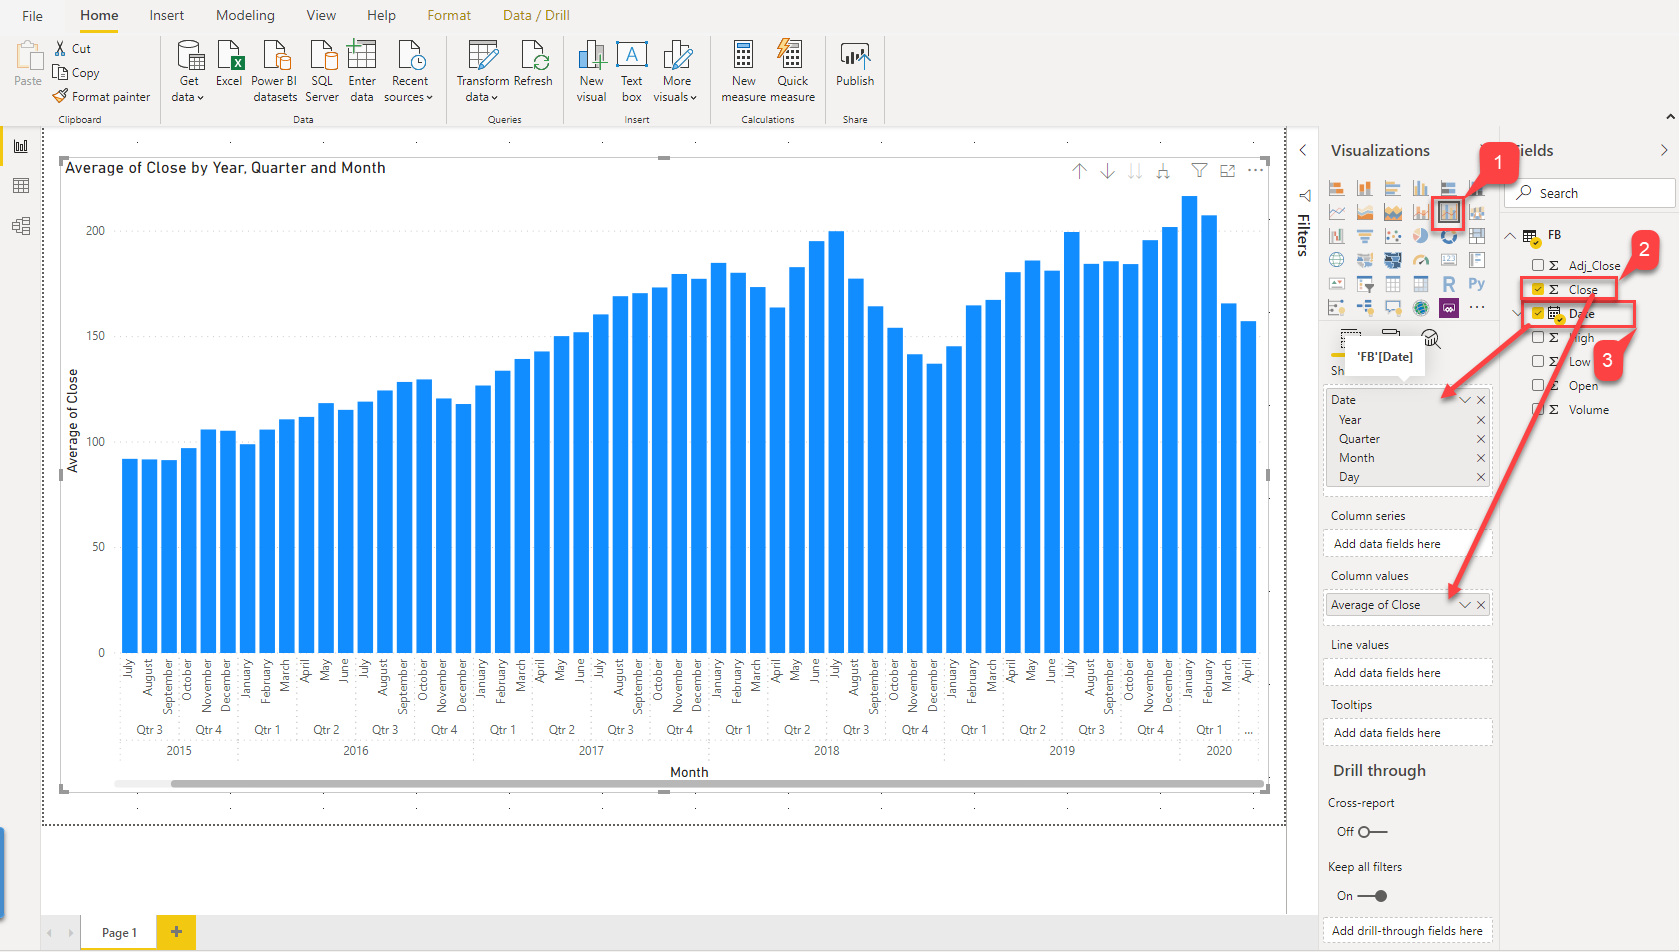
Once the visualization is ready, the next step is to create the new calculated measure that will store the moving average. Right-click the Date hierarchy and select New Quick Measure from the context menu.
可视化准备就绪后,下一步就是创建新的计算得出的度量,该度量将存储移动平均值。 右键单击“ 日期”层次结构,然后从上下文菜单中选择“ 新建快速度量 ”。
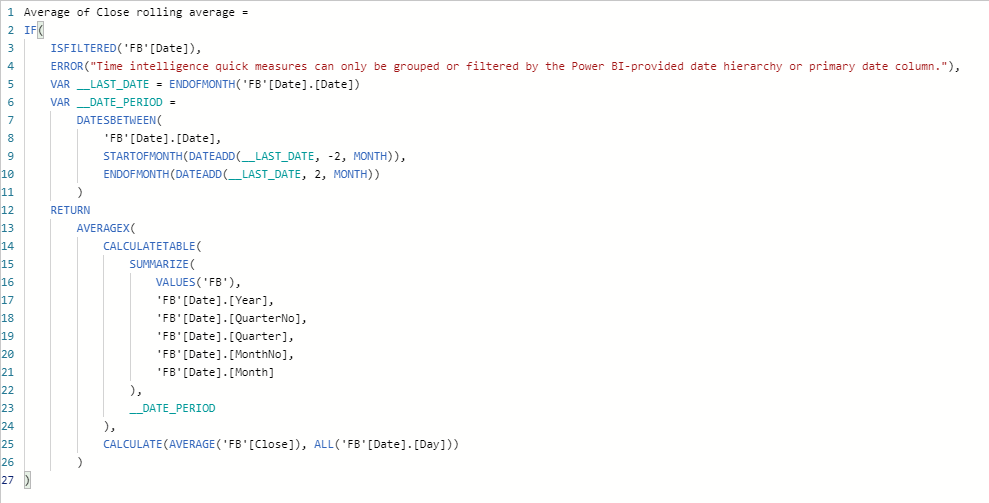
In the new dialog box that appears, select the Calculation as Rolling Average and the Base Value as Average of Close (since we want to calculate the MA based on the closing price). Select the period for which the rolling average is to be calculated. In this example, I’m going to calculate it based on 7 months before and after the actual month, basically a fifteen-month moving average. Click OK once done.
在出现的新对话框中,选择“ 计算”作为“ 滚动平均值 ”,然后选择“ 基值”作为“收盘平均值” ( 因为我们要根据收盘价计算均线 )。 选择要计算滚动平均值的时间段。 在此示例中,我将基于实际月份前后的7个月(基本上是15个月的移动平均值)进行计算。 完成后,单击“ 确定” 。
Once you finish defining the configuration, a new measure will be created by the name “Average of Close Rolling Average”. You can also see the underlying DAX formula that the Power BI engine automatically generates for us.
完成定义配置后,将使用名称“ Close Rolling Average的平均值 ”创建一个新度量。 您还可以查看Power BI引擎自动为我们生成的基础DAX公式。
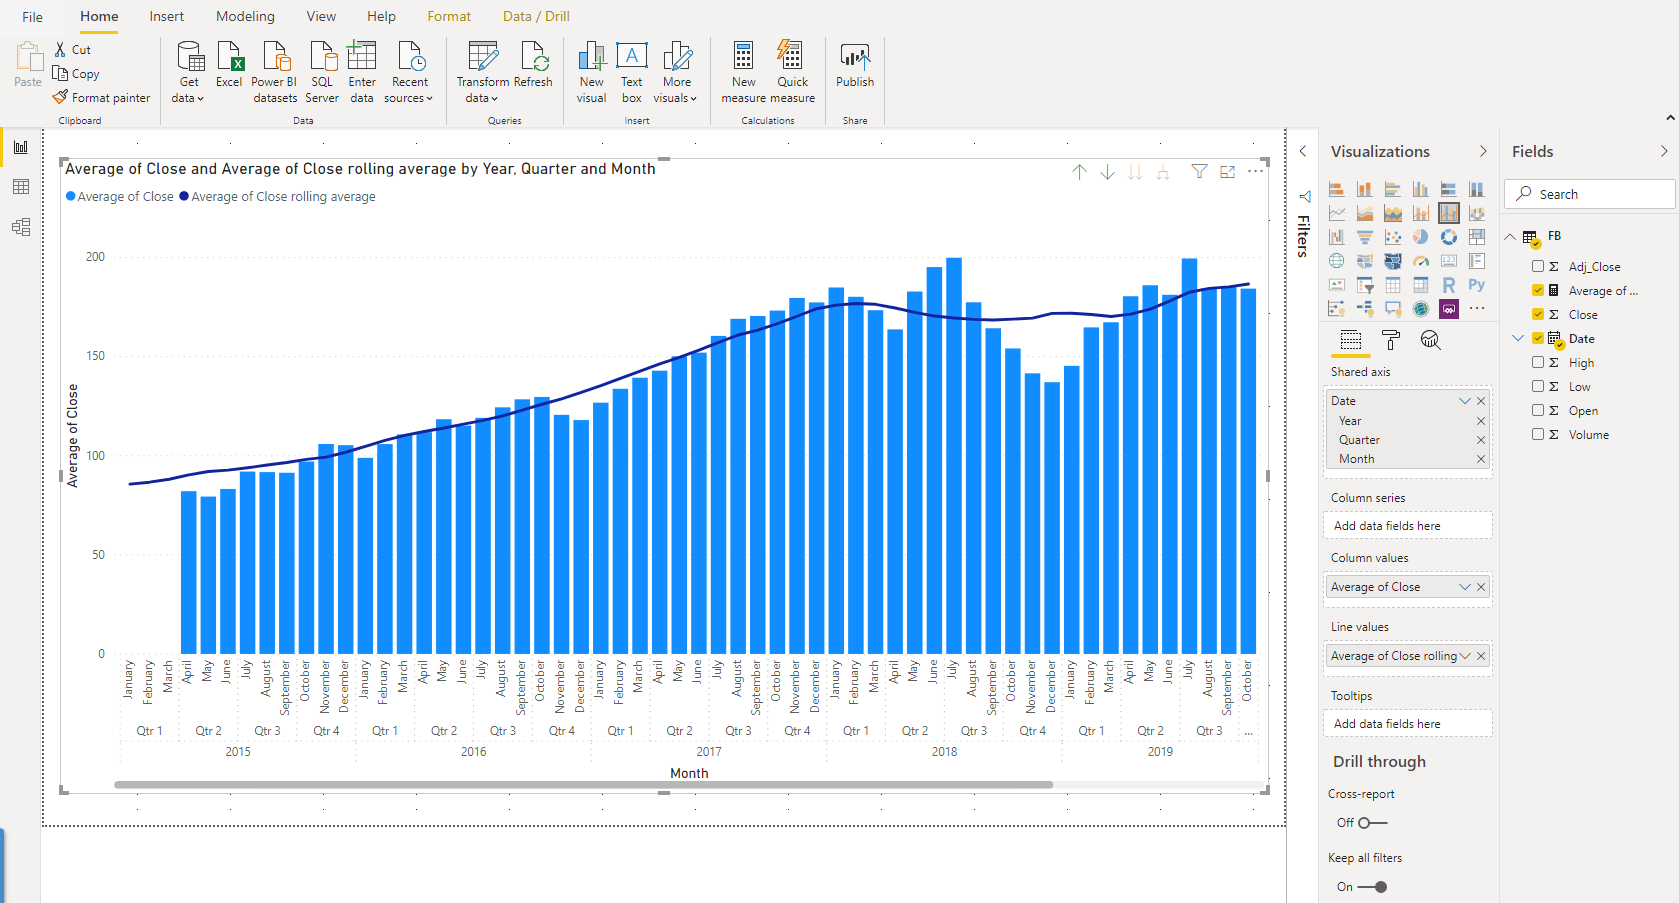
Once the new measure is created, just drag and drop it into the Line Values pane. You can see a new line will be displayed on the chart which will give us the running average of the fifteen months.
创建新度量后,只需将其拖放到“ 线值”窗格中即可。 您会看到一条新线将显示在图表上,这将为我们提供15个月的运行平均值。
Excel中的移动平均线 (Moving Average in Excel)
Excel has always been a go-to tool for many people for a long time now, and hence, it is also extremely important to be able to perform such kind of calculations with ease. Excel provides an add-in for Data Analysis purposes, which needs to be imported into Excel before performing the analysis.
Excel长期以来一直是许多人的首选工具,因此,能够轻松执行此类计算也非常重要。 Excel提供了一个用于数据分析的加载项,需要在执行分析之前将其导入Excel。
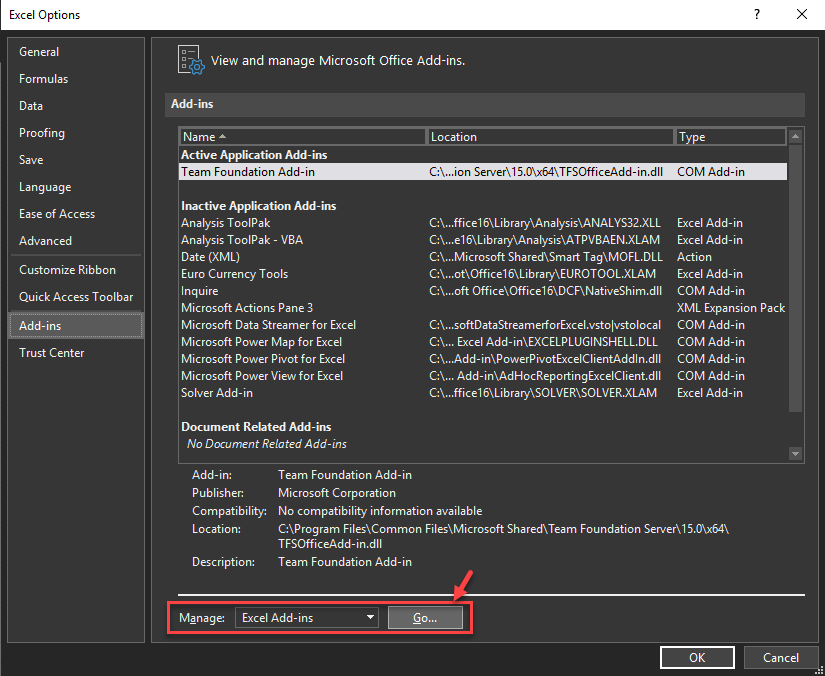
Open the CSV file that you have downloaded earlier from the yahoo portal and save it as an excel file. Click on Home on the ribbon bar and then select Options.
打开您先前从yahoo门户下载的CSV文件,并将其另存为excel文件。 单击功能区栏上的主页 ,然后选择选项 。
In the Excel Options dialog box that opens, select Excel Add-ins against Manage and click on Go.
在打开的“ Excel选项”对话框中,针对“ 管理”选择“ Excel加载项” ,然后单击“ 转到” 。
In the Add-ins dialog box, select the Analysis ToolPak and click OK.
在“ 加载项”对话框中,选择“ 分析工具库” ,然后单击“ 确定” 。
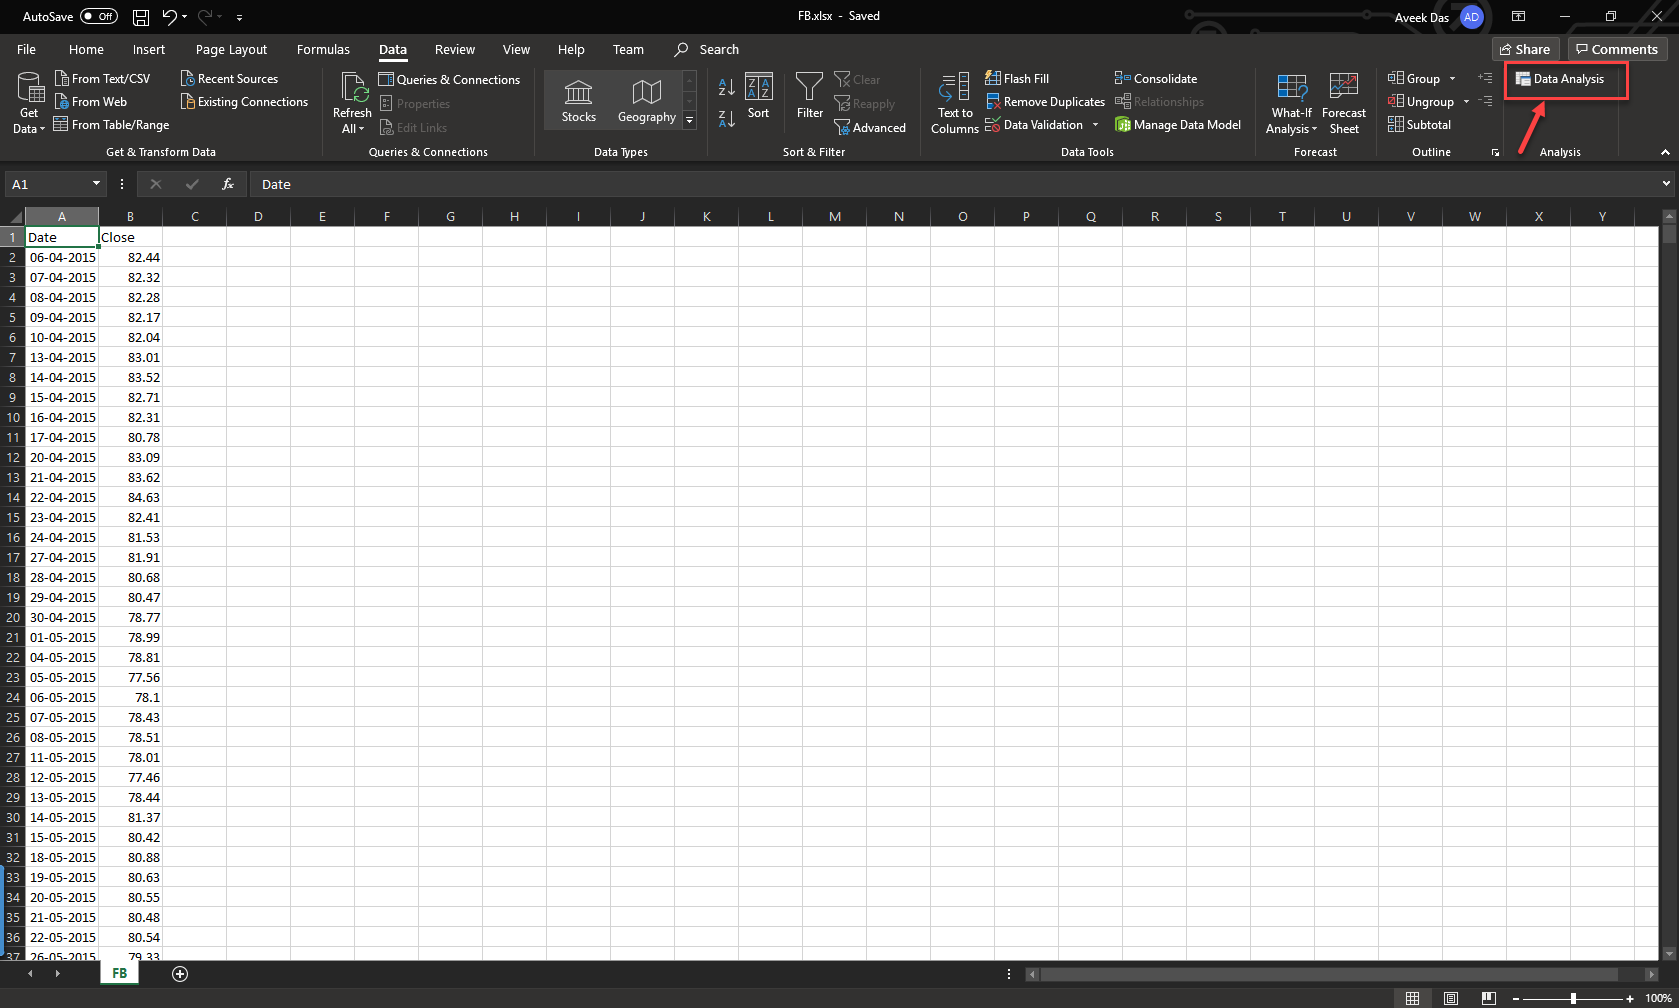
From the Data tab, click on the Data Analysis button under the Analysis pane in the ribbon.
在“ 数据”选项卡中,单击功能区“ 分析”窗格下的“ 数据分析”按钮。
Select Moving Average and click OK.
选择移动平均线 ,然后单击确定 。
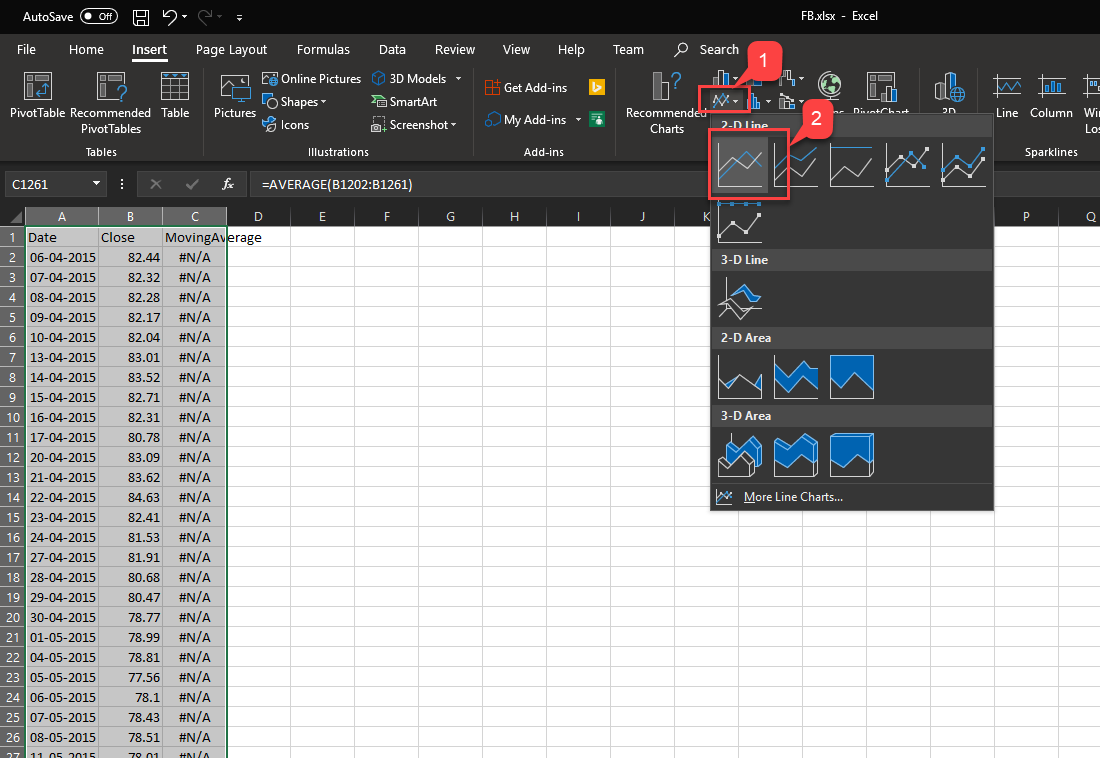
In the next dialog box that appears, select the Input Range from the column values in the Excel sheet. Define how many intervals should the rolling average has to be calculated. For this example, I want to smooth the average for 60 intervals. Click OK once done. This will add a new column, which is defined by the Output Range cells. Let the name for this column be MovingAverage.
在出现的下一个对话框中,从Excel工作表的列值中选择“ 输入范围 ”。 定义应该计算滚动平均值的间隔时间 。 对于此示例,我想对60个间隔的平均值进行平滑处理。 完成后,单击“ 确定” 。 这将添加一个新列,该列由“ 输出范围”单元格定义。 让此列的名称为MovingAverage 。
Once the new field is added, select the entire dataset and click on the Insert tab. Select the Line Chart, as shown in the figure below and plot it on the sheet.
添加新字段后,选择整个数据集,然后单击“ 插入”选项卡。 选择折线图,如下图所示,并将其绘制在图纸上。
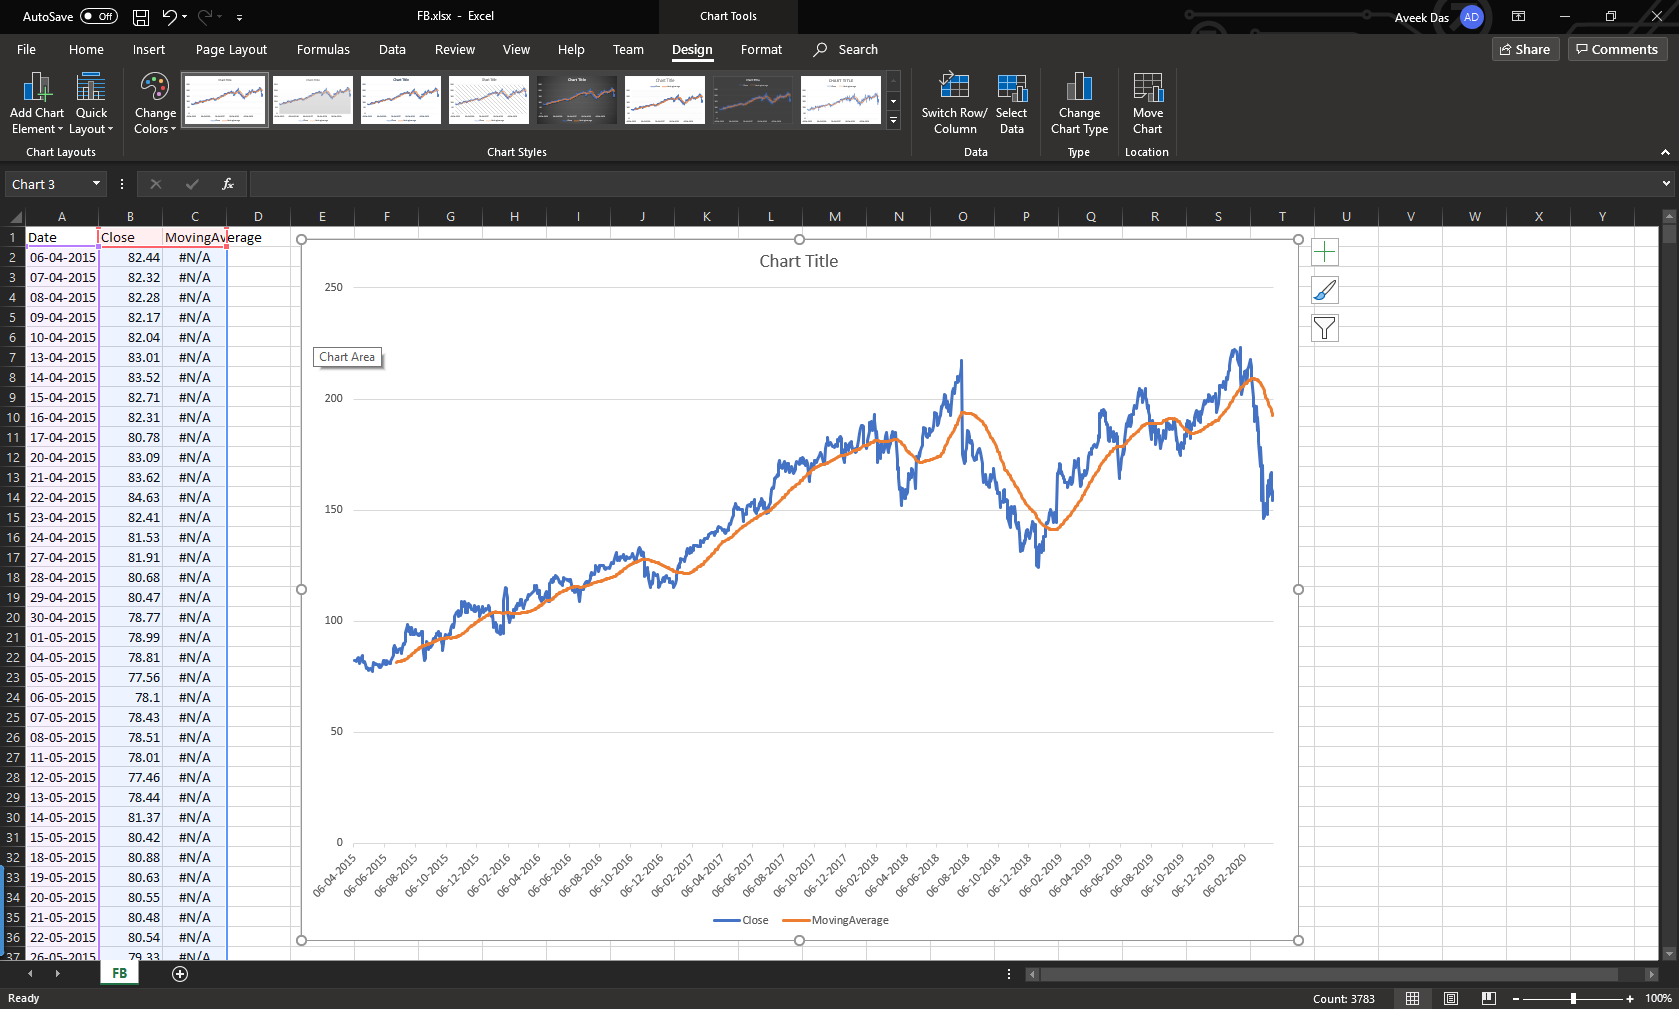
Two lines will be displayed in the chart, as shown in the figure below. The blue line represents the original value from the dataset, whereas the orange line represents the rolling average of the selected periods. In this way, we can easily smooth out the original curve and plot a rolling average calculation in Excel.
图表中将显示两行,如下图所示。 蓝线表示数据集的原始值,而橙线表示所选期间的滚动平均值。 这样,我们可以轻松平滑原始曲线并在Excel中绘制滚动平均值计算。
结论 (Conclusion)
In this article, we have seen what a moving average in SQL is and how to calculate one. I have also explained how to implement the same with examples in Power BI and Excel.
在本文中,我们了解了什么是SQL移动平均值以及如何计算平均值。 我还解释了如何使用Power BI和Excel中的示例来实现相同的功能。
翻译自: https://www.sqlshack.com/calculate-moving-average-in-sql-power-bi-and-ms-excel/
sql power bi


 1374
1374

 被折叠的 条评论
为什么被折叠?
被折叠的 条评论
为什么被折叠?
 到【灌水乐园】发言


