


SQL Server Query Store is a new feature introduced in SQL Server 2016 that is used to automatically and asynchronously capture query execution history, statistics and plans, with minimal impact to overall SQL Server Performance. The Query Store feature makes performance problem troubleshooting simple; you can view the query execution plans changes and compare its performance to decide which execution plan the SQL Server Query Optimizer should use for that query.
SQL Server查询存储是SQL Server 2016中引入的一项新功能,用于自动和异步捕获查询执行历史记录,统计信息和计划,而对整体SQL Server性能的影响最小。 查询存储功能使性能问题的故障排除变得简单。 您可以查看查询执行计划的更改并比较其性能,以决定SQL Server Query Optimizer应该对该查询使用哪个执行计划。
By default, SQL Server keeps the latest execution plan only for the query, and any schema, statistics or indexes changes could change the query execution plan that is used by the Query Optimizer. The plan can be also dropped due to pressure in the plan cache memory. Not all changes in the execution plans will enhance the query performance, such changes could cause degradation in the query performance.
默认情况下,SQL Server仅保留查询的最新执行计划,并且任何架构,统计信息或索引更改都可能会更改查询优化器使用的查询执行计划。 由于计划缓存中的压力,该计划也可能会被删除。 并非执行计划中的所有更改都会增强查询性能,此类更改可能会导致查询性能下降。
What gives this feature value over monitoring the query performance using the classic system DMVs, is that the Query Store data is available after restarting or upgrading the SQL Server instance. It also allows you to choose the execution plan that will be followed to run the query, rather than using the one preferred by the SQL Server Query Optimizer.
与使用经典系统DMV监视查询性能相比,此功能的价值在于,在重新启动或升级SQL Server实例之后可以使用查询存储数据。 它还允许您选择运行查询所遵循的执行计划,而不是使用SQL Server查询优化器首选的执行计划。
The SQL Server Query Store consists of two main store parts; the Plan Store, where the execution plans information stored, and the Runtime State Store, where the execution statistics will be stored. The query execution statistics and plans are stored first in memory, and flushed to the disk after a specific interval of time. In this way, the Query Store information will not be lost when the SQL Server service is restarted, as the data is hardened to the disk. The default flush to disk configurable database option DATA_FLUSH_INTERNAL_SECONDS value is 15 minutes, this means that, the executed queries information will be written to the disk from the Query Store every 15 minutes. The smaller flush interval, the more frequent write-to-disk operations, the worst SQL performance. The Query Store data will be flushed automatically to the disk to release the memory for other processes if there is a memory pressure. For proper memory and space usage for the Query Store, the execution information is aggregated in the memory first over fixed interval of time, and then flushed to the disk in aggregated form. The max_plans_per_query option can be used to control the number of plans that will be stored for review.
SQL Server查询存储由两个主要的存储部分组成: 计划存储 ,其中存储了执行计划信息; 运行时状态存储,其中存储了执行统计信息。 查询执行统计信息和计划首先存储在内存中,并在特定时间间隔后刷新到磁盘。 这样,重新启动SQL Server服务时,查询存储信息将不会丢失,因为数据已被加固到磁盘上。 默认刷新到磁盘可配置数据库选项DATA_FLUSH_INTERNAL_SECONDS值为15分钟,这意味着执行的查询信息将每15分钟从查询存储写入磁盘一次。 刷新间隔越小,写磁盘操作越频繁,SQL性能越差。 如果存在内存压力,查询存储数据将自动刷新到磁盘以释放内存,以供其他进程使用。 为了使查询存储正确使用内存和空间,执行信息将首先在固定的时间间隔内在内存中聚合,然后以聚合形式刷新到磁盘。 max_plans_per_query选项可用于控制将存储以供审核的计划的数量。
SQL Server Query Store provides you with an easy way to troubleshoot query performance, where you can identify the top CPU, Memory and IO consuming queries, with full execution history for these queries in addition to find which and when the query performance regressed and fix it directly by forcing the best plan, preventing the SQL Server Query Optimizer from using the less efficient new plan. It also can be used to draw a general image about the workload of your environment, with the query text, execution plans, the number of executions and SQL Server resources utilization, which can help you in evaluating how much resources required by your SQL Server database.
SQL Server查询存储为您提供了一种解决查询性能问题的简便方法,您可以在其中确定最消耗CPU,内存和IO的查询,以及这些查询的完整执行历史记录,以及查找哪些查询性能以及何时降低查询性能并进行修复。通过强制执行最佳计划直接避免了SQL Server查询优化器使用效率较低的新计划。 它还可以用来绘制有关环境工作负载的一般图像,包括查询文本,执行计划,执行次数和SQL Server资源利用率,这可以帮助您评估SQL Server数据库所需的资源量。 。
When the query is executed for its first time, the query execution plan with full query properties and statistics will be stored in the Query Store internal tables. If you run the query again and the SQL Server Query Optimizer decides to recompile the query and create a new execution plan, this plan will be added to the Query Store, in addition to the old one, with the plan and query execution statistics. Query Store allows you to track the queries execution plans and performance changes, and enforce the plan that the query behaves better when you execute the query with it. When a query is compiled, the SQL Server Query Optimizer will take the latest plan in the plan cache if it is still useful, unless a PLAN HINT is used, or another plan is forced by the Query Store. In this case, the Query Optimizer will recompile the query and use that new plan. No change is required from the application side to perform that, as this is performed transparently from the users.
首次执行查询时,具有完整查询属性和统计信息的查询执行计划将存储在查询存储内部表中。 如果再次运行查询,并且SQL Server Query Optimizer决定重新编译查询并创建一个新的执行计划,则除了旧计划外,该计划还将连同计划和查询执行统计信息一起添加到查询存储中。 使用查询存储,您可以跟踪查询执行计划和性能更改,并强制执行计划,以使其在执行查询时表现更好。 编译查询时,如果SQL Server Query Optimizer仍然有用,则它将在计划缓存中获取最新计划,除非使用了PLAN HINT或查询存储强制使用了另一个计划。 在这种情况下,查询优化器将重新编译查询并使用该新计划。 应用程序不需要更改即可执行,因为这是对用户透明的。
To start using the new Query Store feature, you need to enable it at the database level, then it will start capturing the queries execution statistics and plans automatically. The below ALTER DATABASE statement is used to enable the Query Store feature on the SQLShackDemo database , which is disabled by default, and specify the operation mode for that feature:
要开始使用新的查询存储功能,您需要在数据库级别启用它,然后它将开始自动捕获查询执行统计信息和计划。 下面的ALTER DATABASE语句用于在默认情况下禁用SQLShackDemo数据库上启用查询存储功能,并指定该功能的操作模式:
USE [master]
GO
ALTER DATABASE [SQLShackDemo] SET QUERY_STORE = ON
GO
ALTER DATABASE [SQLShackDemo] SET QUERY_STORE (OPERATION_MODE = READ_WRITE)
GO
You can also use the SQL Server Management Studio to enable the Query Store, from the Database Properties window below, where you can find the new Query Store tab introduced when you use the SQL Server 2016 version:
您还可以使用SQL Server Management Studio在下面的数据库属性窗口中启用查询存储,在这里您可以找到使用SQL Server 2016版本时引入的新查询存储选项卡:
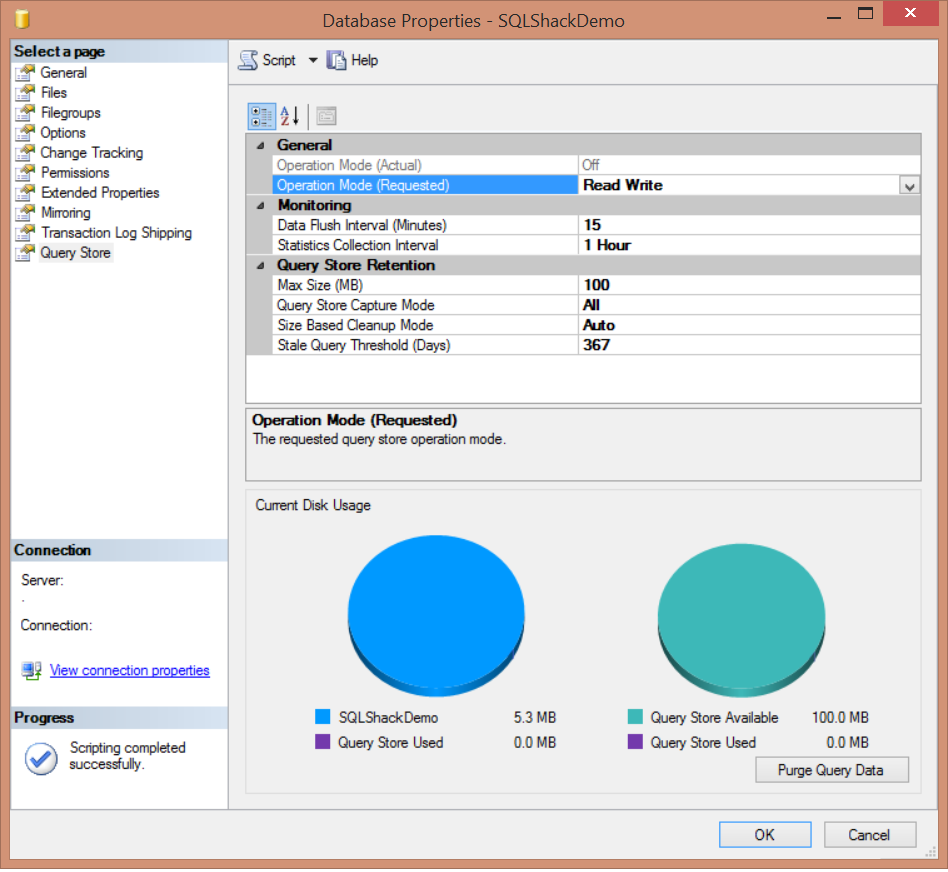
As you can see from the previous image, SQL Server Query Store can be run in two operation modes; Read-Only mode, where you can only use the persisted statistics to analyze the queries , without capturing any new data. This occurrs when the Query Store reaches its maximum allocation space. In Read-Write mode, the Query Store will capture the execution statistics for the current workload and store it, to be used for analyzing the queries execution performance. The DATA_FLUSH_INTERVAL_SECONDS option determines how frequent the Query Store data stored in the memory will be asynchronously transferred to the disk. By default, SQL Server will write the in-memory Query Store statistics to the disk every 15 minutes, or 900 seconds. You can also flush the Query Store data manually from the memory to the disk by executing the below query:
从上图中可以看到,SQL Server查询存储可以在两种操作模式下运行: 只读模式,在此模式下,您只能使用持久统计信息来分析查询,而不能捕获任何新数据。 当查询存储达到其最大分配空间时,就会发生这种情况。 在读写模式下,查询存储将捕获当前工作负载的执行统计信息并将其存储,以用于分析查询的执行性能。 DATA_FLUSH_INTERVAL_SECONDS选项确定内存中存储的查询存储数据被异步传输到磁盘的频率。 默认情况下,SQL Server将每15分钟或900秒将内存中的查询存储统计信息写入磁盘。 您还可以通过执行以下查询,将查询存储数据从内存手动刷新到磁盘:
USE SQLShackDemo
GO
EXEC sys.sp_query_store_flush_db
The maximum size of data that can be stored in the Query Store can be controlled by the MAX_STORAGE_SIZE_MB option. As mentioned previously, exceeding that limit will change the Query Store operation mode to Read-Only mode automatically. By default, the Query Store can keep up to 100 MB of query statistical data before transferring to the Read-Only operation mode. You can make sure that the Query Store will activate the cleanup process if the execution data exceeds the MAX_STORAGE_SIZE_MB value by setting the SIZE_BASED_CLEANUP_MODE to AUTO, which is the default value, or turn it OFF to stop the automatic cleanup process.
可以存储在查询存储中的最大数据大小可以由MAX_STORAGE_SIZE_MB选项控制。 如前所述,超过该限制将自动将查询存储操作模式更改为只读模式。 默认情况下,查询存储最多可以保留100 MB的查询统计数据,然后再转换为只读操作模式。 您可以通过将SIZE_BASED_CLEANUP_MODE设置为默认值AUTO来确保如果执行数据超过MAX_STORAGE_SIZE_MB值,查询存储将激活清理过程,或者将其关闭以停止自动清理过程。
The QUERY_CAPTURE_MODE option specifies if the Query Store will capture ALL queries, or ignore the queries that are not running frequently or running on a very small time with AUTO capture mode or stop capturing any new query using the NONE capture mode. The number of days to keep the Query Store data is specified by the STALE_QUERY_THRESHOLD_DAYS parameter.
QUERY_CAPTURE_MODE选项指定查询存储将捕获所有查询,还是忽略使用AUTO捕获模式不经常运行或运行时间非常短的查询,或者停止使用NONE捕获模式停止捕获任何新查询。 保留查询存储数据的天数由STALE_QUERY_THRESHOLD_DAYS参数指定。
As mentioned previously in this article, query execution statistics data is aggregated in memory and later flushed to Query Store internal tables to optimize the space usage. The aggregation process is performed over a fixed time interval that is controlled by the INTERVAL_LENGTH_MINUTES parameter, which is 60 minutes by default.
如本文前面所述,查询执行统计数据将聚集在内存中,然后刷新到查询存储内部表以优化空间使用率。 聚合过程在由INTERVAL_LENGTH_MINUTES参数控制的固定时间间隔内执行,默认情况下为60分钟。
You can also find other useful information in the Query Store page under the Database Properties window, such as the Query Store disk usage in the current database and disk space used by the Query Store internal tables. This page allows you to delete or purge the Query Store data by clicking on the Purge Query Data at the right bottom part of the window:
您还可以在“数据库属性”窗口下的“查询存储”页面中找到其他有用的信息,例如当前数据库中的查询存储磁盘使用情况以及查询存储内部表使用的磁盘空间。 该页面允许您通过单击窗口右下角的“ 清除查询数据”来删除或清除查询存储数据:
Or use the below ALTER statement to purge the content of the Query Store:
或使用下面的ALTER语句清除查询存储的内容:
ALTER DATABASE [SQLShackDemo] SET QUERY_STORE CLEAR
SQL Server introduced 6 new system stored procedures and 7 new system views to check the Query Store feature information and deal with it. These system objects can be listed by querying the sys.all_objects system table as below:
SQL Server引入了6个新的系统存储过程和7个新的系统视图,以检查并处理查询存储功能信息。 可以通过查询sys.all_objects系统表来列出这些系统对象,如下所示:
USE master
GO
SELECT Name as ObjectName , type_desc as ObjectType
FROM sys.all_objects
WHERE name LIKE '%query_store%'
or name= 'query_context_settings'
The result will be like:
结果将如下所示:
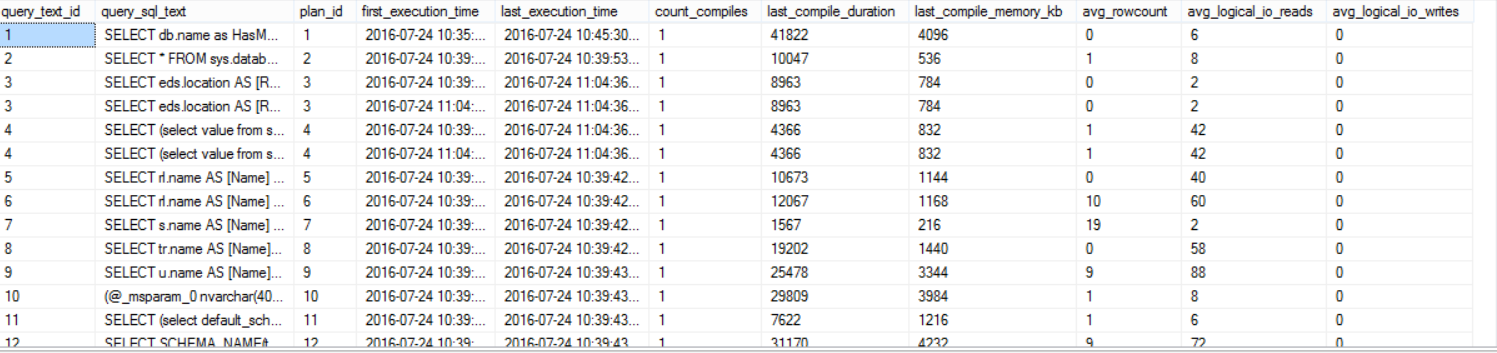
The sys.query_store_plan, sys.query_store_query, and sys.query_store_query_text system tables can be used to get the current query plans in the Query Store. To show you up-to-date statistics, the data stored in the disk and the current data in the memory will be merged together to provide toy with full image as follows:
sys.query_store_plan,sys.query_store_query和sys.query_store_query_text系统表可用于获取查询存储中的当前查询计划。 为了向您显示最新的统计信息,磁盘中存储的数据和内存中的当前数据将合并在一起,以提供具有完整图像的玩具,如下所示:
SELECT QST.query_text_id,
QST.query_sql_text,
QSP.plan_id,
QSRS.first_execution_time,
QSQ.last_execution_time,
QSQ.count_compiles,
QSQ.last_compile_duration,
QSQ.last_compile_memory_kb,
QSRS.avg_rowcount,
QSRS.avg_logical_io_reads,
QSRS.avg_logical_io_writes
FROM sys.query_store_plan AS QSP
JOIN sys.query_store_query AS QSQ
    ON QSP.query_id = QSQ.query_id
JOIN sys.query_store_query_text AS QST
    ON QSQ.query_text_id = QST.query_text_id
JOIN sys.query_store_runtime_stats  QSRS
   ON QSP.plan_id =QSRS.plan_id
The result will be like:
结果将如下所示:
The SQL Server Query Store has no direct impact on SQL Server performance, but you need to take into consideration the disk space required to store the aggregated query execution data, where the data will be stored in the Primary database filegroup and consume the configurable MAX_STORAGE_SIZE_MB disk amount as described previously. Also the Query Store capture the execution data asynchronously as it writes the data to the memory first and flush it later to the disk. Query Store avoids consuming the CPU and Memory resources in the way it uses to capture the new plans and the executions statistics.
SQL Server查询存储对SQL Server性能没有直接影响,但是您需要考虑存储聚合查询执行数据所需的磁盘空间,该数据将存储在主数据库文件组中并占用可配置的MAX_STORAGE_SIZE_MB磁盘如前所述。 当查询存储首先将数据写入内存,然后将其刷新到磁盘时,查询存储也会异步捕获执行数据。 查询存储避免以捕获新计划和执行统计信息的方式消耗CPU和内存资源。
Once the Query Store is enabled on your database, you can query the sys.database_query_store_options system object to check the Query Store settings you configured as follows:
一旦在数据库上启用了查询存储,就可以查询sys.database_query_store_options系统对象,以检查您配置的查询存储设置,如下所示:
USE SQLShackDemo
GO
SELECT  actual_state_desc,
		flush_interval_seconds,
		interval_length_minutes,
		max_storage_size_mb,
		stale_query_threshold_days,
		max_plans_per_query,
		query_capture_mode_desc,
		size_based_cleanup_mode_desc
FROM sys.database_query_store_options;
The result in our case will be like:
在我们的案例中,结果将是:

Refresh your database node from the Object Explorer to ensure that the new Query Store node that is added in SQL Server 2016, is enabled as below:
从对象资源管理器中刷新数据库节点,以确保启用了在SQL Server 2016中添加的新查询存储节点,如下所示:
Four nodes will be displayed, from where you can check and track the changes in the queries execution statistics and performance. Choose the Regressed Queries node that will show you the queries execution plans with all related statistics:
将显示四个节点,您可以从中检查和跟踪查询执行统计信息和性能中的更改。 选择“ 回归查询”节点,该节点将显示具有所有相关统计信息的查询执行计划:
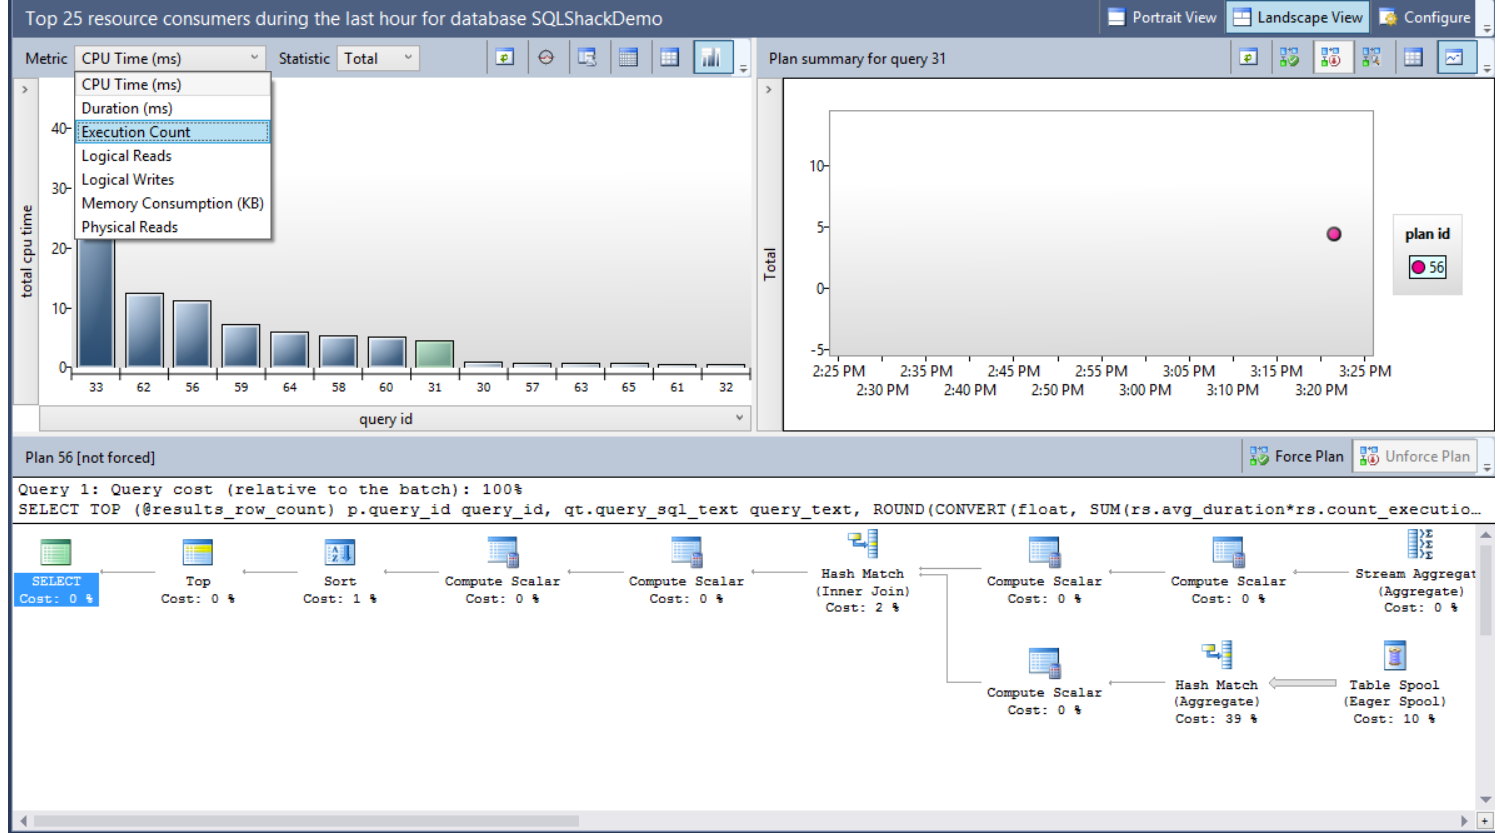
From the previous window, you can use the Metric drop-down list to choose the criteria that will be used to compare the execution plans performance, with the Statistic drop-down list to select the aggregation function used in the comparison. You can also view the graphical plan for the queries, the query text and the available plans for the query to force the best plan if requested.
在上一个窗口中,您可以使用“ 指标”下拉列表选择将用于比较执行计划性能的标准,并使用“ 统计”下拉列表选择比较中使用的聚合函数。 您还可以查看查询的图形计划,查询文本和查询的可用计划,以根据需要强制执行最佳计划。
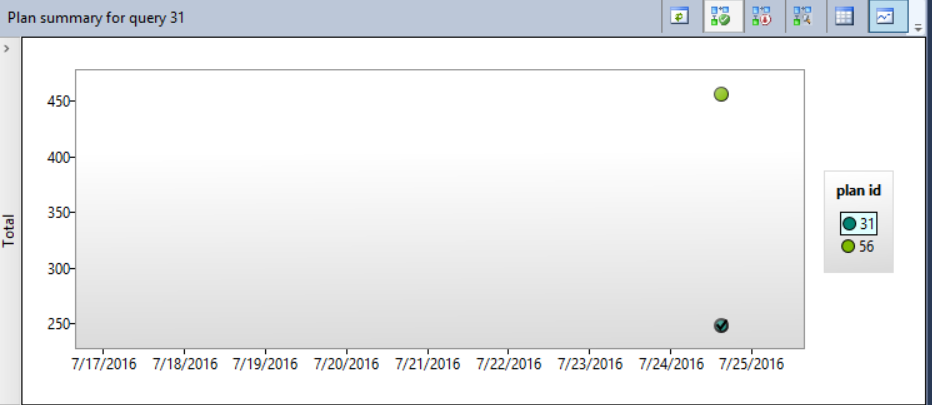
Assume that we faced a memory consumption performance issue recently with one of our queries, and we arrange to force the Query Optimizer to use the old plan. Using the Query Store feature, select the Memory Consumption (KB) metric, the query and the plan as in the below window:
假设我们最近在其中一个查询中遇到了内存消耗性能问题,并且我们安排强制Query Optimizer使用旧计划。 使用查询存储功能,选择“内存消耗”(KB)指标,查询和计划,如下面的窗口所示:
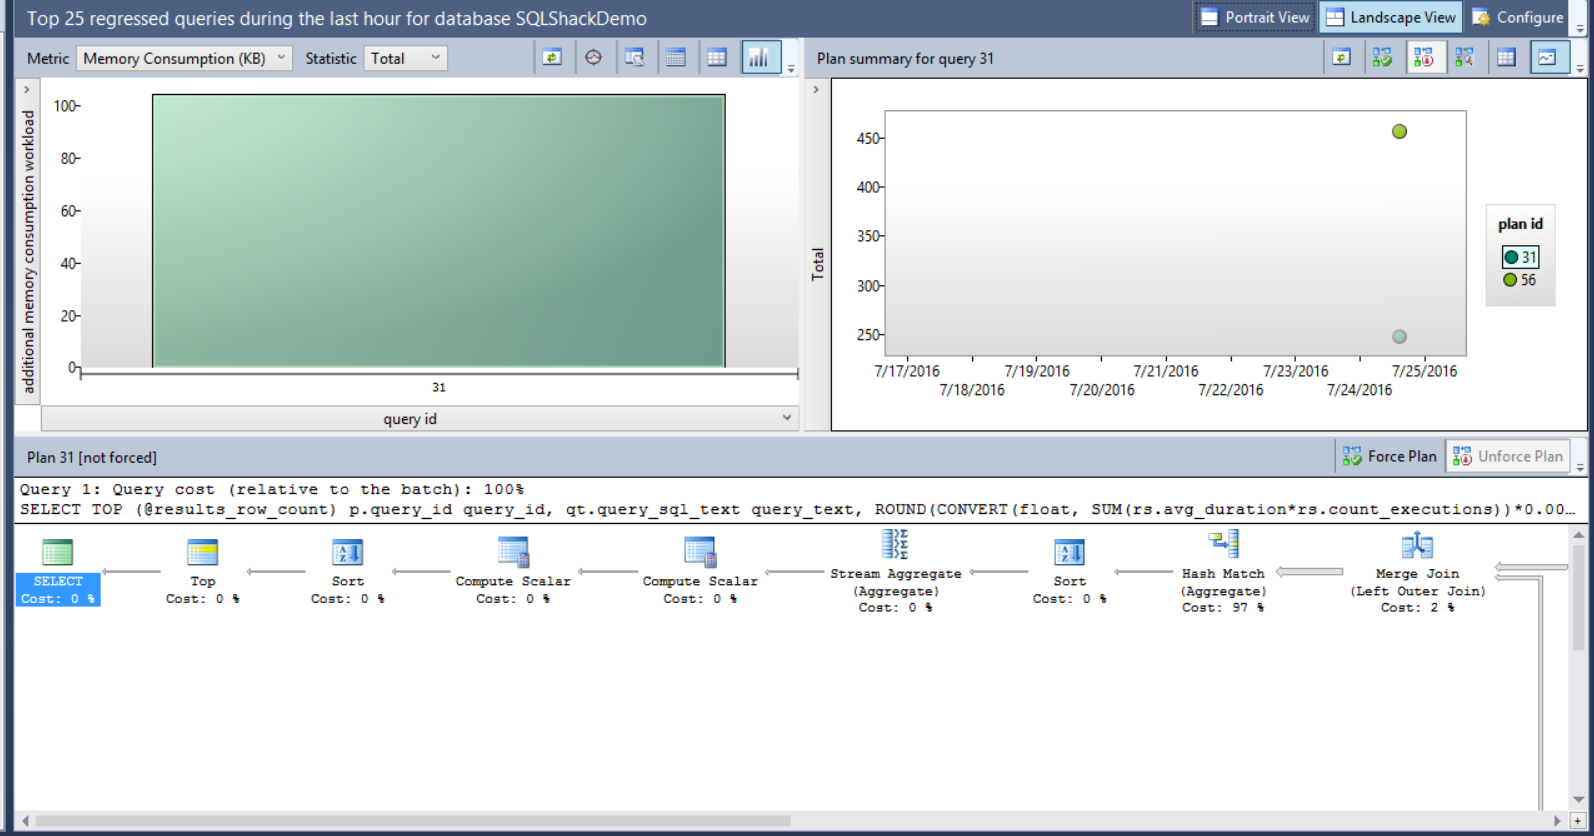
It is clear that the memory consumption for plan 56 is double the memory consumption of plan 31, so we will force the plan 31 for that query. The size of the bubbles shown in the right chart of the window depends on the total number of executions for each plan. The plans data can be displayed in grid form or as bubbles depends in the view you choose. Choose plan 31 in the previous window and click on Force Plan button.
显然,计划56的内存消耗是计划31的内存消耗的两倍,因此我们将对该查询强制执行计划31。 窗口右图表中显示的气泡大小取决于每个计划的执行总数。 计划数据可以网格形式显示,也可以作为气泡显示在您选择的视图中。 在上一个窗口中选择计划31,然后单击“ 强制计划”按钮。
A message will be displayed to confirm that you need to force the selected plan for that query as follows:
将显示一条消息,确认您需要为该查询强制选择所选计划,如下所示:
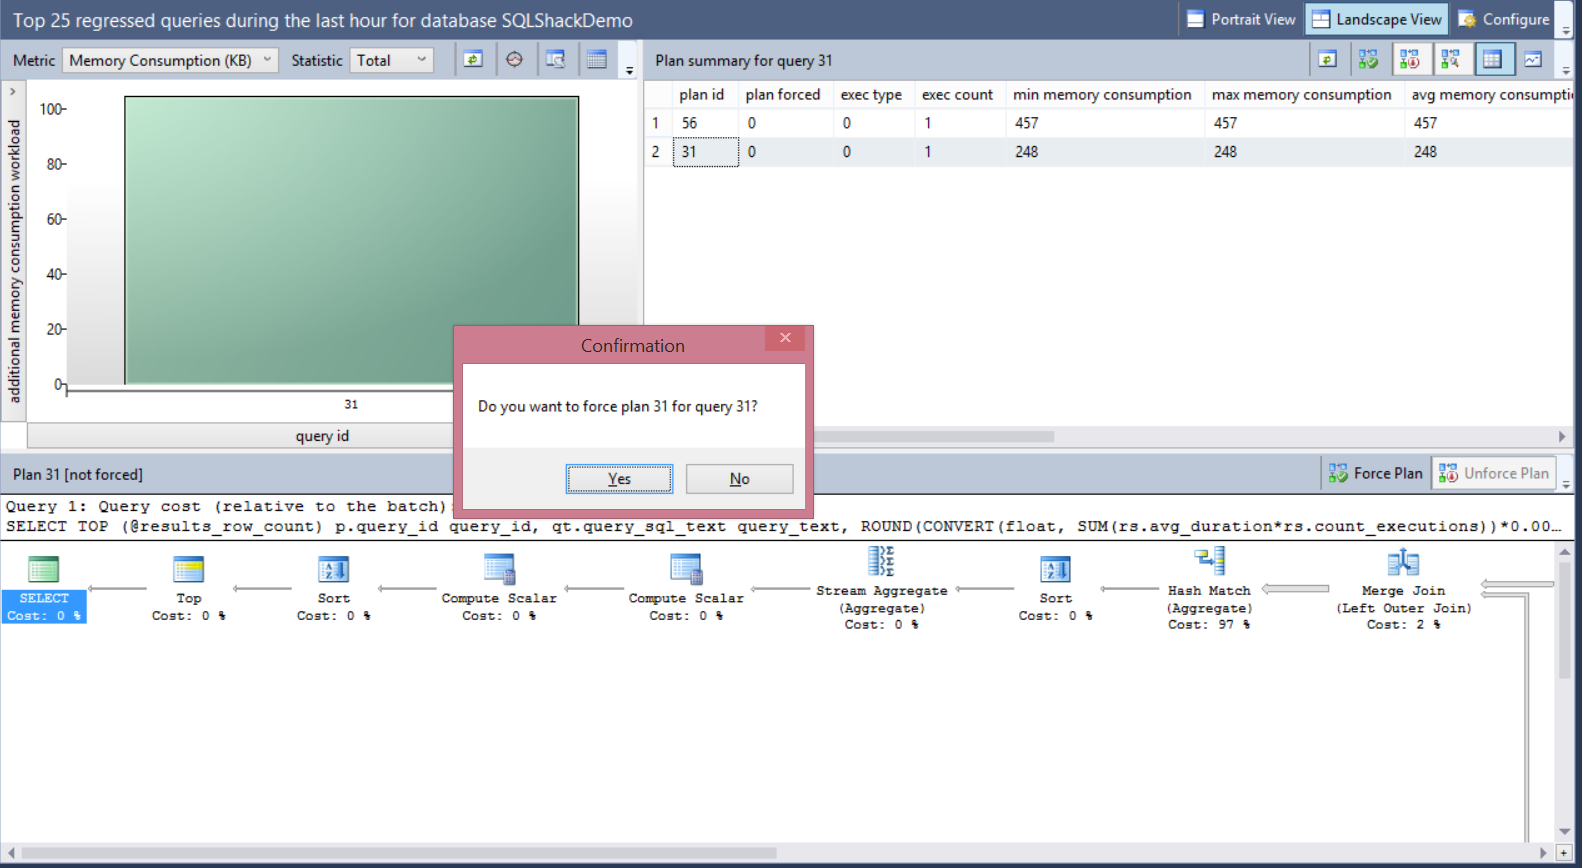
This action will force the SQL Server Query Optimizer to recompile that query in the next run using the forced plan. The selected plan will be shown with tick inside it, indicating that this plan is forced now for that query as below:
此操作将强制SQL Server查询优化器在下次运行时使用强制计划重新编译该查询。 所选计划将显示在其中,其中带有勾号,表示现在对该查询强制执行该计划,如下所示:
You can also use the sp_query_store_force_plan SP to enforce a specific plan for the query as follows:
您还可以使用sp_query_store_force_plan SP对查询执行特定的计划,如下所示:
EXEC sp_query_store_force_plan @query_id = 31, @plan_id = 31;
结论: (Conclusion:)
The SQL Server Query Store is a nice feature introduced in SQL Server 2016, which certainly merits your time and attention, although it will take few minutes from you to configure and learn. This feature is a simple way that can be used to track performance changes and troubleshoot any degradation in the queries performance by comparing the execution plans for the same query and force the best one by overriding the one saved in the plan cache and used by the Query Optimizer. The SQL Server Query Store has no major impact on SQL Server performance due to the way that is used in capturing and saving the queries execution statistics and plans to be viewed later.
SQL Server查询存储是SQL Server 2016中引入的一项不错的功能,尽管需要花费几分钟的时间进行配置和学习,但它当然值得您花费时间和精力。 此功能是一种简单的方法,可通过比较同一查询的执行计划来跟踪性能变化并解决查询性能的任何下降问题,并通过覆盖计划缓存中保存的查询和查询所使用的查询来强制执行最佳查询优化器。 由于使用了捕获和保存查询执行统计信息以及以后查看计划的方式,因此SQL Server查询存储对SQL Server性能没有重大影响。
翻译自: https://www.sqlshack.com/force-query-execution-plan-using-sql-server-2016-query-store/


 932
932

 被折叠的 条评论
为什么被折叠?
被折叠的 条评论
为什么被折叠?
 到【灌水乐园】发言


