


iotop iostat
In the article, we will learn how to use the ‘iotop’ and ‘iostat’ commands with various configuration options.
在本文中,我们将学习如何在各种配置选项中使用“ iotop”和“ iostat”命令。
It is essential for SQL Server DBAs to learn important commands in Linux in order to troubleshoot any performance issues in a Linux environment. When we encounter any performance issues or need to check the system or user processes, we can use the ‘top’ command. The ‘top’ command gives basic information about the CPU and memory processes. We might require more details in order to troubleshoot the issue, though. In such cases, we can utilize information similar to that in Windows provided by the task manager, resource monitor, and performance monitor.
SQL Server DBA必须学习Linux中的重要命令,才能解决Linux环境中的任何性能问题。 当我们遇到任何性能问题或需要检查系统或用户进程时,可以使用“ top”命令。 “ top”命令提供有关CPU和内存进程的基本信息。 不过,我们可能需要更多详细信息才能解决问题。 在这种情况下,我们可以利用类似于任务管理器,资源监视器和性能监视器在Windows中提供的信息。
In Windows systems, we look at the resource monitor to get information about the individual process and their disk related activity (Reads\sec, writes\sec).
在Windows系统中,我们查看资源监视器以获取有关单个进程及其与磁盘相关的活动的信息(Reads \ sec,writes \ sec)。
We can get further information using the performance monitor, where we can configure multiple parameters to get disk related activity.
我们可以使用性能监视器来获取更多信息,在该监视器中,我们可以配置多个参数来获取与磁盘相关的活动。
A few important counters in performance monitor are:
性能监视器中的一些重要计数器是:
- Avg. Disk sec/Read 平均 磁盘秒/读
- Avg. Disk sec/Write 平均 磁盘秒/写
- % Idle Time % 空闲时间
- Avg. Disk Queue Length 平均 磁盘队列长度
- Disk writes/sec 磁盘写入/秒
- Disk reads/sec 磁盘读取/秒
- Disk writes/sec 磁盘写入/秒
Let us explore some commands in Linux to get the disk related information.
让我们探索Linux中的一些命令以获取磁盘相关信息。
iostat (iostat)
We can monitor IO statistics for all disks and file system in Linux using ‘iostat’ command. This command is not installed by default, so we need to install this.
我们可以使用“ iostat”命令监视Linux中所有磁盘和文件系统的IO统计信息。 默认情况下未安装此命令,因此我们需要安装此命令。
- Note: In this article, we are using Ubuntu OS. You can prepare the Linux environment for the SQL Server by following my articles.
- 注意:在本文中,我们正在使用Ubuntu OS。 您可以按照我的文章为SQL Server准备Linux环境。
- SQL Server 2019 on Linux with UbuntuLinux与Ubuntu上SQL Server 2019
- SQL Server 2019 on Linux with a Docker container on UbuntuLinux上SQL Server 2019和Ubuntu上的Docker容器
- SQL Server 2019 on Linux with Ubuntu and Azure Data Studio具有Ubuntu和Azure Data Studio的Linux上SQL Server 2019
Therefore, install the ‘iostat’ using the below command in the terminal window.
因此,请在终端窗口中使用以下命令安装“ iostat”。
$ sudo apt-get install sysstat
$ sudo apt-get install sysstat
We can view the processes or task it performs to install the ‘iostat’ command.
我们可以查看其安装“ iostat”命令所执行的过程或任务。
We can now run the ‘iostat’ command and view the output.
现在,我们可以运行“ iostat”命令并查看输出。
In the output, we can categorize the information as below.
在输出中,我们可以将信息分类如下。
()
From the output, we can see below information:
从输出中,我们可以看到以下信息:
- %user: It is the CPU utilization for the user
- %user:这是用户的CPU使用率
- %nice– this shows the CPU utilization with nice priority %nice –这显示了CPU优先级的利用率
- %system– it shows the CPU utilization by the system
- %system –显示系统的CPU利用率
- %iowait: this data shows the CPU idle time with an outstanding i/o request %iowait:此数据显示CPU空闲时间以及未完成的I / O请求
- %idle: System idle time %idle:系统空闲时间
()
Below section shows the disk related information.
以下部分显示了磁盘相关信息。
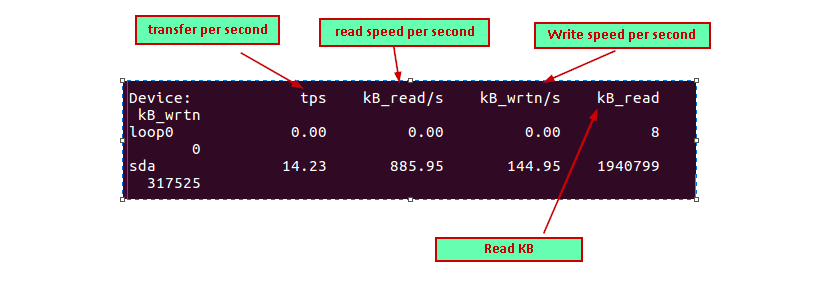
Below is the columns output we get for the individual disk device.
下面是我们为单个磁盘设备获得的列输出。
- Device: Name of the device
- 设备 : 设备名称
- Tps: transfer per second Tps :每秒传输
- KB_reads/s: KB reads per second KB_reads / s :每秒KB读取
- KB wrtn/s: KB writes per second KB wrtn / s:每秒KB写操作
If we want to get only device-related information, run the below command:
如果我们只想获取与设备相关的信息,请运行以下命令:
$ iostat -d
$ iostat -d
By default, it command gives basic information about the disks. If we want to get detailed information, run the command with ‘-x’ parameter.
默认情况下,它命令提供有关磁盘的基本信息。 如果要获取详细信息,请使用“ -x”参数运行命令。
$ iostat -x
$ iostat -x
We get additional columns in the output as compared to the previous run without ‘-x’ parameter.
与上一次不带-x参数的运行相比,我们在输出中获得了更多列。
- ‘rrqm\s’: it shows the read requests merged per second queued to the device 'rrqm \ s':显示每秒合并到设备中的读取请求
- ‘wrqm/s: it shows the write requests merged per second queued to the device 'wrqm / s:显示每秒合并到设备中的写入请求
- r/s and w/s: read and write requests per second r / s和w / s:每秒读写请求
- rsec/s and wsec/s: Number of sector reads and writes per second rsec / s和wsec / s:每秒的扇区读取和写入次数
- avgrq-sz : average sector size of the requests avgrq-sz :请求的平均扇区大小
- avgqu-sz: average queue length of the requests avgqu-sz:请求的平均队列长度
- await: average wait time in ms 等待:平均等待时间(毫秒)
- svctm: average service time in ms svctm:平均服务时间(毫秒)
We can get the stats in KB or MB with the below commands:
我们可以使用以下命令以KB或MB为单位获取统计信息:
iostat -m –Stats in MB
iostat -k –stats in KB
iostat -m –以MB为单位的统计信息
iostat -k –以KB为单位的统计信息
We can get the stats with a time interval as well. This helps to get the report.
我们还可以按时间间隔获取统计信息。 这有助于获取报告。
Using below command, we can run ‘iostat’ with MB unit in 3 seconds interval and 4 times.
使用下面的命令,我们可以3秒钟间隔和4次以MB为单位运行“ iostat”。
iostat -m 3 4
iostat -m 3 4
iotop (iotop)
We can get IO information or disk utilization by the individual process. We also need to install this command to use it.
我们可以通过单个进程获取IO信息或磁盘利用率。 我们还需要安装此命令才能使用它。
In Ubuntu, run the below command to install ‘iotop’:
在Ubuntu中,运行以下命令以安装“ iotop”:
sudo apt install iotop
sudo apt安装iotop
I highlighted the important information during the installation of ‘iotop’. We need to run this using administrative permission else, below error message is logged.
我强调了在安装“ iotop”期间的重要信息。 我们需要使用管理权限来运行它,否则,将记录以下错误消息。
$ sudo iotop
$ sudo iotop
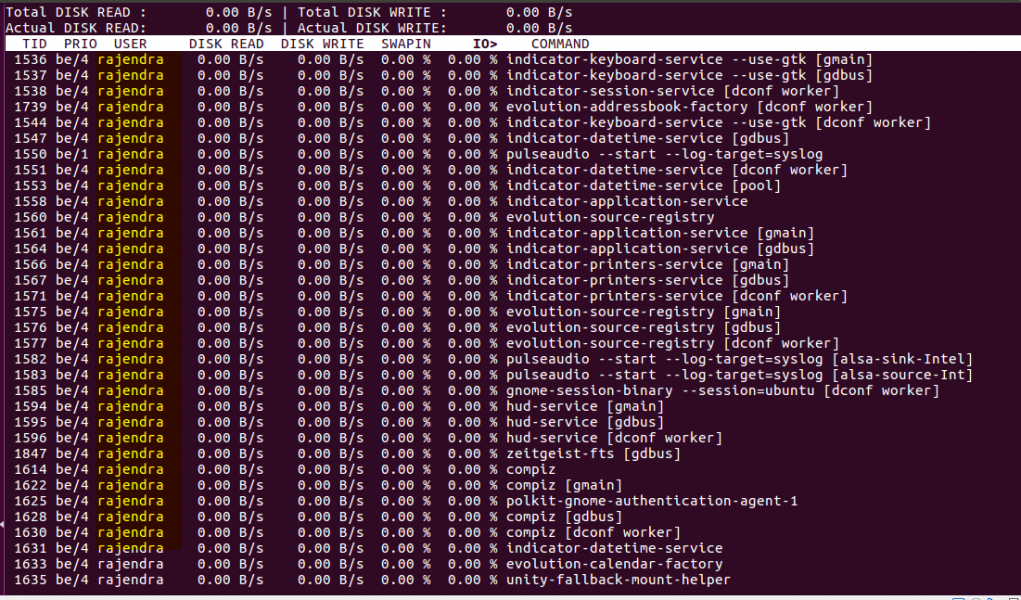
We can see below column header for the ‘iotop’ command. In this output:
我们可以在下面的“ iotop”命令的列标题中看到它。 在此输出中:
- SWAPIN: swap usage for each process SWAPIN:交换每个流程的用法
- IO: total IO for each process IO:每个进程的总IO
We can get information about the iotop command using the ‘sudo iotop –help’ command.
我们可以使用“ sudo iotop –help”命令获取有关iotop命令的信息。
So let us explore these options.
因此,让我们探索这些选项。
当前运行的进程: (Current running processes:)
If we want to check current running processes, we can run the command ‘sudo iotop –only’
如果要检查当前正在运行的进程,可以运行命令“ sudo iotop –only”
排序栏: (Sort Column: )
‘iotop’ command also gives output in interactive mode. We can change the sort column using the left and right arrow keys. You can notice the same in below screenshots.
“ iotop”命令还以交互模式提供输出。 我们可以使用左右箭头键更改排序列。 您可以在以下屏幕截图中看到相同的内容。
In below screenshot, the current sort column is ‘USER’.
在下面的屏幕截图中,当前的排序列为“ USER”。
Press the right arrow key few times and we can change the sort key to ‘command’ as shown here:
几次按右箭头键,我们可以将排序键更改为“ command”,如下所示:
In the running out, press ‘p’ to only show the processes.
在运行中,按“ p”仅显示进程。
If we want to change the sort order, we can do it using the ‘r’ key. By default, in the sort column, you can see symbol ‘>’. Press ‘r and sort order changes and symbol changes to ‘<‘.
如果要更改排序顺序,可以使用“ r”键来完成。 默认情况下,在排序列中,您可以看到符号“>”。 按“ r”,排序顺序更改,符号更改为“ <”。
版本号: (Version number: )
Below command gives ‘iotop’ command version number.
下面的命令给出了“ iotop”命令的版本号。
Sudo iotop –version
Sudo iotop –版本
监控特定的用户流程 (Monitor specific user processes)
Run the below command to show only particular user processes. For example, we want to view only the user ‘rajendra’ processes.
运行以下命令以仅显示特定的用户进程。 例如,我们只想查看用户“ rajendra”进程。
Sudo iotop -u ‘rajendra’
Sudo iotop -u'rajendra'
监视系统进程: (Monitor system processes: )
To monitor the system processes, run the command:
要监视系统进程,请运行以下命令:
Sudo iotop -P
须藤iotop -P
将单位更改为KB / s,而不是B / s: (Change unit to KB/s instead of B/s: )
Run the command with -k parameter:
使用-k参数运行命令:
Sudo iotop -k
须藤iotop -k
结论 (Conclusion)
In the article, we have learned to use the ‘iotop’ and ‘iostat’ commands with various configuration options. We can get the details about the individual processes; disks IO related information using these commands.
在本文中,我们学习了将“ iotop”和“ iostat”命令与各种配置选项一起使用。 我们可以获得有关各个流程的详细信息; 使用这些命令来磁盘IO相关信息。
目录 (Table of contents)
| Helpful Linux commands for SQL Server DBAs – top |
| Helpful Linux commands for SQL Server DBAs – iotop and iostat |
| 适用于SQL Server DBA的有用的Linux命令–页首 |
| 适用于SQL Server DBA的有用的Linux命令– iotop和iostat |
翻译自: https://www.sqlshack.com/helpful-linux-commands-for-sql-server-dbas-iotop-and-iostat/
iotop iostat


 760
760

 被折叠的 条评论
为什么被折叠?
被折叠的 条评论
为什么被折叠?
 到【灌水乐园】发言


