


ssas 度量值属性
In this article, a demonstration of the tabular model will try to related multidimensional cube design to the path forward Microsoft is giving used s with new versions of Analysis Services. Even though the descriptive names are changing, the tabular model still accomplishes the centralized business rules multidimensional cubes gave the business intelligence world. This is enforced by speed obtained from in-memory technology and simplification of the interface for the masses.
在本文中,表格模型的演示将尝试将多维多维数据集设计与Microsoft使用新版本的Analysis Services所使用的前进路径相关。 即使描述性名称发生了变化,表格模型仍然可以实现集中多维多维立方体赋予商业智能世界的业务规则。 这是通过从内存技术获得的速度以及简化大众界面的方式来实现的。
The tabular model of SQL Server Analysis Services shifts focus from dimensions and cubes to tables, relationships, and measures. Coming from the cube world, this seems a little off. It is not until you get into the DAX (Data Analysis eXpression language) do you really start to see the significance of the new modeling tool for Business Intelligence. But before jumping into DAX, a Tabular Model has to be constructed from the same dimension and fact tables used for cubes. The same holds true for tabular as multidimensional, a data mart works best for final table structures.
SQL Server Analysis Services的表格模型将重点从维度和多维数据集转移到表,关系和度量。 来自多维数据集世界,这似乎有点不足。 它不是直到你进入了DAX(d ATA 一 nalysis E X PRESSION语言),你真的开始看到了商业智能的新的建模工具的意义。 但是在进入DAX之前,必须使用与多维数据集相同的维度和事实表来构建表格模型。 表格与多维一样适用于表格,数据集市最适合最终表结构。
The first step in importing tables and data is selecting a table, view or T-SQL statement to bring data into a Tabular Model. The easy way is to just select the tables like Figure 1.
导入表和数据的第一步是选择表,视图或T-SQL语句,以将数据带入表格模型。 简单的方法是只选择表,如图1所示。
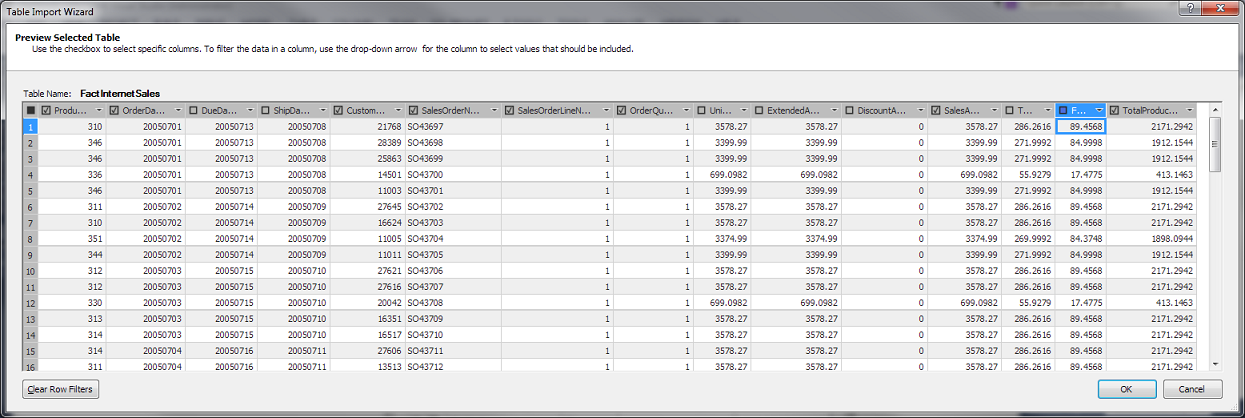
The problem with this method is you get all the columns from all the tables selected. The next option would be to click the Preview & Filter button in the Table Import Wizard to only select reportable columns…for now. You can also rename the table from DimCustomer to Customer on this screen. This is the Friendly Name property of a table in the Tabular Model. Figure 2 shows removing some of the columns from the FactInternetSales table. Internet Sales is where the measures would be created.
这种方法的问题是您从所有选定的表中获取所有列。 下一个选项是单击“表导入向导”中的“预览和筛选器”按钮以仅选择可报告列…暂时。 您还可以在此屏幕上将表从DimCustomer重命名为Customer。 这是表格模型中表的友好名称属性。 图2显示了从FactInternetSales表中删除一些列。 互联网销售是制定措施的地方。
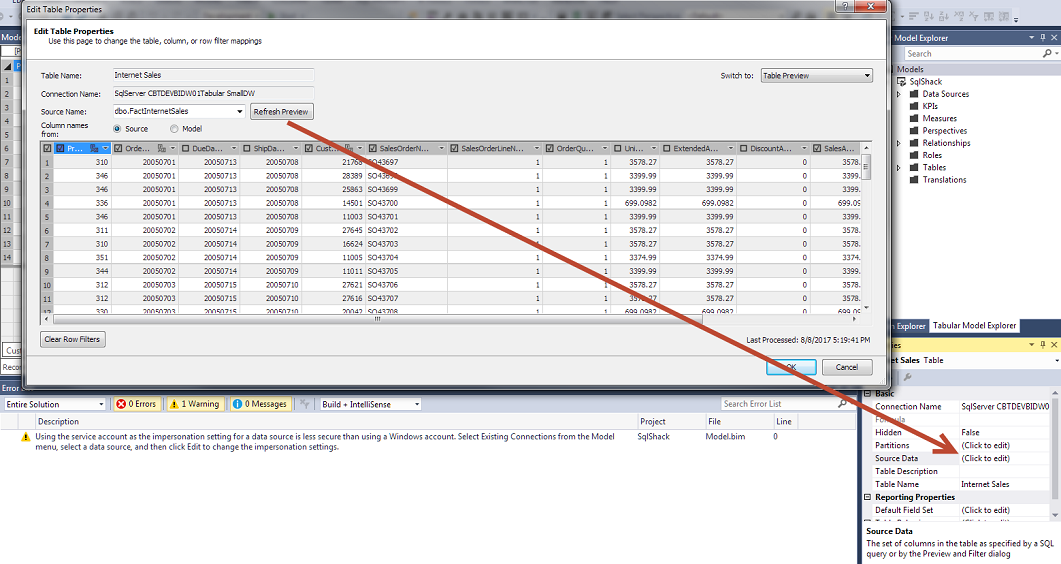
The will change the T-SQL behind the initial import and future processing of new data. Instead of a SELECT *, the T-SQL now only selects the columns needed. You can always edit this graphically or with the text from the Model editor. Figure 3 shows the edit screen with a pointer to the property Source Data of a table.
它将改变T-SQL在初始导入和以后处理新数据的背后。 现在,T-SQL代替SELECT *,仅选择所需的列。 您始终可以以图形方式或使用“模型”编辑器中的文本进行编辑。 图3显示了带有指向表的Source Data属性的指针的编辑屏幕。
The last option is to create a view in the database and select it as the Source Data. The big issue here is the Tabular Model cannot see the Foreign Key(s) from the underlying table of the view. Manually adding these relationships can be done in the Diagram view.
最后一个选项是在数据库中创建一个视图,并将其选择为源数据。 这里最大的问题是表格模型无法从视图的基础表中看到外键。 可以在图视图中手动添加这些关系。
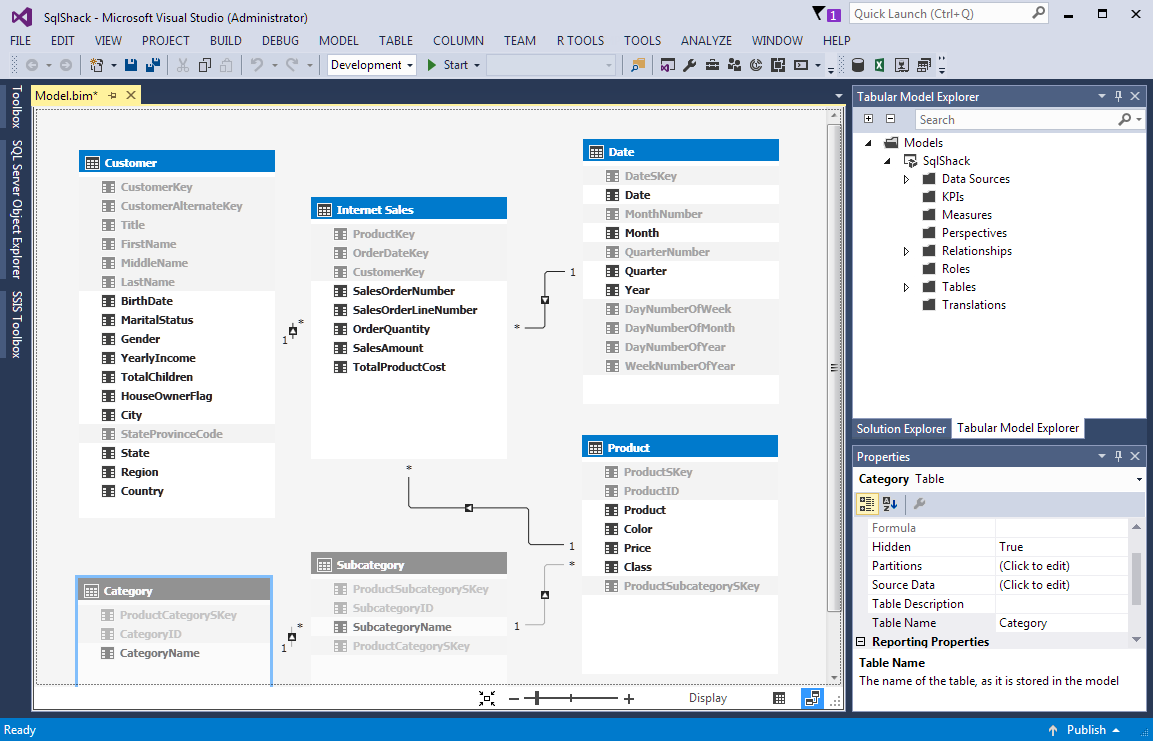
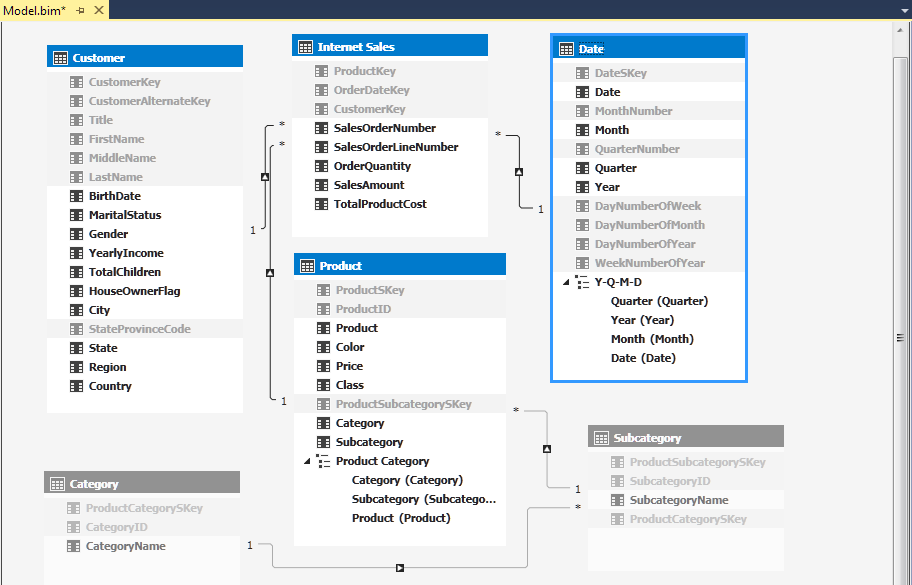
Once we have the tables in the model, like Figure 4, we can start to use tabular features to enhance the client tool view. The dimension tables are Customer, Date, Product, Subcategory and Category. The Fact table is Internet Sales.
在模型中有了表之后,如图4所示,我们可以开始使用表格功能来增强客户端工具视图。 维度表是客户,日期,产品,子类别和类别。 事实表是Internet Sales。
The surrogate key columns in each dimension table needs to be hidden from client view. The easiest way to do this is in the Diagram view. The Key columns can be multi-selected by using the Control key while clicking on each column. Then, right-clicking on one of the columns and selecting Hide from Client Tool from the submenu.
每个维度表中的代理键列都需要从客户端视图中隐藏。 最简单的方法是在“图”视图中。 单击各列时,可以使用Control键来选择“键”列。 然后,右键单击列之一,然后从子菜单中选择“从客户端工具隐藏”。
These columns have to be keep in the model because that is how the relationships are built. The ID columns in Category, Subcategory and Product can be hidden as well. They are the business key of the table and do not have to be in the model. To clean up the rest of the dimension tables, we are going to do the following.
这些列必须保留在模型中,因为这是建立关系的方式。 类别,子类别和产品中的ID列也可以隐藏。 它们是表的业务键,不必在模型中。 为了清理其余的维度表,我们将执行以下操作。
-
- Hide columns Title, Firstname, LastName, MiddleName and StateProvinceCode 隐藏列Title,Firstname,LastName,MiddleName和StateProvinceCode
-
- StateProvinceName to State StateProvinceName为州
- SalesTerritoryRegion to Region SalesTerritoryRegion到地区
- SalesTerritoryCountry to Country 销售地区国家/地区
-
- Delete columns StartDate, Enddate and Status (Figure 6) 删除列StartDate,Enddate和Status(图6)
-
- ProductName to Product 产品名称到产品
- ListPrice to Price 价格表到价格表
-
- Hide columns MonthNumber, QuarterName, DayNumberOfWeek, DayNumberOfMonth, DayNumberOfYear and WeekNumberOfYear 隐藏列MonthNumber,QuarterName,DayNumberOfWeek,DayNumberOfMonth,DayNumberOfYear和WeekNumberOfYear
-
- MonthName to Month 月名称到月
- Dates to Date 迄今日期
- QuarterName to Quarter 季度名称到季度
- YearNumber to Year 年数到年
- Subcategory and Category tables will both be hidden. 子类别和类别表都将被隐藏。
The current state of the model is like Figure 7. Tables Subcategory and Category are hidden because a hierarchy needs to be created containing column CategoryName, SubcategoryName and Product. The only way this can be done is in one table. So, these columns need to be added to the product table in the Model.
模型的当前状态如图7所示。表Subcategory和Category被隐藏了,因为需要创建一个包含列CategoryName,SubcategoryName和Product的层次结构。 唯一的方法是在一个表中。 因此,需要将这些列添加到模型的产品表中。
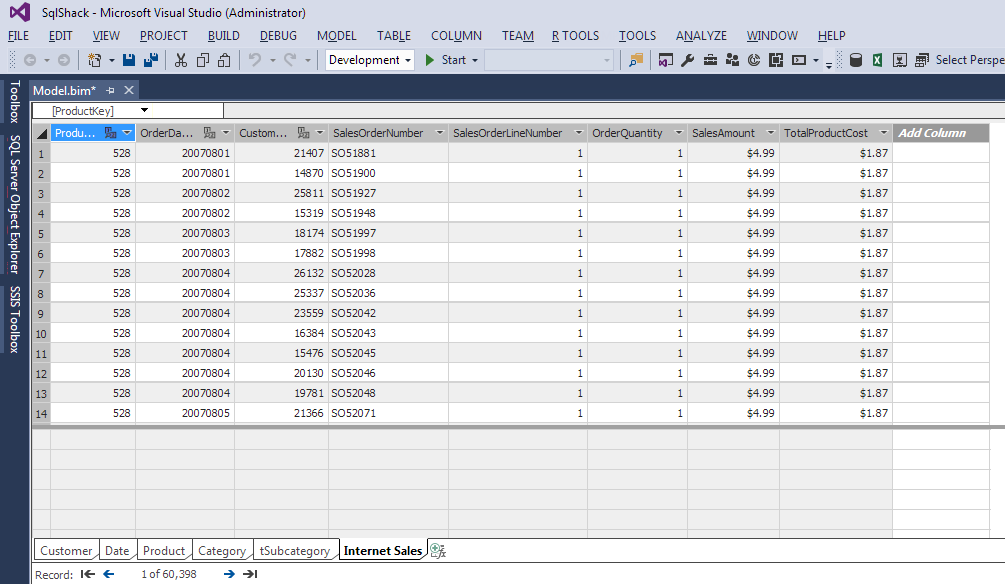
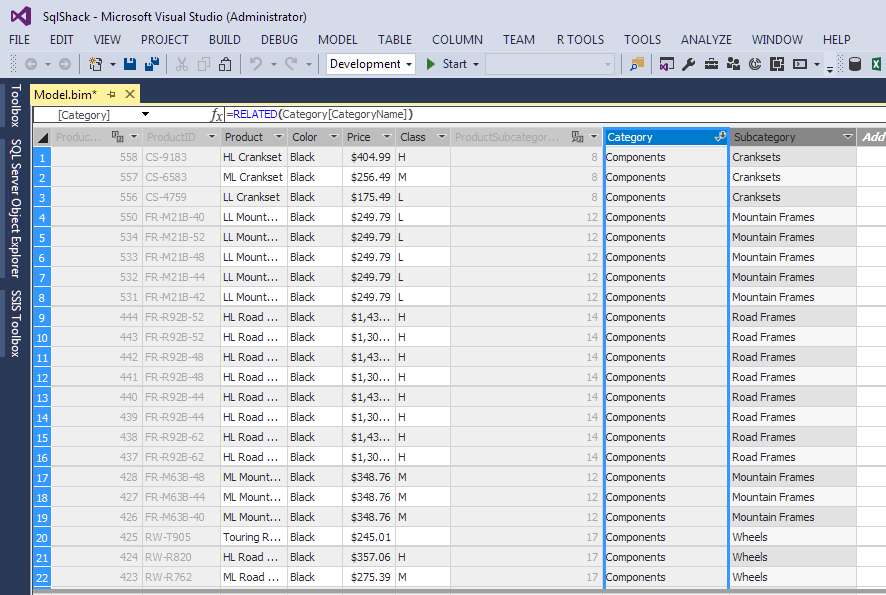
Switching back to the Grid view, focus is now on the Product tab or table. By scrolling to the last column, the next new column has a header of Add Column. A DAX formula can be placed in the new column to pull the CategoryName from the Category table as well as the SubcategoryName. Figure 8 shows the RELATED () DAX function being used to get the CategoryName. The IntelliSense shows that the Category[CategoryName] can be added to the product. This is possible because of the relationship between Product and Subcategory, then Subcategory to Category.
切换回“网格”视图,现在焦点在“产品”选项卡或表上。 通过滚动到最后一列,下一个新列的标题为“添加列”。 可以将DAX公式放在新列中,以从“类别”表中获取“类别名称”以及“ SubcategoryName”。 图8显示了用来获取CategoryName的RELATED()DAX函数。 IntelliSense显示可以将Category [CategoryName]添加到产品中。 由于产品和子类别之间的关系,然后是子类别到类别之间的关系,因此这是可能的。
After renaming the columns, the product tab now looks like Figure 9. Renaming the column can be accomplished by right-clicking on the column heading and selecting Rename from the submenu. Also, the properties dialog in the lower right has a Column Name property which can be used to rename a column.
重命名列后,product选项卡现在看起来如图9所示。重命名列可以通过右键单击列标题并从子菜单中选择Rename来完成。 此外,右下角的属性对话框具有“列名”属性,可用于重命名列。
Switching back to the Diagram view, the Product table now has the columns needed for the hierarchy. Holding the control key down and selecting the 3 columns, Category, Subcategory and Product, enable the ability to right-click and create a hierarchy from the selected columns. After these steps, right-clicking the hierarchy1 title and selecting rename can complete this hierarchy by changing the name to Product Category.
切换回图视图,“产品”表现在具有层次结构所需的列。 按住Control键并选择3列(类别,子类别和产品),就可以右键单击并从选定的列创建层次结构。 这些步骤之后,右键单击hierarchy1标题并选择重命名可以通过将名称更改为“产品类别”来完成此层次结构。
This can be repeated for the date hierarchy of Year, Quarter, Month and Date like Figure 11.
可以对Year,Quarter,Month和Date的日期层次结构重复此操作,如图11所示。
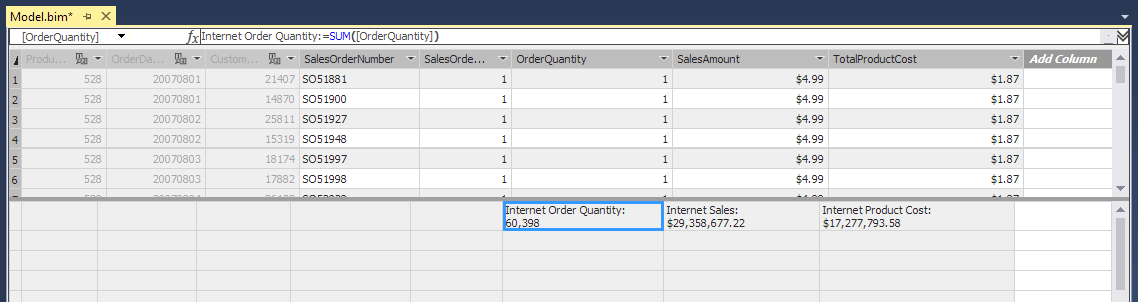
Switching back to the Grid view, the measures will need to be created in the Internet Sales tab. The Measure DAX expression for Sum of Sales is Internet Sales:=SUM([SalesAmount]). The same can be repeated for the OrderQuantity and TotalProductCost measures. Figure 12 shows the new Measures as well as Hiding the columns for the Client Tool. The columns are no longer needed because the Measures created with SUM() DAX function is used in reporting.
切换回“网格”视图,需要在“ Internet销售”选项卡中创建度量。 销售总额的DAX度量值为Internet Sales:= SUM([SalesAmount])。 可以对OrderQuantity和TotalProductCost度量重复相同的操作。 图12显示了新的“度量值”以及“客户端工具”的隐藏列。 不再需要这些列,因为在报告中使用了使用SUM()DAX函数创建的度量。
To preview the model, under the Model menu there is a sub-menu for Analyze in Excel. Take the defaults for User Name and Roles to connect and click OK. A PivotTable in Excel with be selected for the connection to the Analysis Service Tabular Model. The PivotTable Fields will list the SUM measures with the summation character at the top of the list. These are the columns to go in the Values area on the bottom right of the Pivot Table. Selected in figure 13 is Y-Q-M-D for columns, Product Category for Rows and Internet Sales for Values.
要预览模型,在“模型”菜单下有一个用于在Excel中进行分析的子菜单。 采用默认的“用户名和角色”进行连接,然后单击“确定”。 选择了Excel中的数据透视表以连接到Analysis Service表格模型。 数据透视表字段将列出SUM量度,并在列表顶部显示求和字符。 这些是要在数据透视表右下方的“值”区域中移动的列。 在图13中选择的是列的YQMD,行的产品类别和值的Internet销售。
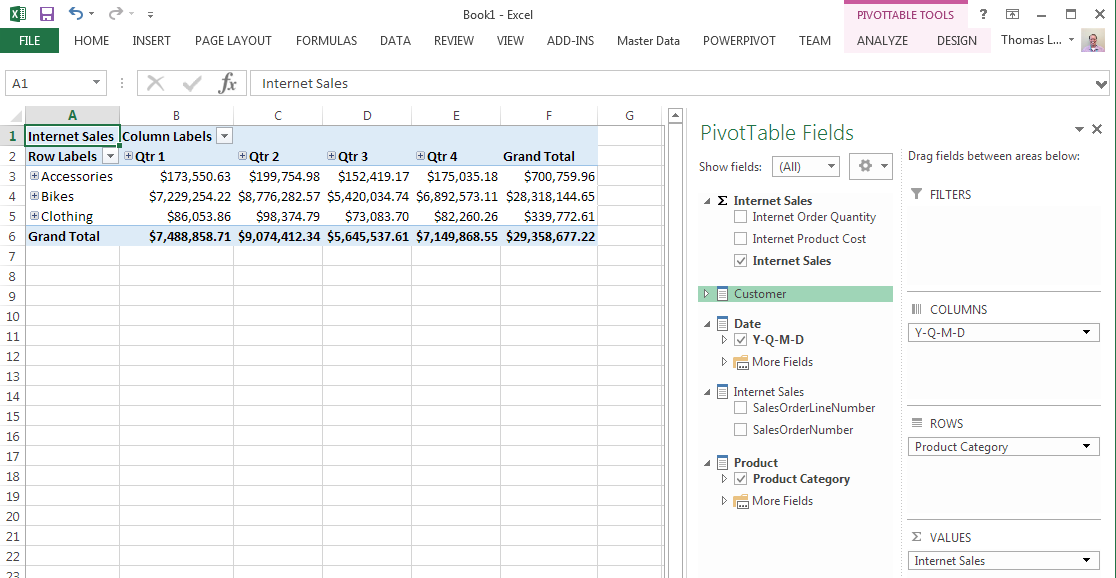
The amount of time to get a useful analysis of Internet Sales by Year/Quarter/Month sliced by Product Category hierarchy is minimal. This tabular model can now be handed to end users to start developing more insight into the data. There are more requirements to come from the end users once they get this ability to slice and dice data.
按产品类别层次结构划分的按年/季度/月对互联网销售进行有用分析的时间最少。 现在可以将此表格模型传递给最终用户,以开始对数据进行更多的了解。 一旦最终用户获得了对数据进行切片和切块的能力,他们就会有更多的要求。
Previous articles in this series:
本系列以前的文章:
- SQL Server Data Warehouse design best practice for Analysis Services (SSAS)分析服务(SSAS)SQL Server数据仓库设计最佳实践
- Connecting to Data Source(s) with SQL Server Analysis Services使用SQL Server Analysis Services连接到数据源
- Initial Attributes and Measures in SSAS Multidimensional CubesSSAS多维立方体中的初始属性和度量
- Analysis Services (SSAS) Cubes – Dimension Attributes and HierarchiesAnalysis Services(SSAS)多维数据集–维度属性和层次结构
参考资料 (References)
翻译自: https://www.sqlshack.com/analysis-services-ssas-tabular-models-attributes-measures/
ssas 度量值属性


 1299
1299

 被折叠的 条评论
为什么被折叠?
被折叠的 条评论
为什么被折叠?
 到【灌水乐园】发言


