


In this article, we will give detailed steps for using Performance Monitor for SQL Server tuning
在本文中,我们将提供使用Performance Monitor进行SQL Server调整的详细步骤
如何使用Performance Monitor进行SQL Server监视? (How to use Performance Monitor for SQL Server monitoring?)
To open Windows Performance Monitor, use one of the following options:
要打开Windows Performance Monitor ,请使用以下选项之一:
- Start (Windows + C for Windows 8), 开始” (适用于Windows 8的Windows + C), Search, type 搜索 ,键入perfmon, and press perfmon ,然后按EnterEnter键
- Start, Run (Windows + R for Windows 8), type 开始”,“运行” (对于Windows 8为Windows + R),键入perfmon, and press perfmon ,然后按EnterEnter键。
- Control Panel, System and Security, Administrative Tools, and click 控制面板”,“系统和安全性”,“管理工具” ,然后单击“ Performance Monitor性能监视器”。
In the left pane, select Monitoring Tools and then Performance Monitor
在左窗格中,选择“ 监视工具” ,然后选择“ 性能监视器”
To add a metric to monitor in real time:
要添加指标以进行实时监控,请执行以下操作:
- Add Counters in the context menu, or click the 添加计数器 ”,或单击菜单中的“ Add (plus) icon in the menu添加 (加号)”图标
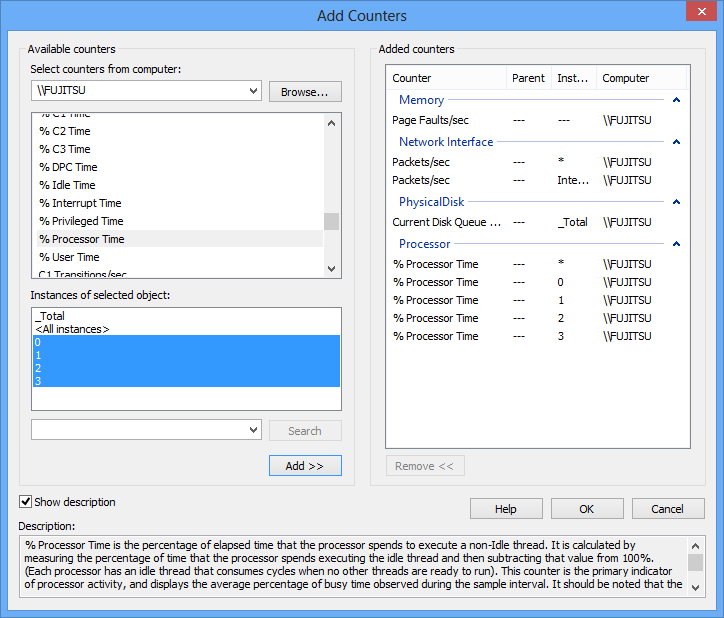
- Add Counters dialog, select the computer you want to monitor. The local machine is selected by default. To add a remote machine, click 添加计数器”对话框中,选择要监视的计算机。 默认情况下选择本地计算机。 要添加远程计算机,请单击Browse. To do this, you must have access to the network where the remote machine is. To monitor a remote machine, make sure that 浏览 。 为此,您必须有权访问远程计算机所在的网络。 要监视远程计算机,请确保将Performance Monitor is added to the firewall exception list性能监视器添加到防火墙例外列表中
- Page faults/sec, select the Page Faults / sec ,请选择“ Memory group. Then, select 内存”组。 然后,选择Page faults/sec and click Page Faults / sec ,然后单击AddAdd。
- %Processor Time total for each processor, Physical Disk – Current Disk Queue Length, and 每个处理器的总处理器时间百分比”,“物理磁盘–当前磁盘队列长度”和“ Network Interface – Packets/sec (for all and for a specific network adapter) 网络接口–数据包/秒” (对于所有网络和特定网络)适配器)
All selected counters are shown in a single graph. The graph shows two minutes of data, and lines are written left to right along the X-axis, overwriting the oldest values
所有选定的计数器都显示在单个图形中。 该图显示了两分钟的数据,并且线沿X轴从左到右写入,覆盖了最早的值
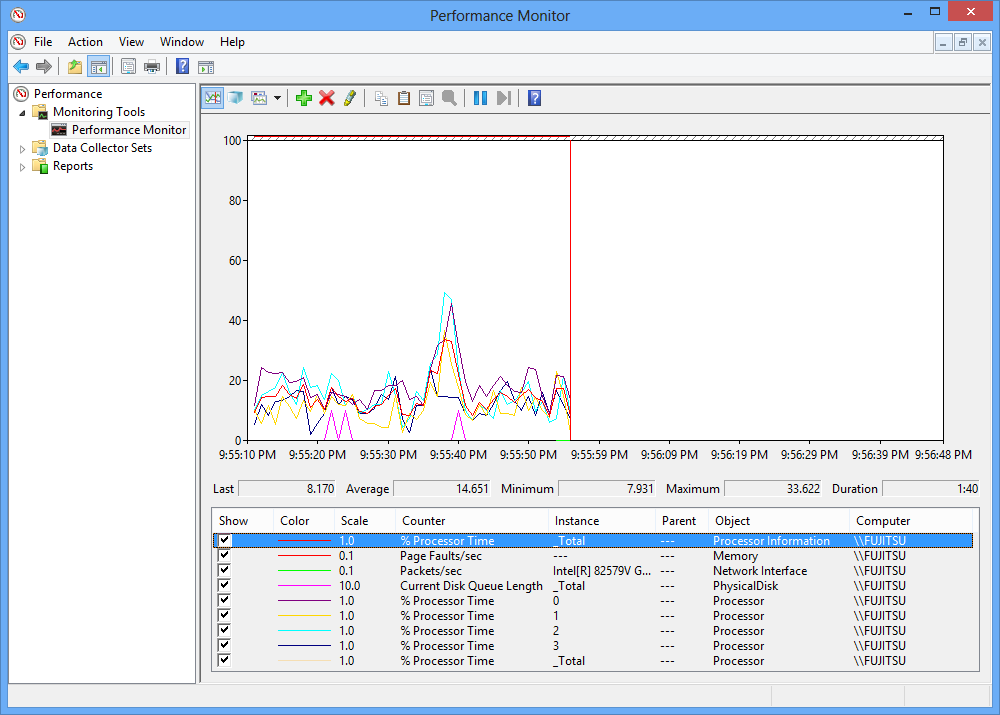
Below the graph, all counters are listed with their basic information and the graph line color
在图表下方,列出了所有计数器及其基本信息和图表线条颜色
When a counter is selected, its current, average, minimum, and maximum values are shown below the graph
选择计数器后,其当前值,平均值,最小值和最大值将显示在图表下方
调整图 (Tweaking the graph)
The check box at the beginning of each row specifies whether the counter is presented in the graph or not. It doesn’t stop monitoring of the counter, it just hides its line in the graph
每行开头的复选框指定计数器是否显示在图形中。 它不会停止监视计数器,只是将其线隐藏在图中
To remove the counter from monitoring, select it in the list and click red X (Delete) in the menu
要将计数器从监视中删除,请在列表中将其选中,然后在菜单中单击红色的X(删除)
To distinguish the specific counter among the lines shown, use the highlight option in the menu to make the line bolded (or Ctrl+H)
要在显示的行中区分特定的计数器,请使用菜单中的突出显示选项使行变为粗体(或Ctrl + H)
To change the type of graph from default line to histogram bars, or numeric report, click the Change graph type icon in the menu
要将图形类型从默认线更改为直方图条形图或数字报告,请单击菜单中的更改图形类型图标
In order to read the graph easier, you can also change the default line colors in the Properties dialog in the counter context menu
为了更容易阅读图形,您还可以在计数器上下文菜单的“ 属性”对话框中更改默认线条颜色
By default, the graph shows the values up to 100. To change the graph ratio:
默认情况下,图形显示的值最多为100。要更改图形比率,请执行以下操作:
- Right click the graph 右键单击图形
- Properties属性
- Graph tab图形选项卡
- Vertical scale Maximum and 垂直刻度的最大值和Minimal values最小值
Another option that you can use to make the lines easier to read is to change the line ratio. A default line scale is set for each counter, but in case the values are very low or high, you see only a flat line close to the bottom or top of the graph. In that case, modifying a counter line scale is necessary
您可以用来使线条更易于阅读的另一种选择是更改线条比例。 为每个计数器设置了默认的线刻度,但是如果值非常低或太高,您只会在靠近图形底部或顶部的地方看到一条扁平线。 在这种情况下,必须修改计数线比例
In the next example, reading the Page Faults/sec values when the default line scale is used is not possible, as its values are presented with a flat line at the top of the graph
在下一个示例中,无法使用默认线刻度时读取Page Faults / sec值,因为其值在图形顶部以平线表示
The solution is to change the default 0.1 line scale for the counter to 0.01
解决方案是将计数器的默认0.1行刻度更改为0.01
It means that the value 1,600 will be presented as 1,600*0.01 = 16, which can be clearly read from the graph that shows values 0 to 100
这意味着值1600将显示为1600 * 0.01 = 16,可以从显示值0到100的图表中清楚地读取
To stop drawing the lines, click Pause (Freeze display) in the menu and Unfreeze to resume
要停止绘制线条,请单击菜单中的暂停 (冻结显示),然后单击取消冻结以继续
查看日志文件 (Viewing log files)
Besides showing the real time data, Performance Monitor can show the counter values stored in *.blg, *.csv, or *.tsv log files by the operating system utility, such as Data Collector Set, or a third party tool
除了显示实时数据外, 性能监视器还可以显示由操作系统实用程序(如数据收集器集 )或第三方工具存储在* .blg,*。csv或* .tsv日志文件中的计数器值。
When started, Performance Monitor shows the current activity by default. To open a log file and show its content in the graph:
启动时, 性能监视器默认情况下显示当前活动。 要打开日志文件并在图形中显示其内容,请执行以下操作:
- View Log Data in the menu查看日志数据
- Source tab源标签
- Log files日志文件
Click Add and navigate to the log files you want to show
单击添加 ,然后导航到要显示的日志文件
Move the Time Range bar left or right to narrow down the time period shown in the graph
向左或向右移动时间范围栏以缩小图中所示的时间范围
报告书 (Reports)
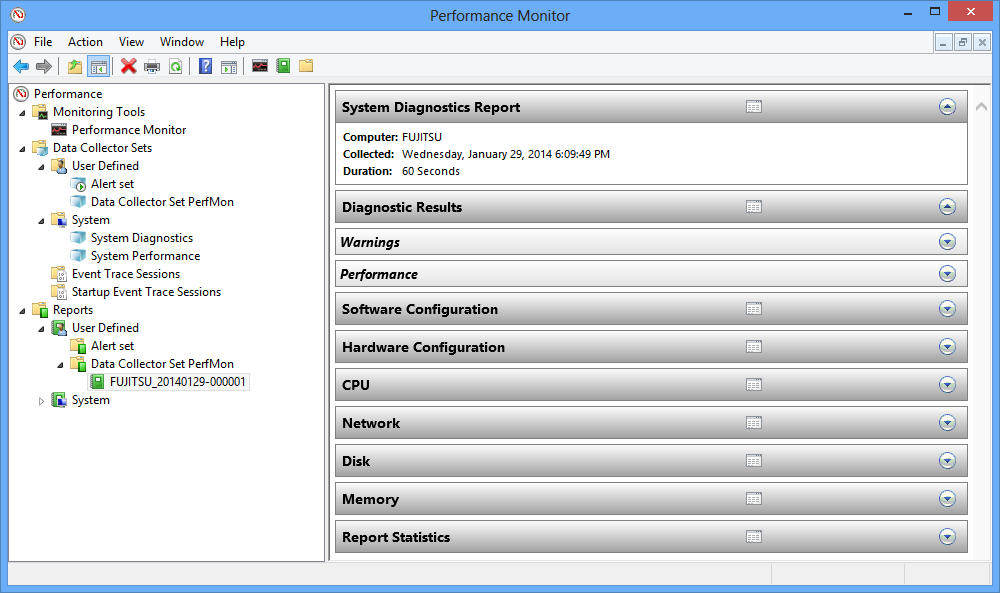
The Reports option available in the Performance Monitor parent snap-in left pane contains a set of templates for presenting the data collected by Data Collector Sets. A report is automatically created for each Data Collector Set, and it can be shown as a text report, with information grouped by their origin into collapsible sections, or as a graph the same as the one for presenting current data or existing logs
“ 性能监视器”父管理单元左窗格中的“报告”选项包含一组模板,这些模板用于显示“数据收集器集”收集的数据 。 将为每个Data Collector Set自动创建一个报告,该报告可以显示为文本报告,并按其来源将信息分组为可折叠的部分,或显示为与当前数据或现有日志相同的图形。
Windows Performance Monitor adds less overhead than SQL Server Data Collector and monitors more SQL Server counters. Besides SQL Server, it monitors the system counters as well. While for Windows Performance Monitor you have to add the counters or counter groups one by one, SQL Server Data Collector has pre-defined collection sets that provide monitoring of the most important parameters, but monitoring additional metrics requires coding. Performance Monitor is available in all Windows Server 2003 and later editions; SQL Server Data Collector is available only in Microsoft SQL Server 2008 and higher, in Standard, Enterprise, Business Intelligence, and Web editions
Windows性能监视器比SQL Server数据收集 器增加的开销更少,并且可以监视更多SQL Server计数器。 除了SQL Server,它还监视系统计数器。 对于Windows Performance Monitor,您必须一一添加计数器或计数器组,而SQL Server Data Collector具有预定义的集合集,这些集合提供对最重要参数的监视,但是监视其他度量标准需要进行编码。 在所有Windows Server 2003和更高版本中都可以使用Performance Monitor 。 SQL Server Data Collector仅在Microsoft SQL Server 2008及更高版本,标准版,企业版,商业智能版和Web版中可用
When it comes to SQL Server Activity Monitor, it provides only a limited set of SQL Server performance metrics and no built-in archiving option for historical data, thus it is useful only for basic performance monitoring
当涉及到SQL Server Activity Monitor时 ,它仅提供一组有限SQL Server性能指标,并且没有用于历史数据的内置存档选项,因此仅对基本性能监视有用。
Windows Performance Monitor is a native and easy to use performance monitoring utility. Besides showing the real time performance data, it can be also used to show the performance history stored in log files. Historical data can be saved for long periods of time, as the log files can be archived to avoid hard disk space problems. It monitors hundreds of performance counters on the local and remote computers with low overhead
Windows Performance Monitor是本机且易于使用的性能监视实用程序。 除了显示实时性能数据外,它还可以用于显示存储在日志文件中的性能历史记录。 历史数据可以保存很长时间,因为可以将日志文件归档以避免硬盘空间问题。 它以较低的开销监视本地和远程计算机上的数百个性能计数器
When it comes to advanced analysis, Performance Monitor cannot provide all required information, nor show a trend line or a threshold in the graph
对于高级分析, Performance Monitor无法提供所有必需的信息,也不能在图中显示趋势线或阈值
翻译自: https://www.sqlshack.com/sql-server-performance-tuning-using-windows-performance-monitor/


 被折叠的 条评论
为什么被折叠?
被折叠的 条评论
为什么被折叠?
 到【灌水乐园】发言


