


关键绩效指标(KPI) (Key Performance Indicator (KPI))
A Key Performance Indicator aka KPI is a metric which objectively measures the numeric equivalent of goals or targets of a company, team or an organization. Any individual or a community which has a numerical target can measure success of their goal with key performance indicators.
关键绩效指标(又称为KPI)是一种客观地衡量公司,团队或组织的目标或指标在数值上相等的指标。 具有数字目标的任何个人或社区都可以使用关键绩效指标来衡量其目标的成功程度。
In all business roles and levels, if you manage a team you most likely have to set at least one key performance indicator and try influence this metric to show a positive result or trend. KPIs should be both logical and achievable. If not, team motivation and morale may decrease as a result of loss of self-confidence. For this reason, we have to be careful and logical when we set key performance indicators. At the same time, we have to check KPIs at regular intervals to determine if they remain valid. We can illustrate a typical KPI life cycle below.
在所有业务角色和级别中,如果您管理团队,则很可能必须设置至少一个关键绩效指标并尝试影响此指标以显示积极的结果或趋势。 KPI应该既合理又可以实现。 如果不是这样,团队信心和士气可能会因失去自信而下降。 因此,在设置关键绩效指标时,我们必须谨慎且合乎逻辑。 同时,我们必须定期检查KPI,以确定它们是否仍然有效。 我们可以在下面说明典型的KPI生命周期。
Define: The key performance indicator should be achievable, logical, simple and understandable.
定义:关键绩效指标应该是可实现的,合乎逻辑的,简单且易于理解的。
Analyze: We have to analyze the result of key performance indicators at regular intervals and compare target and actual values.
分析:我们必须定期分析关键绩效指标的结果,并比较目标值和实际值。
Action: This is the significant process for key performance indicator life cycle. In the analyzing step, we had a basic idea about KPI target value and current value. It means that we measured the difference between KPI target and actual values. If this difference is not acceptable, we have to take action to close the gap and achieve the KPI target value.
行动 :这是关键绩效指标生命周期的重要过程。 在分析步骤中,我们对KPI目标值和当前值有基本的了解。 这意味着我们测量了KPI目标值与实际值之间的差异。 如果这种差异是不可接受的,我们必须采取行动来缩小差距并实现KPI目标值。
Review: In this step, we have to review the result of analysis and actions and check the target goal of key performance indicator value. This value can increase, decrease or may not change at all.
评论:在这一步中, 我们必须检查分析结果和采取的措施,并检查关键绩效指标值的目标。 该值可以增加,减小或完全不变。
Below, you can find some KPI examples.
在下面,您可以找到一些KPI示例。
- Year over year growth. 同比增长。
- Customer lifetime value 客户终生价值
- Return of investments (ROI) 投资回报率(ROI)
After all these explanations about key performance indicators, we can mention introduce SQL Server Reporting Service key performance indicators. SQL Server Reporting Service offers to add KPI objects directly to the web portal. In the SSRS portal we can set a lot of options for KPIs which we’ll be demonstrating.
在对关键性能指标进行了所有这些解释之后,我们可以提及介绍SQL Server Reporting Service关键性能指标。 SQL Server Reporting Service提供了将KPI对象直接添加到Web门户的功能。 在SSRS门户中,我们可以为KPI设置很多选项,我们将对其进行演示。
Demonstration: As a first step, we will generate a synthetic data for key performance indicator. This data includes sales per past years and sales and target of the current year. We can illustrate this sales data in this table.
演示:第一步,我们将为关键绩效指标生成综合数据。 此数据包括过去几年的销售额以及当年的销售额和目标。 我们可以在此表中说明此销售数据。
| Year | Sales | Target of Last Year |
| 2014 | 77 | 81.6 |
| 2015 | 66 | 81.6 |
| 2016 | 50 | 81.6 |
| 2017 | 60 | 81.6 |
| 2018 | 87 | 81.6 |
| 年 | 营业额 | 去年目标 |
| 2014年 | 77 | 81.6 |
| 2015年 | 66 | 81.6 |
| 2016年 | 50 | 81.6 |
| 2017年 | 60 | 81.6 |
| 2018年 | 87 | 81.6 |
The following script will enable us to generate this dataset.
以下脚本将使我们能够生成此数据集。
CREATE TABLE SalesPerYear
 (Id INT PRIMARY KEY IDENTITY(1,1),
SalesYear INT,
Amount Float)


INSERT INTO SalesPerYear
VALUES    ('2014','77'),('2015','66'),('2016','50') ,('2017','60'),('2018','73')
Before, we start to create a KPI in Reporting Service we have to create Data Source and Dataset.
之前,我们开始在Reporting Service中创建KPI,我们必须创建数据源和数据集。
创建数据源 (Creating the Data Source)
Open the SQL Server Reporting Service home page and navigate (+) icon then click Data Source
打开SQL Server Reporting Service主页并导航(+)图标, 然后单击“ 数据源”
Fill the required fields (Name, Description) and click Enable this data source
填写必填字段( Name , Description ),然后单击Enable this data source。
In this step, we will define Connection and Credentials options. We will select connection type and then enter the connection string. Finally, fill the credentials options and click test connection.
在此步骤中,我们将定义“ 连接”和“ 凭据”选项。 我们将选择连接类型,然后输入连接字符串。 最后,填写凭据选项,然后单击“测试连接”。
If you get an error in this step you have to review your connection string and database connection credentials.
如果在此步骤中遇到错误,则必须查看连接字符串和数据库连接凭据。
创建数据集 (Creating a dataset )
In this step, we will create dataset to use for the KPI. The Dataset will allow us to connect the result of query to the key performance indicator object.
在此步骤中,我们将创建用于KPI的数据集。 数据集将使我们能够将查询结果连接到关键绩效指标对象。
Open the SQL Server Reporting Service home page and navigate (+) icon then click Data Set
打开SQL Server Reporting Service主页并导航(+)图标, 然后单击“ 数据集”
When you click Dataset, Microsoft SQL Server Report Builder will open. If SQL Server Report Builder is not installed on your computer, you can click the Get Report Builder link in the pop-up screen which appears in the Reporting Service home page and you can download Report Builder installation package.
当您单击数据集时, Microsoft SQL Server报表生成器将打开。 如果您的计算机上未安装SQL Server Report Builder,则可以单击Reporting Service主页上显示的弹出屏幕中的Get Report Builder链接,也可以下载Report Builder安装包。
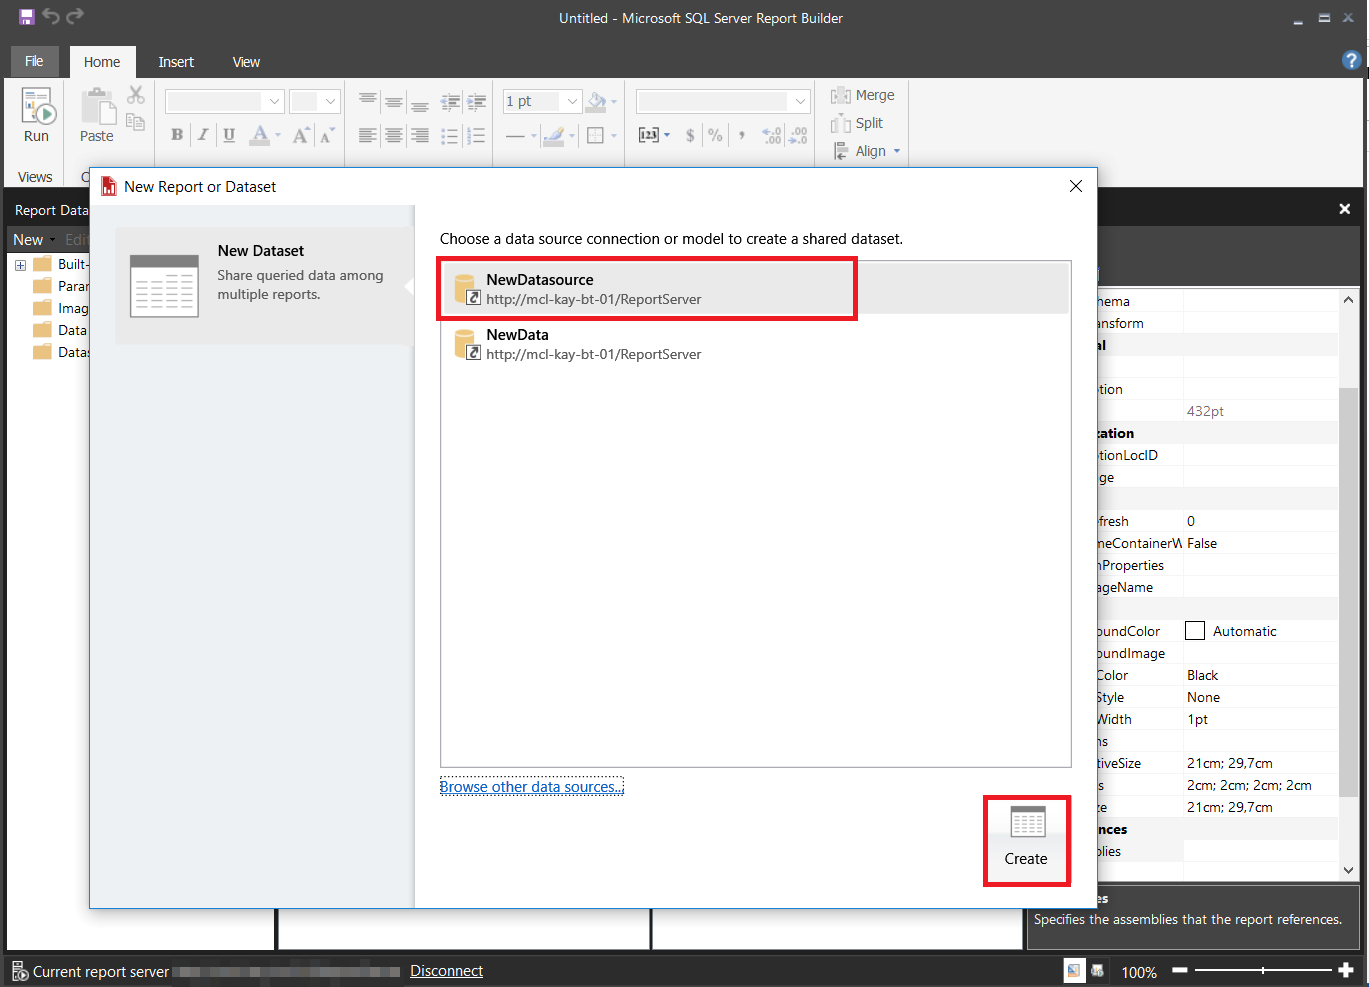
We will select our data source which we defined in the data source step and click Create.
我们将选择在数据源步骤中定义的数据源,然后单击创建 。
In the Dataset panel click Edit as Text.
在“数据集”面板中,单击“ 编辑为文本”。
Write or paste the query to query designer text box. Click (!) run button to test query.
编写或粘贴查询以查询设计器文本框。 单击( ! )运行按钮以测试查询。
SELECT * ,
CASE
WHEN KpiTarget > 	 Amount THEN -1
WHEN 	KpiTarget <	 Amount THEN 1
ELSE
0
END AS Sts
FROM
 (

SELECT * , (SELECT AVG(Sl.Amount)*1.1 FROM SalesPerYear Sl) as KpiTarget

					  FROM SalesPerYear
					  ) as tmp_tbl
					  order by SalesYear ASC
After all these steps, we will save dataset to Reporting Service.
完成所有这些步骤之后,我们将数据集保存到Reporting Service。
创建KPI (Create KPI)
Open the SQL Server Reporting Service home page and navigate (+) icon then click KPI
打开SQL Server Reporting Service主页并导航(+)图标, 然后单击KPI
In the New KPI panel, we can see some options which change KPI visualization
在“ 新建KPI”面板中,我们可以看到一些更改KPI可视化效果的选项
Value Format: This option provides us the option to change the format of the KPI value. In this option, we can choose currency, abbreviated or percent formats.
值格式:此选项为我们提供了更改KPI值格式的选项。 在此选项中,我们可以选择货币,缩写或百分比格式。
Value: This field identifies the actual value of the key performance indicator. This value shows us the current situation.
值:此字段标识关键绩效指标的实际值。 此值向我们显示了当前情况。
Goal: This field identifies target value of key performance indicator.
目标:此字段标识关键绩效指标的目标值。
Status: This field compares the key performance indicator value and goal scores. It has only three options -1 bad, 0 (neutral) and 1 (good). At the same time, this values changes the color of the KPI.
状态:此字段比较关键绩效指标值和目标得分。 它只有三个选项:-1不良,0(中性)和1(良好)。 同时,此值会更改KPI的颜色。
Trend Set: In this field, we can visualize changing of past KPI values in the trend chart. In this demo, the past year’s sales amount can be viewed.
趋势集:在此字段中,我们可以在趋势图中可视化过去KPI值的变化。 在此演示中,可以查看过去一年的销售额。
Visualization: In this option, we can enable and chose the type of trend chart.
可视化:在此 选项,我们可以启用并选择趋势图的类型。
After all these definitions we can start to create a key performance indicator.
在完成所有这些定义之后,我们可以开始创建关键绩效指标。
We will choose Dataset field for Value text box and click browse button.
我们将在“ 值”文本框中选择“ 数据集”字段 ,然后单击“浏览”按钮。
In this screen, we will select the current value in the dataset. According to our demo data, the last year (2018) refers to our current KPI value. Therefore, we will choose Amount field and set aggregation Last.
在此屏幕中,我们将选择数据集中的当前值。 根据我们的演示数据,最后一年(2018)是指我们当前的KPI值。 因此,我们将选择“ 金额”字段并设置汇总Last 。
Now, we will set the Goal field. We will choose Dataset field for Value text box and click browse button. We will choose KPITarget field. All field values are the same which is why the aggregation field can be selected at last or first.
现在,我们将设置“ 目标”字段。 我们将在“ 值”文本框中选择“ 数据集”字段 ,然后单击“浏览”按钮。 我们将选择KPITarget字段。 所有字段值都相同,这就是为什么可以最后或首先选择聚合字段的原因。
We will set the Status field. We will choose Dataset field for Value text box and click browse button. We will choose STS Field.
我们将设置状态字段。 我们将在“ 值”文本框中选择“ 数据集”字段 ,然后单击“浏览”按钮。 我们将选择“ STS字段”。
We will set the Trend Set field. We will choose Dataset field for Value text box and click browse button. We will choose the Amount field.
我们将设置趋势集字段。 我们将在“ 值”文本框中选择“ 数据集”字段 ,然后单击“浏览”按钮。 我们将选择金额字段。
Finally, we will choose Visualization for trend chart and click create.
最后,我们将为趋势图选择“ 可视化 ”,然后单击“创建”。
After all these steps, our KPI is ready.
完成所有这些步骤之后,我们的KPI就可以使用了。
Now we will review part of KPI values with this image
现在,我们将使用此图像查看部分KPI值
- Trend chart 趋势图
- Changing percentage of goal and value of KPI 不断变化的KPI目标和价值百分比
- Actual value of KPI KPI的实际值
- Status field which defines back color of KPI 定义KPI背面颜色的状态字段
结论 (Conclusion )
In this article, we discussed key performance indicators and how to create KPIs in SQL Server Reporting Services. Reporting service KPI‘s are a convenient and efficient way to analyze and compare metrics in SQL Server.
在本文中,我们讨论了关键性能指标以及如何在SQL Server Reporting Services中创建KPI。 报表服务KPI是在SQL Server中分析和比较指标的便捷高效的方法。
参考资料 (References)
- Working with KPIs in Reporting Services 在报表服务中使用KPI
- Introduction to Key Performance Indicators 关键绩效指标简介
- Report Datasets (SSRS) 报告数据集(SSRS)
翻译自: https://www.sqlshack.com/how-to-automatically-create-kpis-in-sql-server-reporting-services/


 486
486

 被折叠的 条评论
为什么被折叠?
被折叠的 条评论
为什么被折叠?
 到【灌水乐园】发言


