


介绍 (Introduction)
This is my second article about Database Experimentation Assistant (DEA). Please refer to my previous article to see how to download and install DEA.
这是我有关数据库实验助手(DEA)的第二篇文章。 请参考我以前的文章,以了解如何下载和安装DEA 。
The Database Experimentation Assistant is the new A/B testing solution for SQL Server upgrades. It enables customers to gather performance insights for upgrades by customers to conduct experiments on production database workloads across two versions of SQL Server.
数据库实验助手是用于SQL Server升级的新A / B测试解决方案。 它使客户能够收集性能见解,以供客户进行升级,从而跨两个版本SQL Server对生产数据库工作负载进行实验。
Analysis metrics reports provided by the tool, will give information about queries that have compatibility errors, queries performance and other workload comparison data so it can transmit to the customer a higher confidence for a successful migration project.
该工具提供的分析指标报告将提供有关存在兼容性错误的查询,查询性能和其他工作负载比较数据的信息,从而可以将更高的信心传递给客户,以帮助其成功完成迁移项目。
It supports migrating from SQL Server 2005 or higher versions to SQL Server 2012 and higher versions.
它支持从SQL Server 2005或更高版本迁移到SQL Server 2012和更高版本。
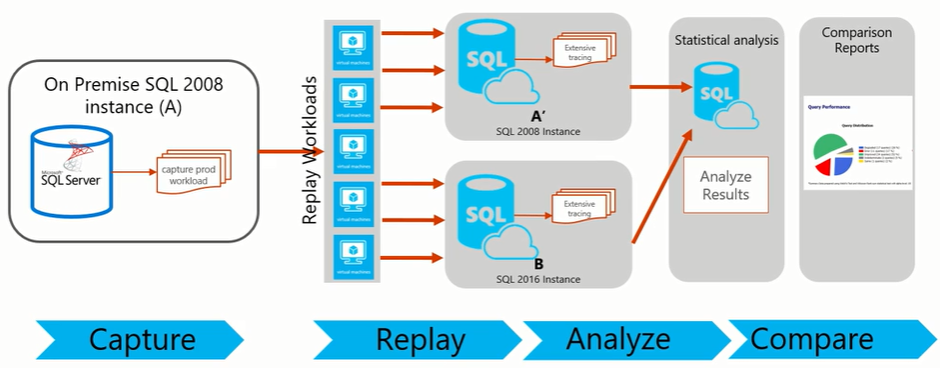
Below is an image representing DEA’s high-level architecture. Any of those tasks are DEA’s application options and each of them will be explained in this article.
下面是代表DEA的高级体系结构的图像。 这些任务中的任何一个都是DEA的应用程序选项,本文将对每个任务进行说明。
NOTE: In the time I’m writing this article, DEA still in Technical-Preview release, meaning that things can slightly change in future releases but in general do not expect big changes from what is described in this article.
注意: 在撰写本文时,DEA仍在技术预览版中,这意味着将来的发行版中可能会稍有变化,但通常不会期望本文中所述的内容有大的变化。
如何使用 (How to use)
After DEA has been installed (please refer to my previous article to see how to download and install DEA.) you can click on the icon in the desktop area
安装DEA后(请参阅我的上一篇文章,了解如何下载和安装DEA 。),您可以单击桌面区域中的图标。
This will start Database Experimentation Assistant by loading the following windows as startup screen:
这将通过加载以下窗口作为启动屏幕来启动数据库实验助手:
The tool has three main features:
该工具具有三个主要功能:
- Capture Workload: Ability to automatically capture a production workload trace with only a few inputs. 捕获工作负载:仅需少量输入即可自动捕获生产工作负载跟踪的功能。
- Replay Workload: Ability to replay a trace on current and new/proposed instances of SQL. 重播工作负载:能够重播有关当前和新的/建议SQL实例的跟踪。
- Analysis Reports: Ability to generate new reports which provide insight into how workload performance changes across versions of SQL. In addition to generating a new report, there is also the ability to view reports which have been previously generated. 分析报告:能够生成新报告,从而提供洞悉SQL版本之间工作负载性能如何变化的见解。 除了生成新报告之外,还可以查看以前生成的报告。
捕获工作量 (Capture Workload)
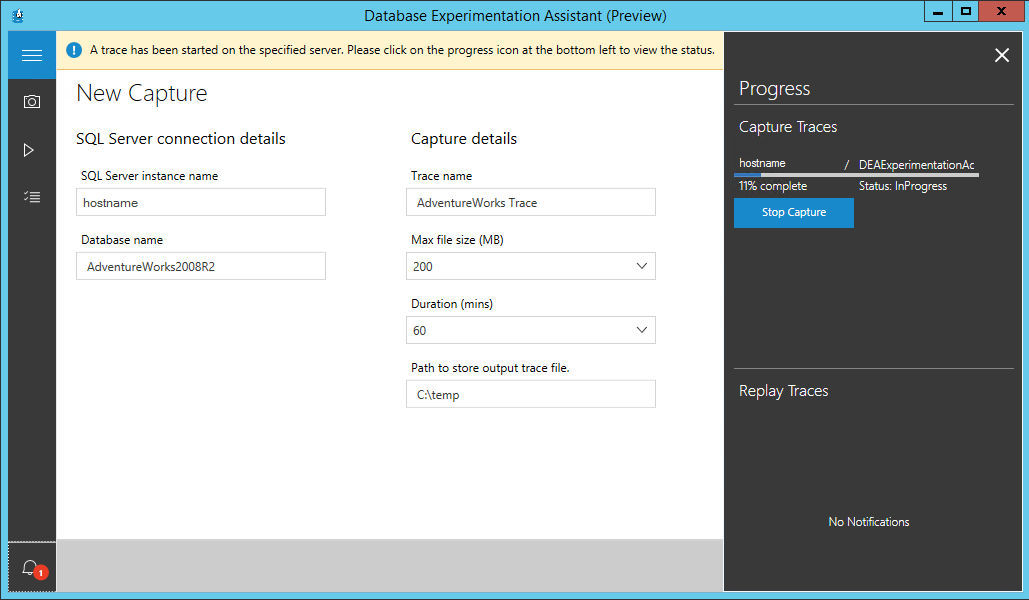
Use this option to capture a workload from the source SQL Server instance by producing a trace file (.trc) containing a log of the events occurred on the specified server within a given period of time. This action will ask for the input of some necessary information to produce the necessary trace file:
使用此选项,可以通过生成跟踪文件(.trc)来捕获源SQL Server实例中的工作负载,该文件包含指定时间内在指定服务器上发生的事件的日志。 此操作将要求输入一些必要的信息以生成必要的跟踪文件:
You will need to provide the connection details to the SQL Server instance name where you want to run the trace to capture the Database activities. If you do not specify a database name the trace will capture the activities on all the databases on the SQL Server instance.
您将需要提供您要在其中运行跟踪以捕获数据库活动的SQL Server实例名称的连接详细信息。 如果未指定数据库名称,则跟踪将捕获SQL Server实例上所有数据库上的活动。
Note: Be sure that the user that is running the Capture has the necessary permissions to start a trace in the desired SQL Server instance. Also, confirm if there is any firewall protecting the related SQL Server, there are rules to permit the current machine to access the source SQL Server instance.
注意:确保运行Capture的用户具有必要的权限,可以在所需SQL Server实例中启动跟踪。 另外,请确认是否有保护相关SQL Server的防火墙,是否存在允许当前计算机访问源SQL Server实例的规则。
Give the Trace a name and specify the destination path for the trace file. Configure the max file size for rollover and duration of the trace in minutes. Default values are 200MB and 60 minutes, respectively.
给跟踪命名,并指定跟踪文件的目标路径 。 配置滚动的最大文件大小和跟踪持续时间(以分钟为单位)。 默认值分别为200MB和60分钟。
Note: The file path to trace file must be on the source SQL Server machine the MSSQL instance is on. Write permissions to the specified folder from the SQL Service account it is needed in order for the trace file to be written.
注意:跟踪文件的文件路径必须在MSSQL实例所在的源SQL Server计算机上。 从SQL Service帐户向指定文件夹具有写权限,以便写入跟踪文件。
Click on the Start button to initiate the new trace file capture. If there are invalid inputs they will be highlighted and you are able to provide the correct information and after that click again on the Start button to begin the capture trace process. You will be able to see a message stating that the trace has been started and running.
单击开始按钮以启动新的跟踪文件捕获。 如果输入无效,它们将被突出显示,并且您能够提供正确的信息,然后再次单击“ 开始”按钮以开始捕获跟踪过程。 您将看到一条消息,指出跟踪已启动并正在运行。
While waiting for the end of the capture trace process, you can monitor the progress of the capture by clicking on the bell icon at the bottom left of the navigation pane.
在等待捕获跟踪过程结束时,您可以通过单击导航窗格左下角的钟形图标来监视捕获的进度。
After successfully finished the Capture process, copy the generated trace file or files to the machine where you have the Distributed Replay Controller. You will need it for the next step.
成功完成捕获过程后,将生成的一个或多个跟踪文件复制到装有分布式重放控制器的计算机上。 下一步将需要它。
重播工作量 (Replay Workload)
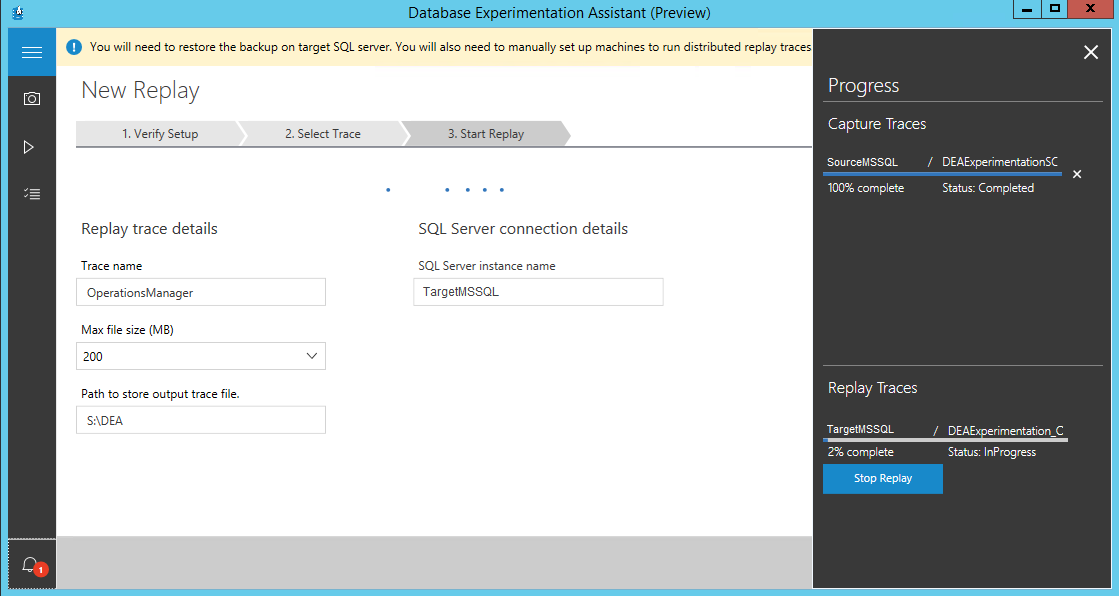
Replay trace allows you to replay the previously created trace file (.trc) on another SQL Server instance.
重播跟踪允许您在另一个SQL Server实例上重播以前创建的跟踪文件(.trc)。
This action needs to be performed twice. Once for the source SQL Server instance (A) and once for the Target upgraded SQL Server instance (B).
此操作需要执行两次。 一次用于源SQL Server实例(A),一次用于目标已升级SQL Server实例(B)。
Check the call for attention on this screen. It says that a backup of the database or databases from the source SQL Server instance needs to be restored in the target SQL Server instance. The necessary databases are the ones included in the trace captured in the previous step.
在此屏幕上检查呼叫是否引起注意。 它表示需要在目标SQL Server实例中还原来自源SQL Server实例的数据库的备份。 必要的数据库是上一步捕获的跟踪中包含的数据库。
It also says that to perform this action you must manually set up machines to run distributed replay (D-Replay) traces. Read my article about how to set up a SQL Server Distributed Replay to know how to use it.
它还说,要执行此操作,您必须手动设置计算机以运行分布式重放(D-Replay)跟踪。 阅读有关如何设置SQL Server分布式重放的文章,以了解如何使用它。
Assuming that the backup of the necessary databases have been restored and the Distribution Replay environment is set then is time to initiate a new replay.
假设已经还原了必要数据库的备份并设置了“分发重放”环境,那么现在该启动新的重放了。
In the Verify Setup tab, provide the SQL Server install path (actually is the root path for the Tools) and end it with the backslash (‘\’). Example for MSSQL 2014 default installation path: C:\Program Files (x86)\Microsoft SQL Server\120\
在“ 验证设置”选项卡中,提供SQL Server安装路径 (实际上是工具的根路径),并以反斜杠('\')结束。 MSSQL 2014默认安装路径示例: C:\ Program Files(x86)\ Microsoft SQL Server \ 120 \
Provide the D-Replay Controller machine name and the respective Clients that you want to use by separating them with a comma (‘,’):
通过用逗号(',')分隔它们来提供D-Replay Controller计算机名称和要使用的各个客户端 :
Press Next to continue.
按下一步继续。
On the second tab (Select Trace) provide the path for the trace captured before (you must include the trace file name in the path) and provide also the path where you want the intermediate file to be created by the preprocess task of the Distributed Replay.
在第二个选项卡(“ 选择跟踪” )上,提供之前捕获的跟踪的路径(您必须在路径中包括跟踪文件名),并提供希望通过“分布式重放”的预处理任务在其中创建中间文件的路径。 。
NOTE: Those paths must exist in the SQL Server Distributed Replay Controller machine.
注意:这些路径必须存在于SQL Server分布式重播控制器计算机中。
Press Next to continue.
按下一步继续。
In the third and last tab (Start Replay), provide the Trace name, Max file size and the target SQL Server instance as well the path to store the output trace files (should be a folder that exists in a SQL Server instance and a SQL Server service account needs to write permissions on it)
在第三个也是最后一个选项卡(“ 开始重放” )中,提供“ 跟踪”名称 ,“ 最大文件大小”和目标SQL Server实例 ,以及存储输出跟踪文件的路径 (应该是SQL Server实例和SQL中存在的文件夹服务器服务帐户需要对其具有写权限)
NOTE: At the first interaction you should provide the source SQL Server instance and then on the second interaction provide the target SQL Server instance name.
注意:在第一个交互中,您应该提供源SQL Server实例,然后在第二个交互中提供目标SQL Server实例名称。
If the inputs are valid, click on the Start button so Replay process will start.
如果输入有效,请单击“ 开始”按钮,以便开始重放过程。
While waiting for the end of the Replay task to finish, you can monitor the progress of the task by clicking on the bell icon at the bottom left of the navigation pane.
在等待重播任务结束时,您可以通过单击导航窗格左下方的响铃图标来监视任务的进度。
After the Replay finishes running for the source SQL Server instance (A), repeat the steps for this task now providing the necessary information for the target SQL Server instance (B).
在源SQL Server实例(A)的重播完成运行之后,现在重复执行此任务的步骤,即可为目标SQL Server实例(B)提供必要的信息。
分析报告 (Analysis Reports)
This option needs some components as prerequisites so when choosing this option, if you see a similar screen to the below, please refer to my previous article to see how to download and install DEA and read the respective Requested components section.
此选项需要一些组件作为先决条件,因此在选择此选项时,如果看到与以下类似的屏幕,请参阅我以前的文章,以了解如何下载和安装DEA并阅读相应的“ 请求的组件”部分。
If or when you have all the requested components then you should see a similar screen as below.
如果或者当您拥有所有要求的组件时,您应该会看到类似的屏幕,如下所示。
Click on the + New analysis report to create a new report or to access to a previously created report, provide the SQL Server instance name in the Connect to server field a click on the Connect button. This will load the available analysis reports stored in the given SQL Server instance so you can choose which one you want to review.
单击+新建分析报告以创建新报告或访问以前创建的报告,在“ 连接到服务器”字段中提供SQL Server实例名称,然后单击“ 连接”按钮。 这将加载存储在给定SQL Server实例中的可用分析报告,因此您可以选择要查看的报告。
By clicking on + New analysis report it will present the below screen and you need to fill the fields by providing a name for the Report and providing the SQL Server instance name where the Analysis databases will be created.
通过单击+新建分析报告 ,它将显示以下屏幕,您需要通过提供报告名称并提供将在其中创建分析数据库的SQL Server实例名称来填充字段。
Also, provide the location and the file name for the Trace for source server (the first trace file name originated from the Replay task on the Source server) as well location and the file name for the Trace for target server (the first trace file name originated from the Replay task on the Target server).
另外,提供源服务器跟踪的位置和文件名(第一个 跟踪文件名源自源服务器上的Replay任务)以及目标服务器跟踪的位置和文件名(第一个 跟踪文件名)源于目标服务器上的重播任务)。
Note: If those trace files are not stored on the local machine you will need to provide the full network path as \\servername\sharename$\tracefilename.trc.
注意:如果这些跟踪文件未存储在本地计算机上,则需要提供完整的网络路径为\\ servername \ sharename $ \ tracefilename.trc 。
Click the Start button to generate the Reports.
单击开始按钮以生成报告。
You can follow the progress on the right pane where you will see three phases:
您可以在右侧窗格中跟踪进度,在该窗格中您将看到三个阶段:
- Import Trace A – Loads the trace originated from the Replay task on the Source server. In the SQL Server instance provided for the Analysis option, you will see the creation of a database called 导入跟踪A –将源自重播任务的跟踪加载到源服务器上。 在为Analysis选项提供SQL Server实例中,您将看到一个名为A<Report name><unique identifier>. A <Report name> <unique identifier>的数据库的创建。
- Import Trace B – Loads the trace originated from the Replay task on the Target server. In the SQL Server instance provided for the Analysis option, you will see the creation of a database called 导入跟踪B –将源自“重播”任务的跟踪加载到目标服务器上。 在为Analysis选项提供SQL Server实例中,您将看到名为B< Report name><unique identifier>. B <报告名称> <唯一标识符>的数据库的创建。
- Prepare Analysis – Analysis the result of the previous two imports. In the SQL Server instance provided for the Analysis option, you will see the creation of a database called 准备分析 –分析前两次导入的结果。 在为Analysis选项提供SQL Server实例中,您将看到名为Analysis< Report name><unique identifier>Analysis <报告名称> <唯一标识符>
比较 (Compare)
When all the above phases finish successfully it will present the Analysis Report where you can compare the queries execution against the Source and Target SQL Server instances.
上述所有阶段均成功完成后,将显示分析报告,您可以在其中比较源SQL Server和目标SQL Server实例的查询执行情况。
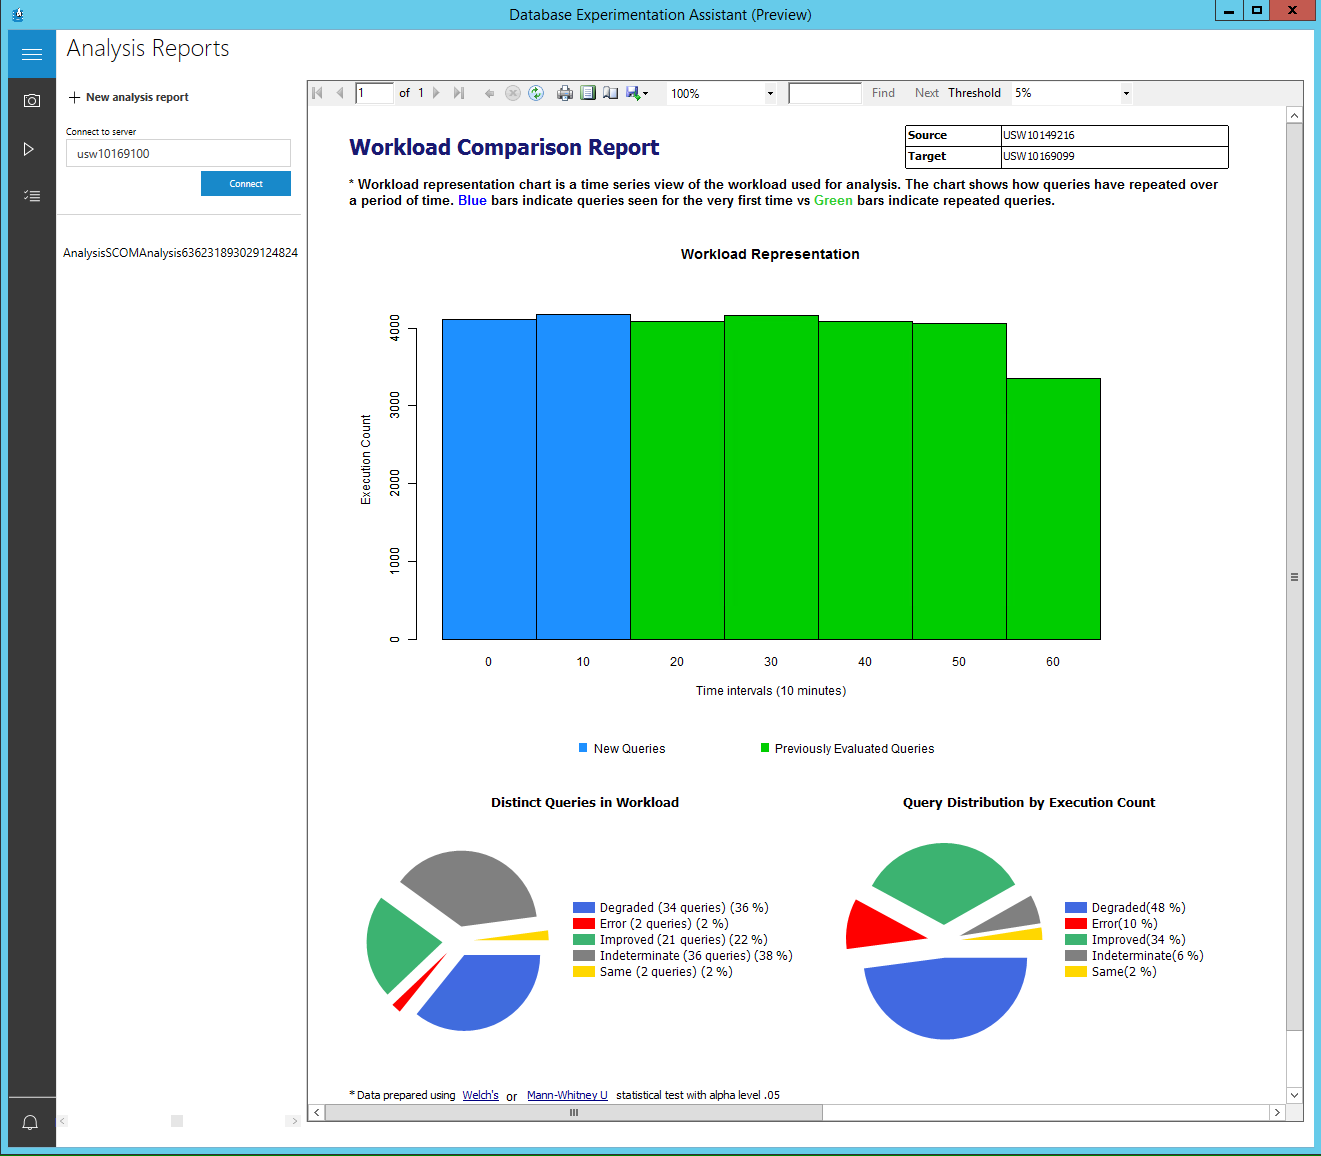
The Analysis Report let you drill down into each item to identify the problematic queries so they can be fixed. In my example, if I click in Error (red slice) I will get the following report:
通过“分析报告”,您可以深入研究每个项目以识别有问题的查询,以便对其进行修复。 在我的示例中,如果单击“ 错误” (红色切片),则会得到以下报告:
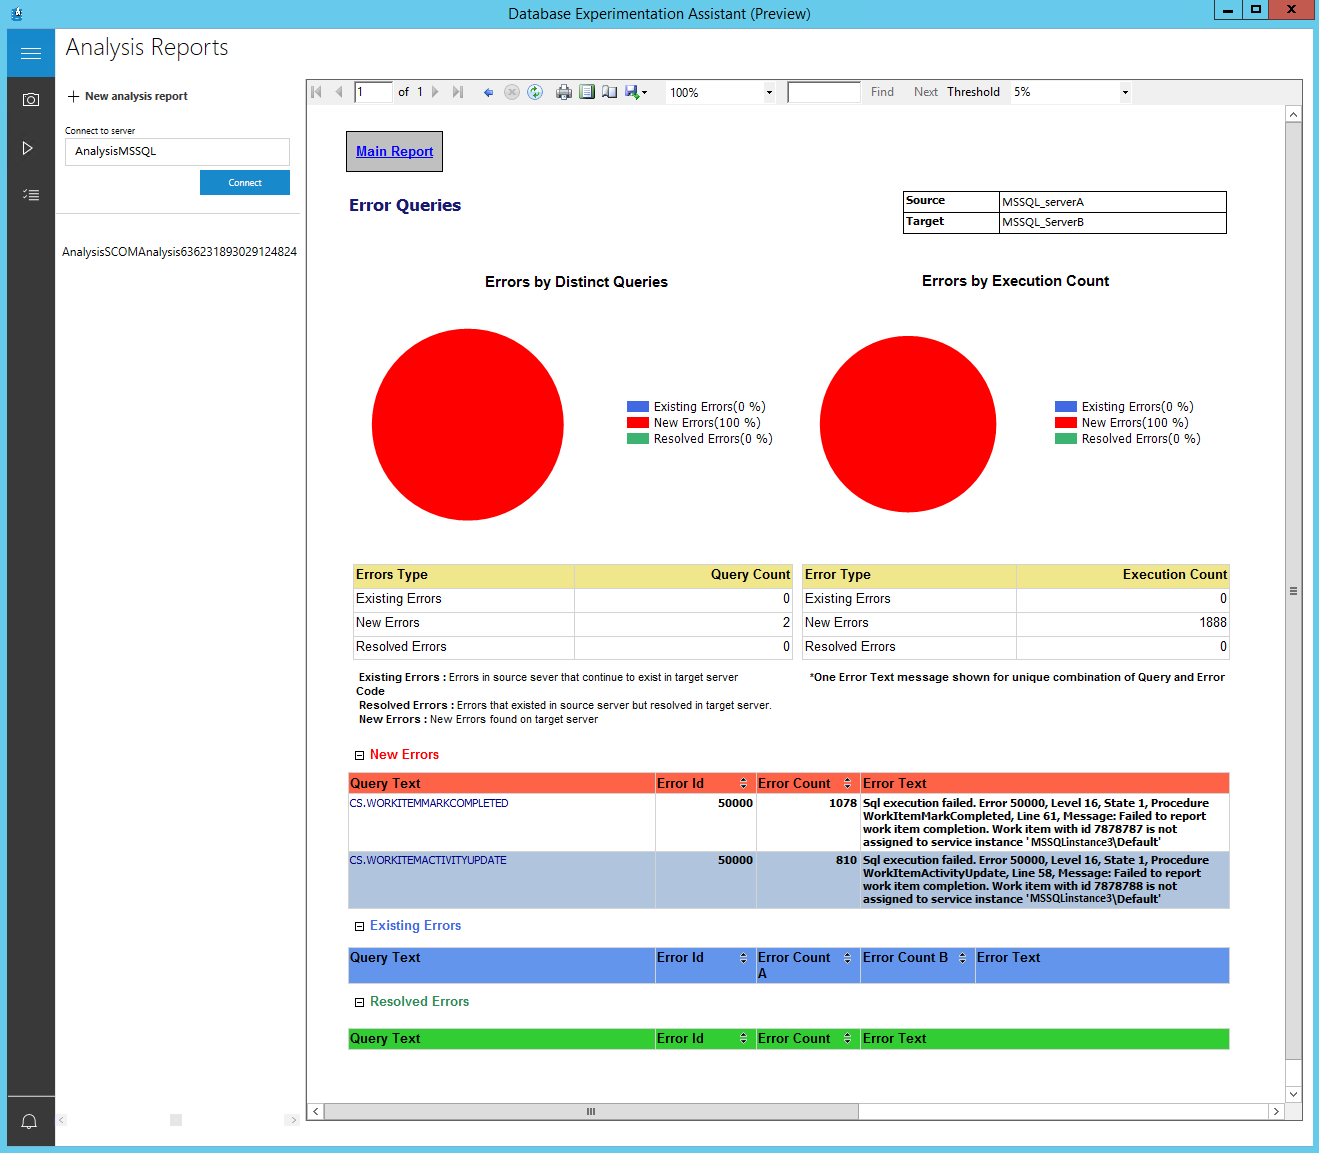
In the query table, it is possible to see which queries returned errors and the respective error messages. In my case, the errors occurred because my target SQL Server instance does not have access to the referred SQL Server instance (MSSQLinstance3\Default).
在查询表中,可以查看哪些查询返回了错误以及相应的错误消息。 就我而言,发生错误是因为目标SQL Server实例无权访问引用SQL Server实例( MSSQLinstance3 \ Default )。
Clicking in the Main Report button it will return to the main Analysis Report and we can click on other items. For example for Degraded queries (blue slice) where it will present a table with the queries and how much it took for running in Source and Target server and how much is the difference between them:
单击主报告按钮,它将返回到主分析报告,我们可以单击其他项目。 例如,对于降级查询(蓝色切片),它将在其中提供带有查询的表,以及在源服务器和目标服务器中运行需要花费多少,以及它们之间的区别是多少:
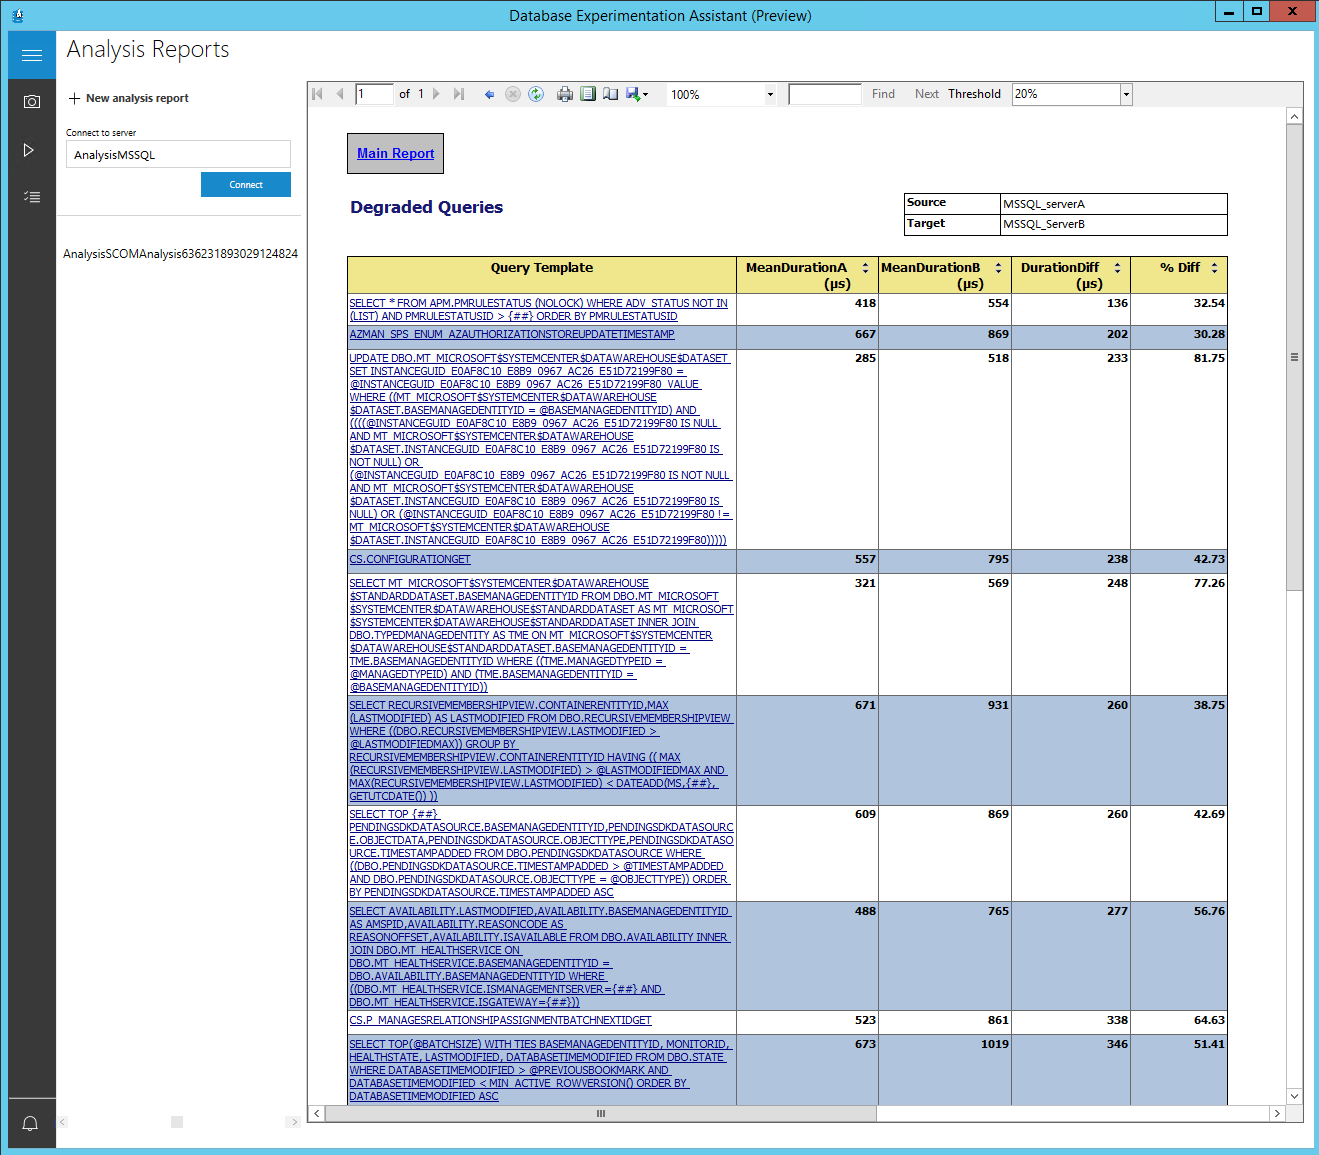
You can drill down even more by clicking in the query and you will have access to more information including the query plan for each server so you can look for issues and try to find a solution to solve them.
您可以通过单击查询来进一步展开操作,并且可以访问更多信息,包括每台服务器的查询计划,以便您查找问题并尝试找到解决问题的解决方案。
This is how you should evaluate the issues and accept them “as is” or try to solve them. You can return and run the Analysis Report as many times you want and need until all the issues are solved. IN this way DEA is a tool to attest a migration and provide information on expected issues so you can have time to solve those issues before advancing in definitive with the migration.
这是您应该评估问题并“按原样”接受或尝试解决问题的方式。 您可以根据需要多次返回并运行分析报告,直到解决所有问题为止。 通过这种方式,DEA是证明迁移并提供有关预期问题的信息的工具,因此您可以在最终进行迁移之前有时间解决这些问题。
Other articles in this series:
本系列的其他文章:
- How to download and install the SQL Server Database Experimentation Assistant (DEA) 如何下载和安装SQL Server数据库实验助手(DEA)
- How to download and install the SQL Server Database Experimentation Assistant (DEA v2.0) 如何下载和安装SQL Server数据库实验助手(DEA v2.0)
参考文献: (References:)
- Technical preview: Database Experimentation Assistant 技术预览:数据库实验助手
- Database Experimentation Assistant – FAQ 数据库实验助手–常见问题
- How to use DEA tool 如何使用DEA工具
翻译自: https://www.sqlshack.com/how-to-use-the-sql-server-database-experimentation-assistant-dea-tool/


 1383
1383

 被折叠的 条评论
为什么被折叠?
被折叠的 条评论
为什么被折叠?
 到【灌水乐园】发言


