


墨鏡的bism
介绍 (Introduction)
One of a database designers’ worst nightmares is having to design a database for business analysts and data stewards whom insist upon creating their own reports, using Excel as a GUI. The reason that I mention this is that user created reports often open up “Pandora’s box”; with many of these folks creating their own ‘miss-information’ due to a lack of understanding of the underlying data. A few weeks back I had the ’fortune’ of working on such a project, which prompted an ‘ah-ha’ moment. I decided to design the backend SQL Server database using the Business Intelligence Semantic Model (BISM) and to employ the super set of tools provided by Microsoft Power BI, with Excel as a GUI. The end results were wildly accepted by the user community and once you see how easy this is to apply, you will be ‘chomping on the bit’ to employ the same techniques on your own user driven projects.
数据库设计师最糟糕的噩梦之一是必须为业务分析师和数据管理员设计数据库,这些分析师坚持使用Excel作为GUI创建自己的报告。 我之所以这样说,是因为用户创建的报告经常会打开“ Pandora的盒子”。 由于缺乏对底层数据的理解,许多这样的人创建了自己的“缺失信息”。 几周前,我有从事这样一个项目的“财富”,这引发了“啊哈”的时刻。 我决定使用商业智能语义模型(BISM)设计后端SQL Server数据库,并采用Microsoft Power BI提供的超级工具集,并以Excel作为GUI。 最终结果被用户社区广泛接受,一旦您知道这是多么容易应用,您将“急切地”在您自己的用户驱动项目中采用相同的技术。
初步研究 (The preliminary research)
Upon examining the existing data stores, I noted that most of the client’s data resided in spreadsheets. In order to show you the reader how we accomplished the conversion, I shall be using non confidential data readily available on the internet.
在检查现有的数据存储后,我注意到大多数客户的数据都位于电子表格中。 为了向读者展示我们如何完成转换,我将使用Internet上随时可用的非机密数据。
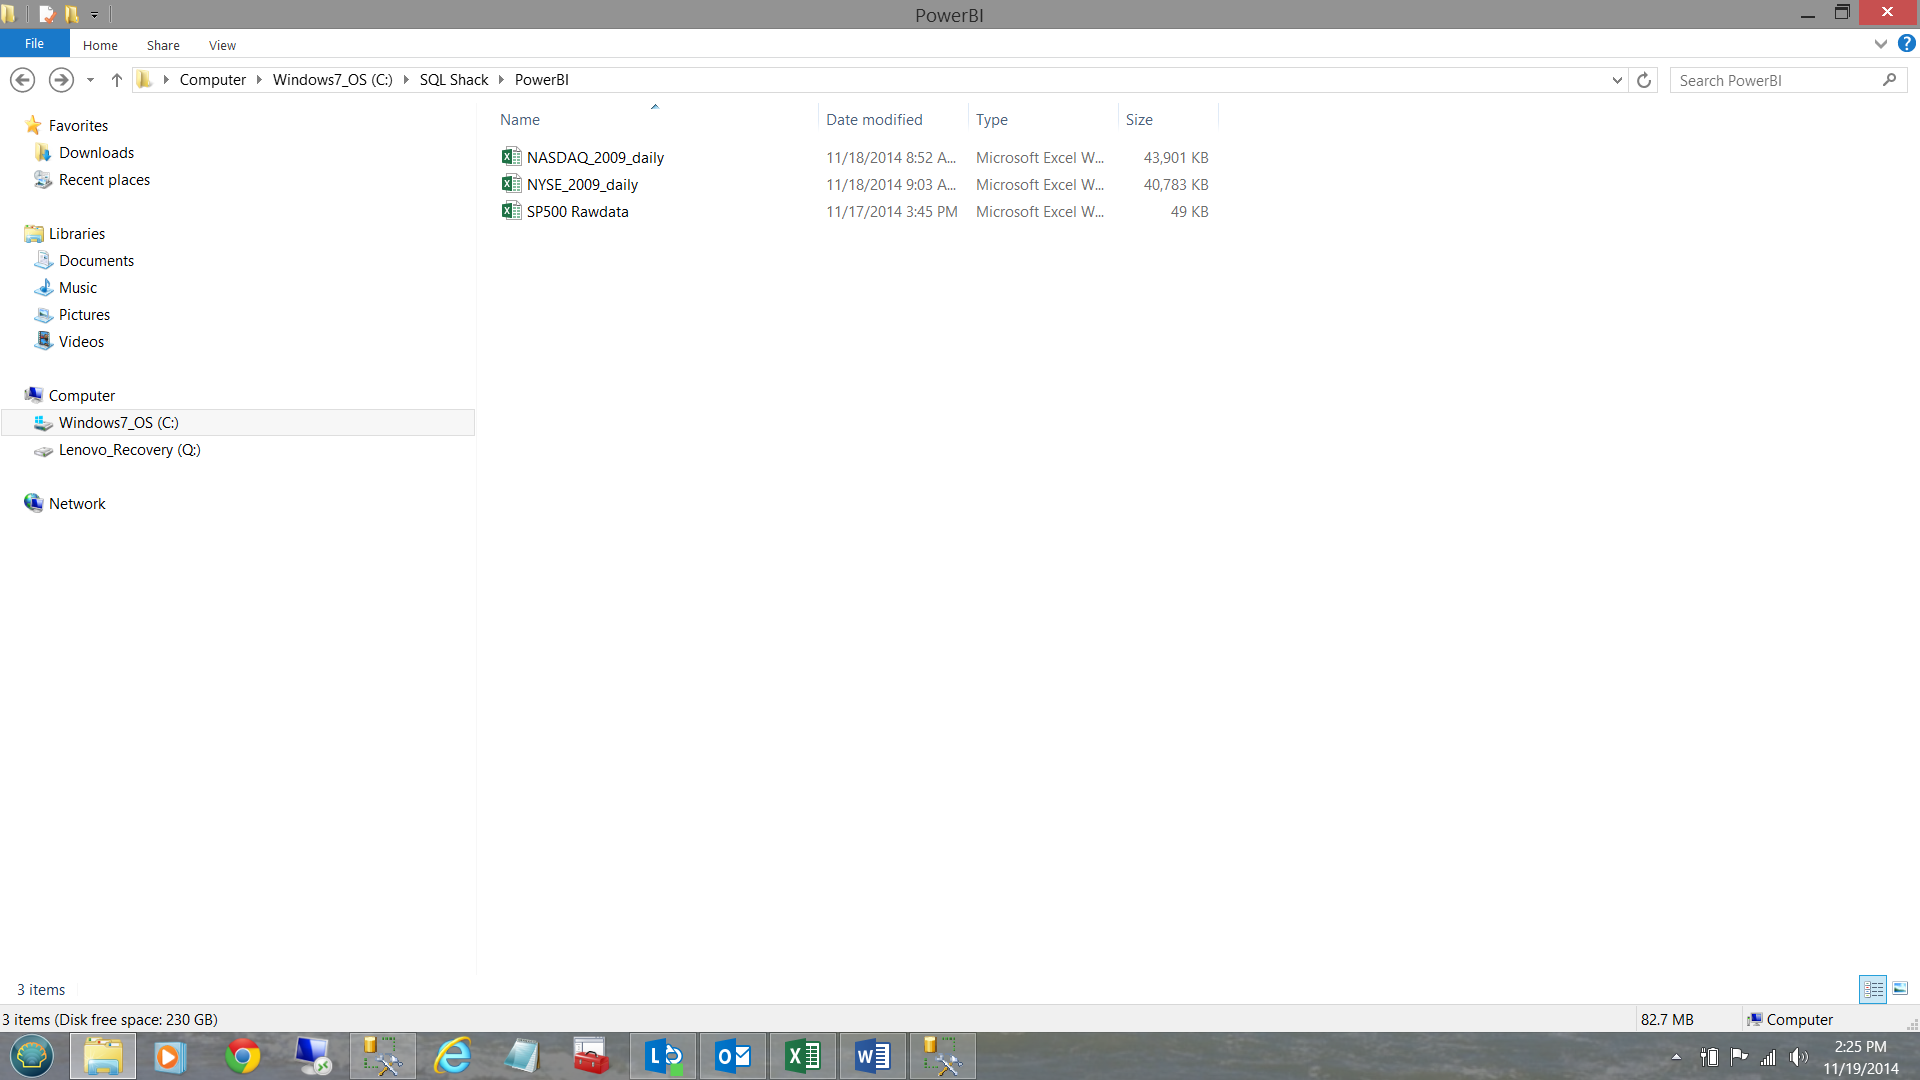
Our first step is to load the data from these spreadsheets into a relational database which I have called ‘SQLShackFinancial’. The spreadsheets contain data from varied exchanges such S&P, NYSE and the NASDAQ.
我们的第一步是将这些电子表格中的数据加载到我称为“ SQLShackFinancial”的关系数据库中。 电子表格包含来自不同交易所的数据,例如标准普尔,纽约证券交易所和纳斯达克。
As a final note, this exercise utilizes SQL Server 2012 Enterprise Edition or SQL Server 2012 Developer Edition as this is the first version that offers Tabular Model facilities. You may also utilize the same 2014 editions.
最后一点,本练习利用了SQL Server 2012 Enterprise Edition或SQL Server 2012 Developer Edition,因为这是第一个提供表格模型功能的版本。 您也可以使用相同的2014版。
入门 (Getting started)
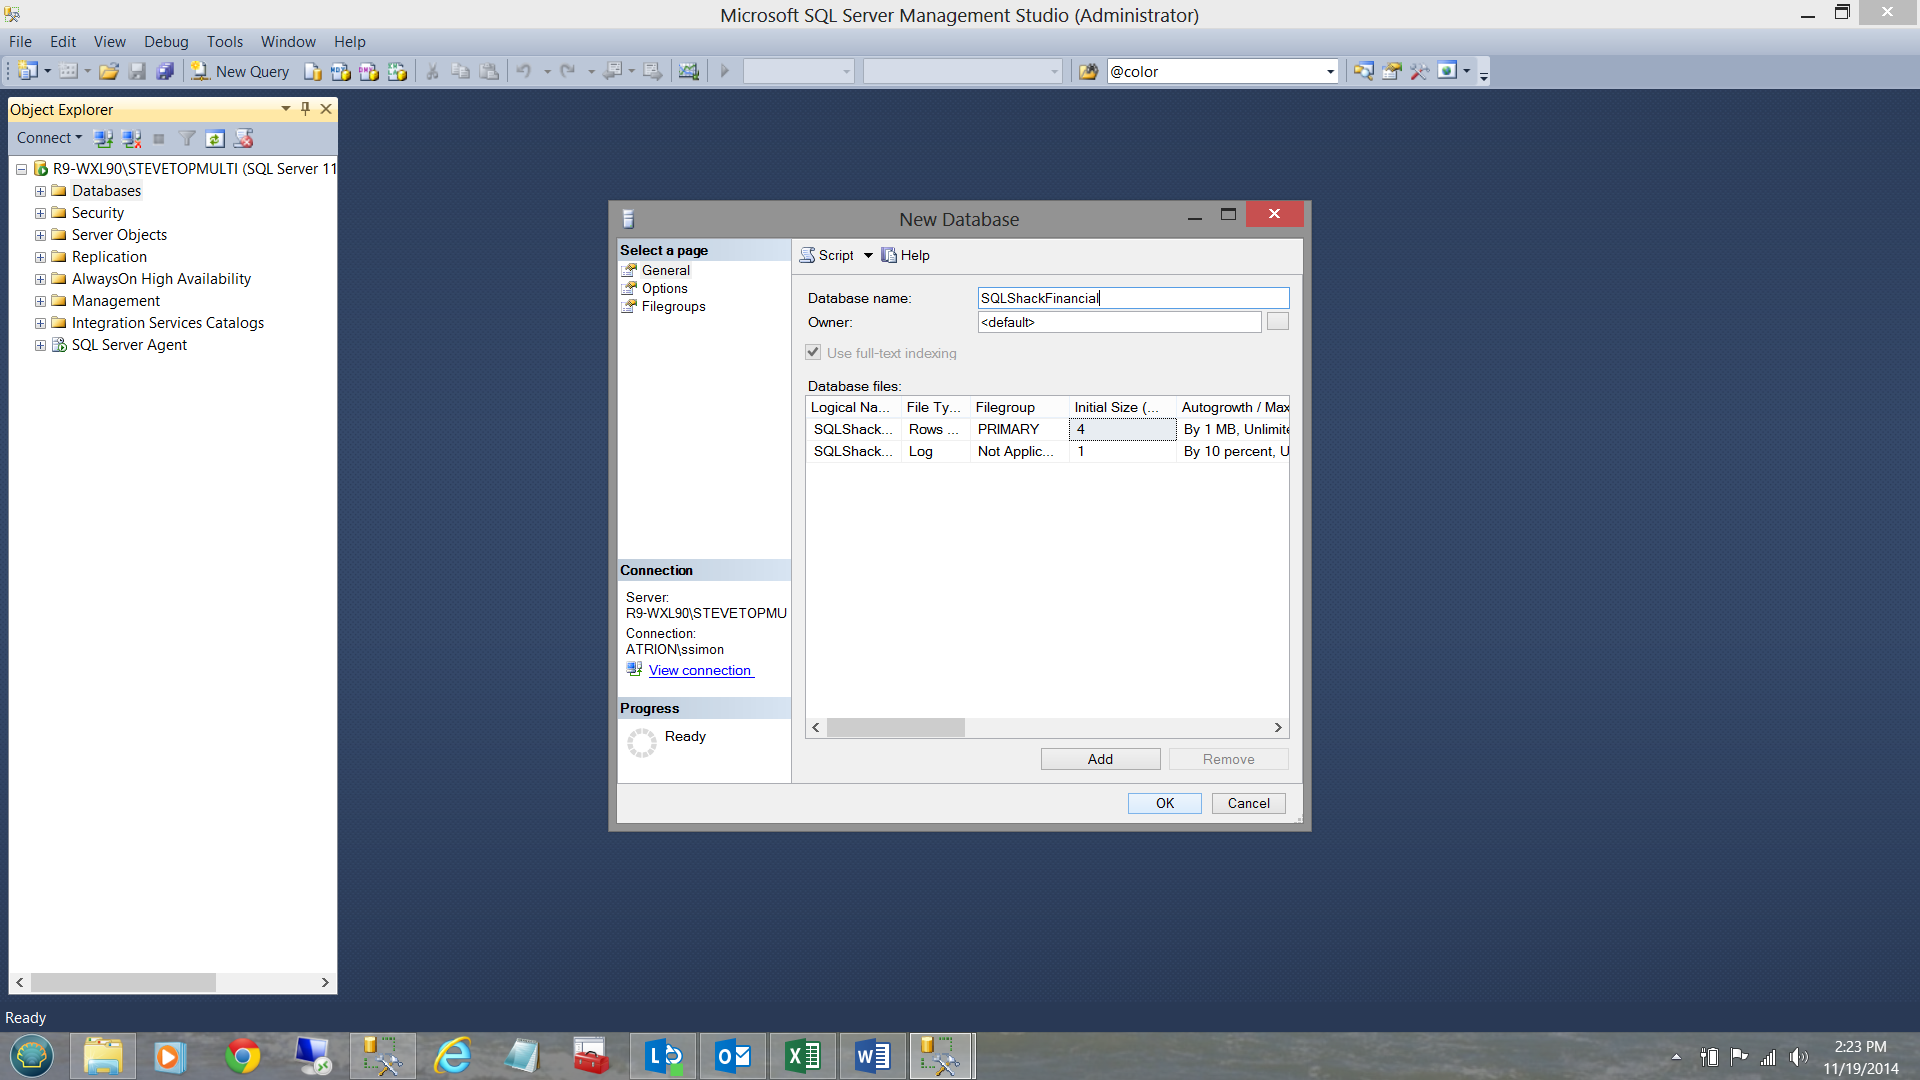
We begin our journey within SQL Server Management Studio (SSMS) by creating a normal relational database called ‘SQLShackFinancial’ (see below).
我们通过创建一个称为“ SQLShackFinancial”的常规关系数据库(请参见下文)开始在SQL Server Management Studio(SSMS)中的旅程。
Our next task is to load the data from the spreadsheets shown below:
我们的下一个任务是从如下所示的电子表格加载数据:
Now, we could use the ‘load wizard’ within SSMS, however the wizard is great for one offs. In our case the client wishes to reload the tables on a daily basis and therefore we shall opt for creating an SQL Server Integration Services package.
现在,我们可以在SSMS中使用“加载向导”,但是该向导非常有用。 在我们的情况下,客户希望每天重新加载表,因此,我们将选择创建SQL Server Integration Services程序包。
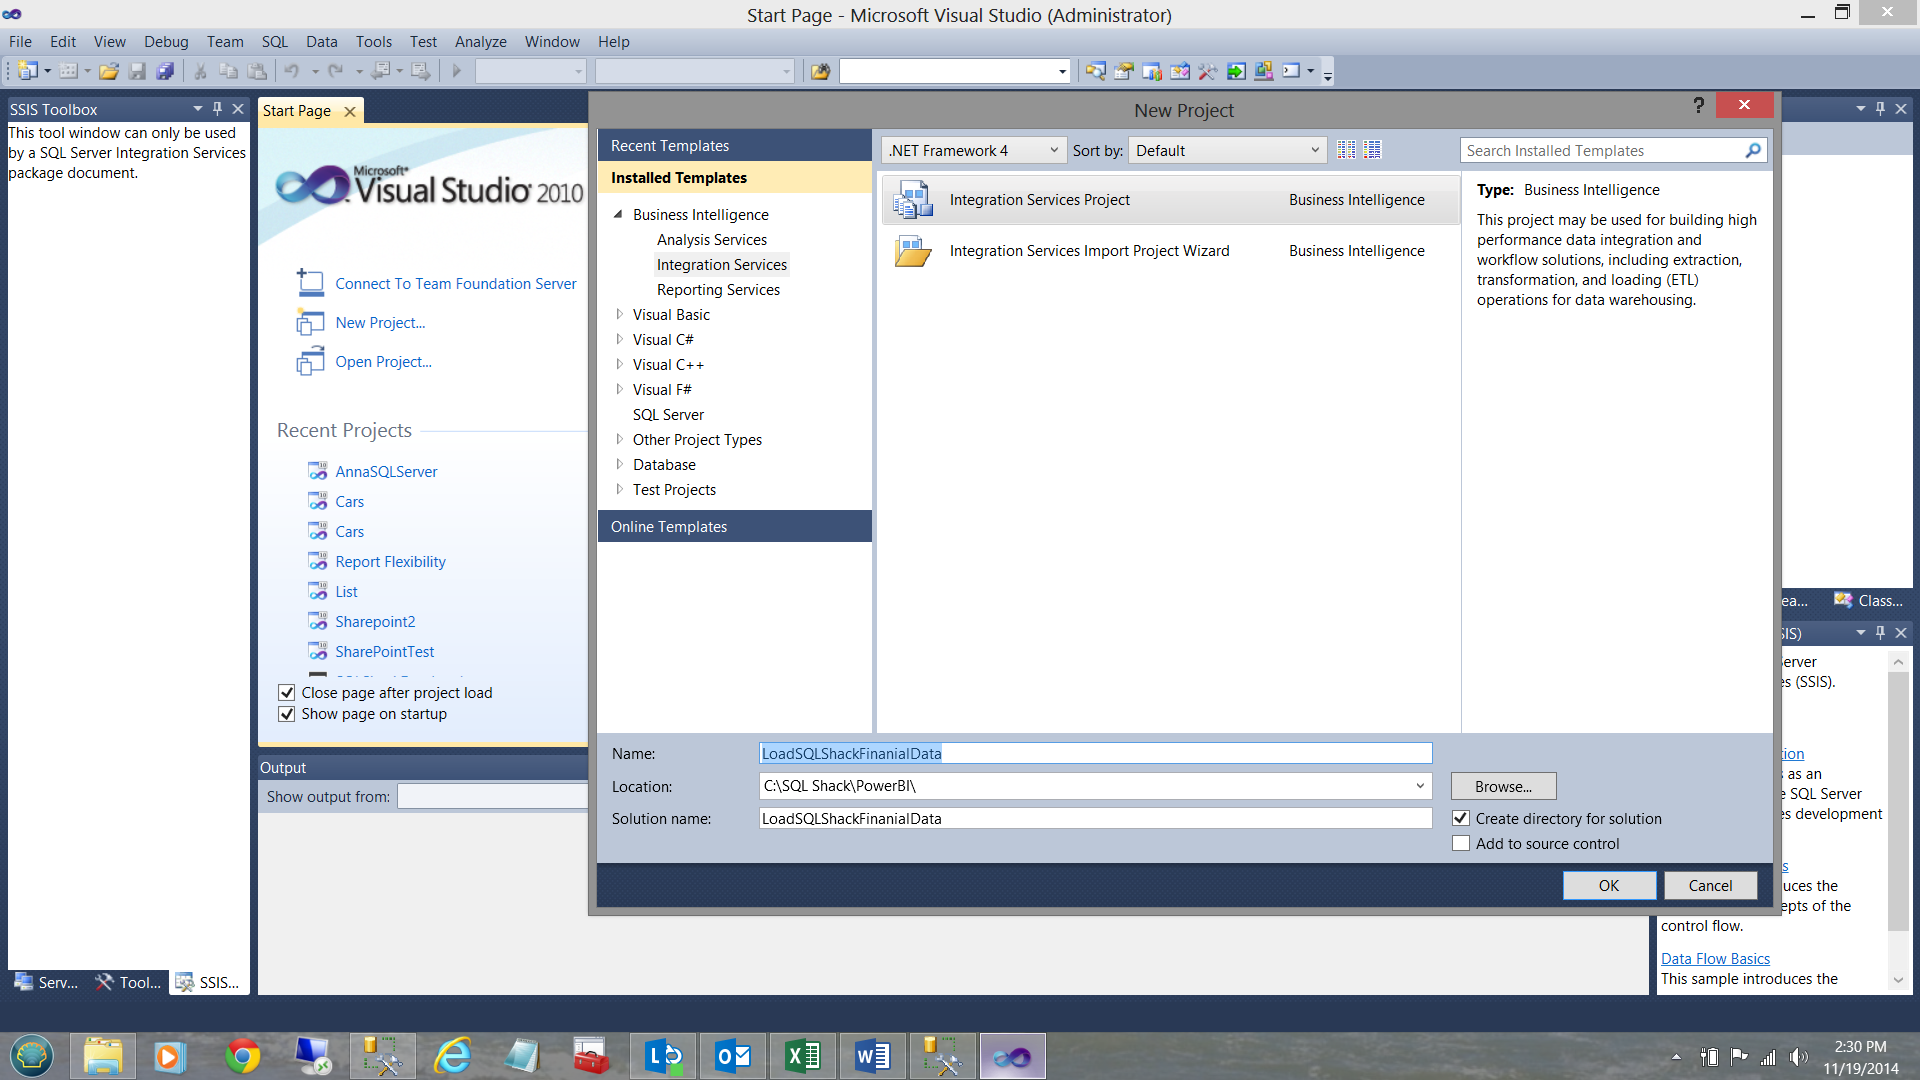
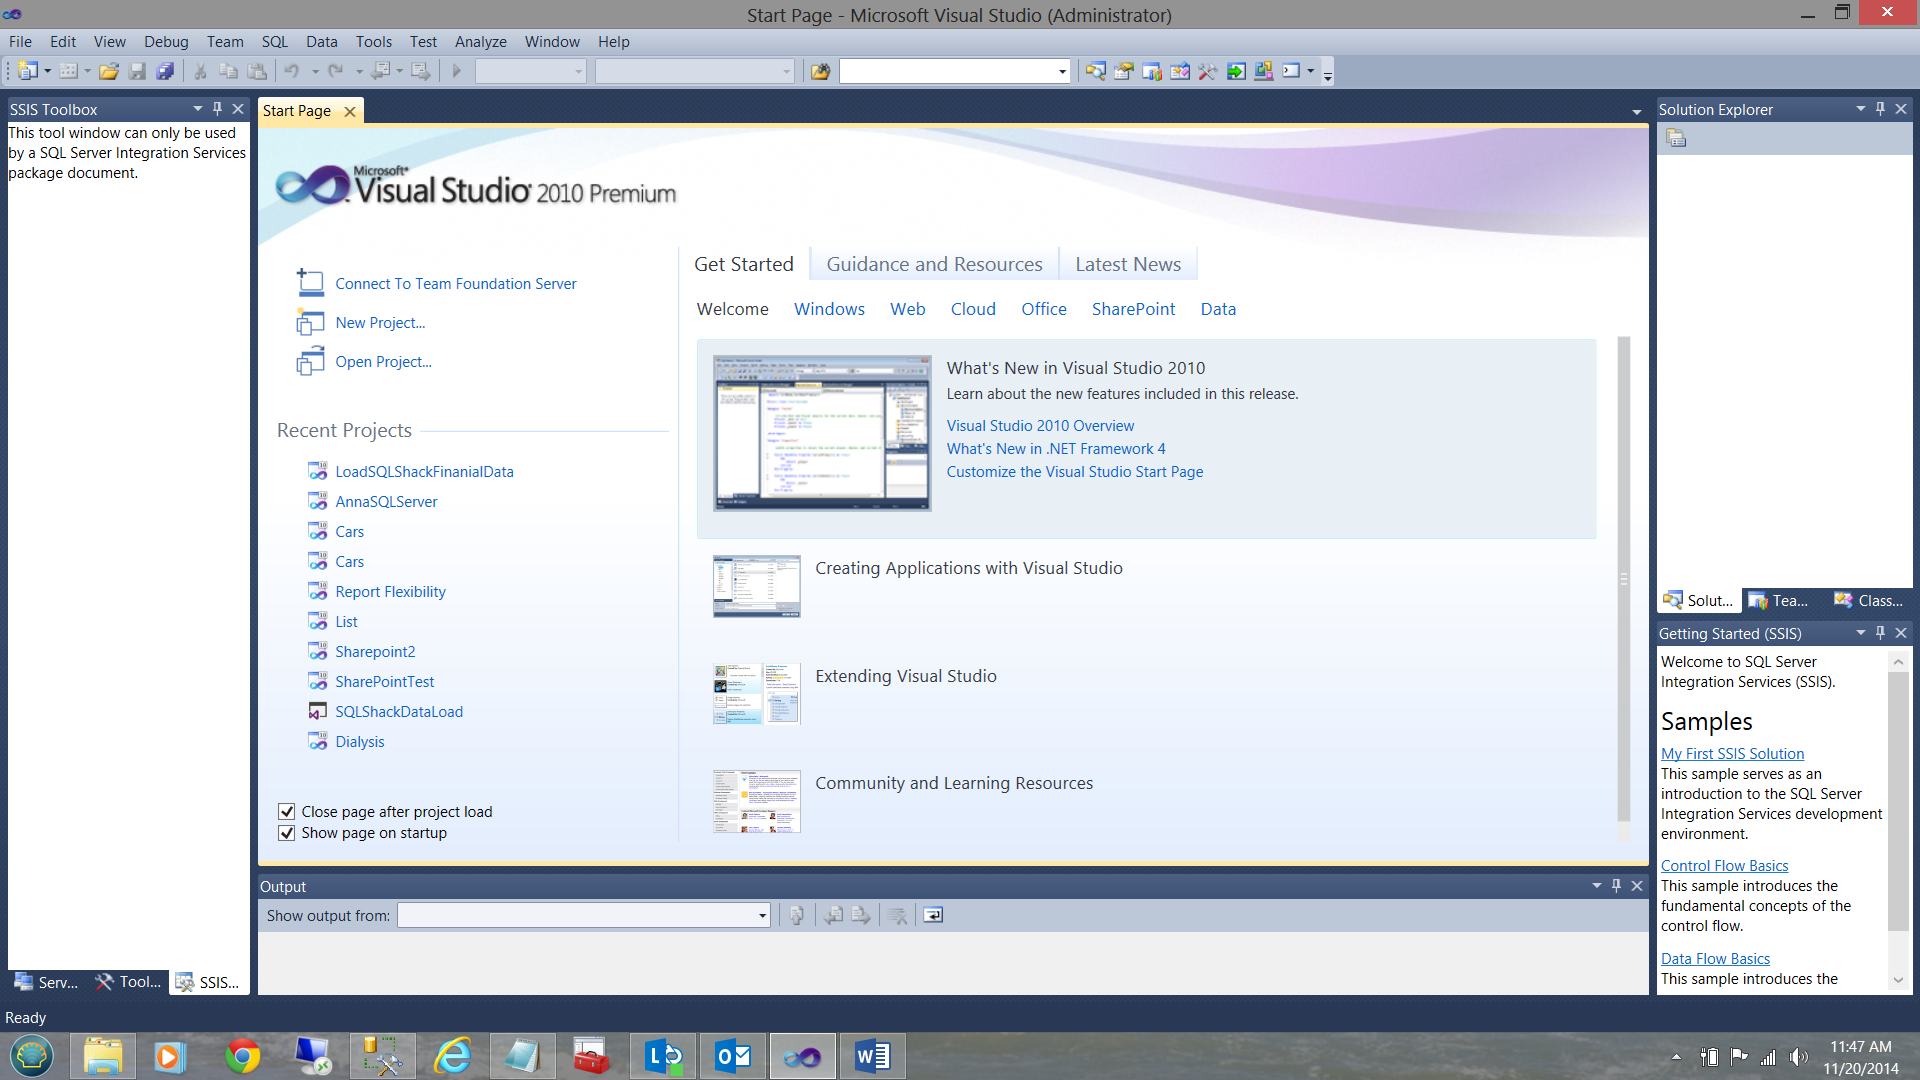
I start by bring up SQL Server Data Tools (SSDT) and creating a new SQL Server Integration Services package. I call my project ‘LoadSQLShackFinancialData’ (see below).
首先,启动SQL Server数据工具(SSDT)并创建一个新SQL Server Integration Services程序包。 我称我的项目为“ LoadSQLShackFinancialData”(见下文)。
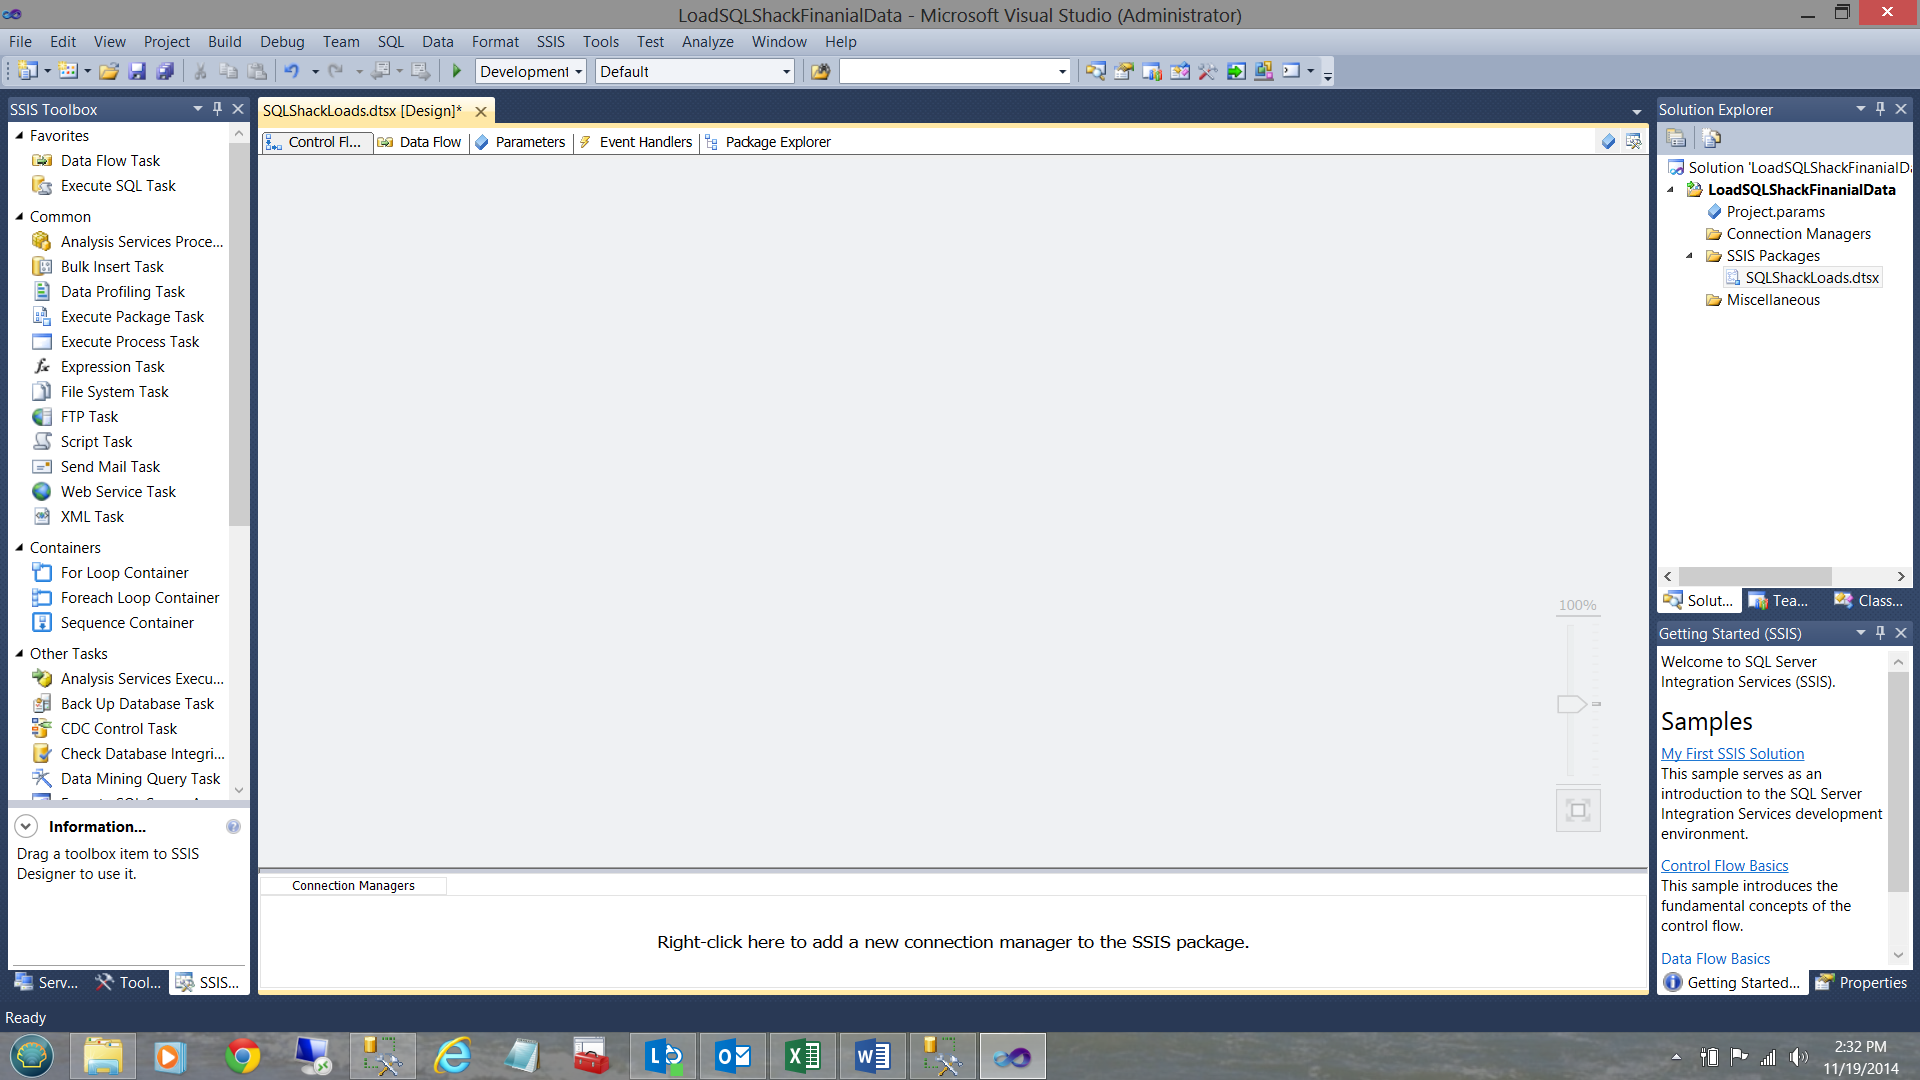
Upon clicking OK to create the package, I arrive at ‘Control Flow’ work surface where I shall begin to structure the load package.
单击“确定”以创建程序包后,我到达“控制流”工作台,在这里我将开始构造装载程序包。
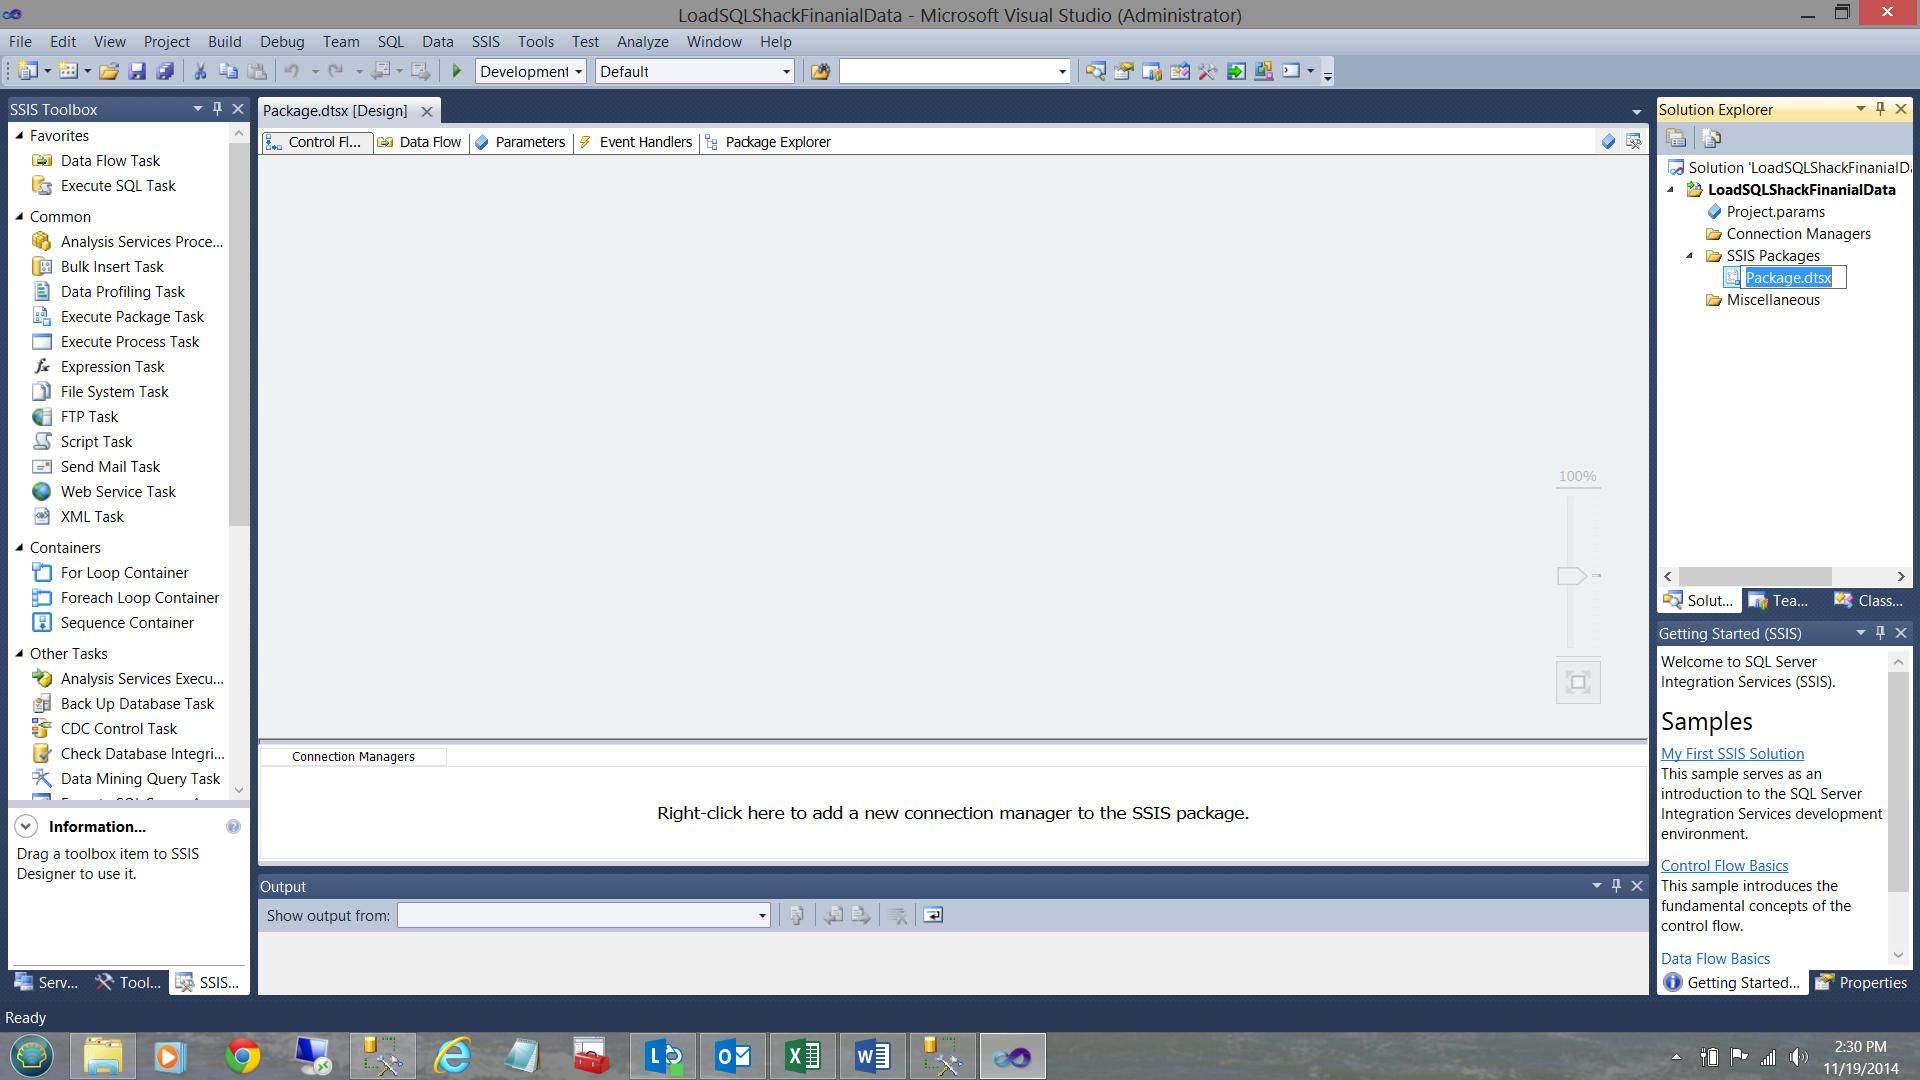
I rename the package to ‘SQLShackLoads’.
我将包重命名为“ SQLShackLoads”。
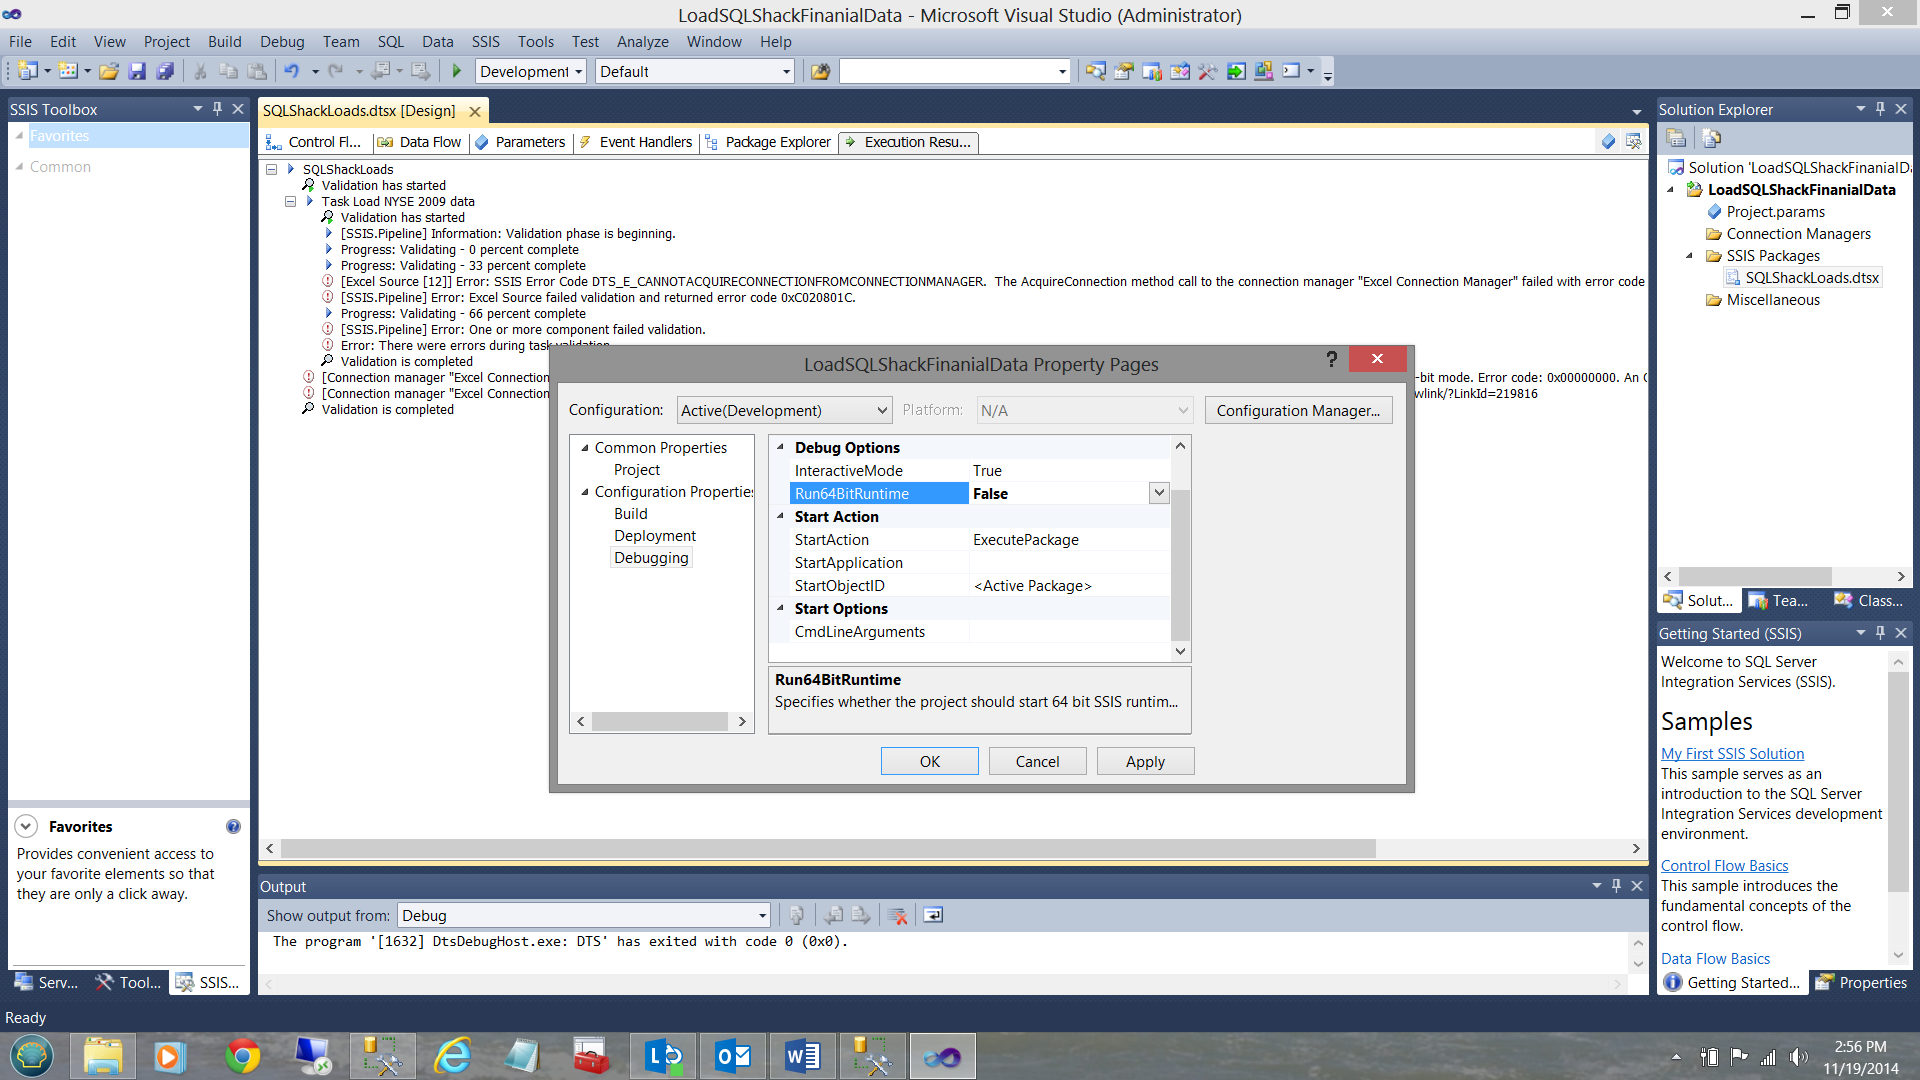
Clicking on the project tab of the menu bar, I call up the project properties page. I expand the ‘Configuration Properties’ menu and set the Run64BitRunTime to ‘False’ (see above). I click apply and OK.
单击菜单栏的项目选项卡,我调出项目属性页面。 我展开“配置属性”菜单,并将Run64BitRunTime设置为“ False”(请参见上文)。 我单击“应用”,然后单击“确定”。
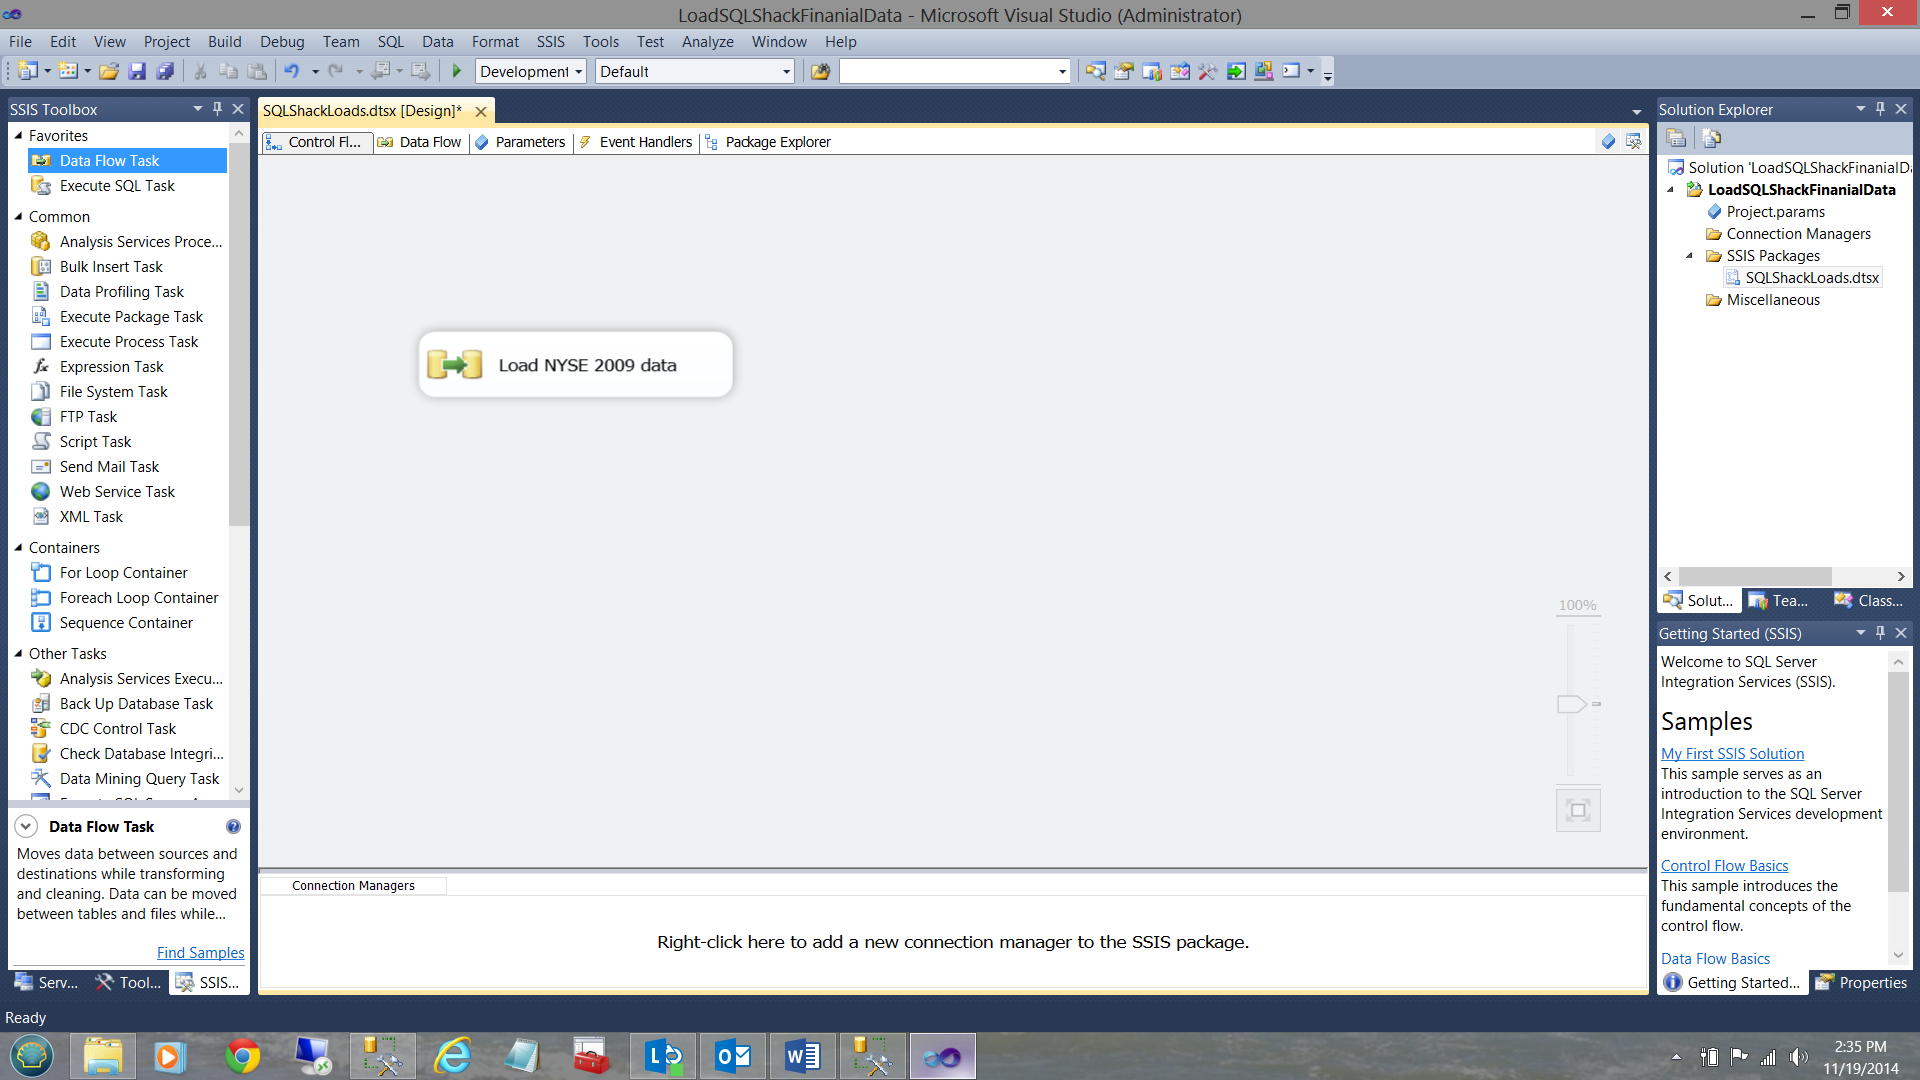
I now drag a ‘Data Flow Task’ onto the working surface of the Control Flow and rename that Data Flow ‘Load NYSE 2009 data’ (see below).
现在,我将“数据流任务”拖到控制流的工作面上,并将该数据流重命名为“加载NYSE 2009数据”(请参见下文)。
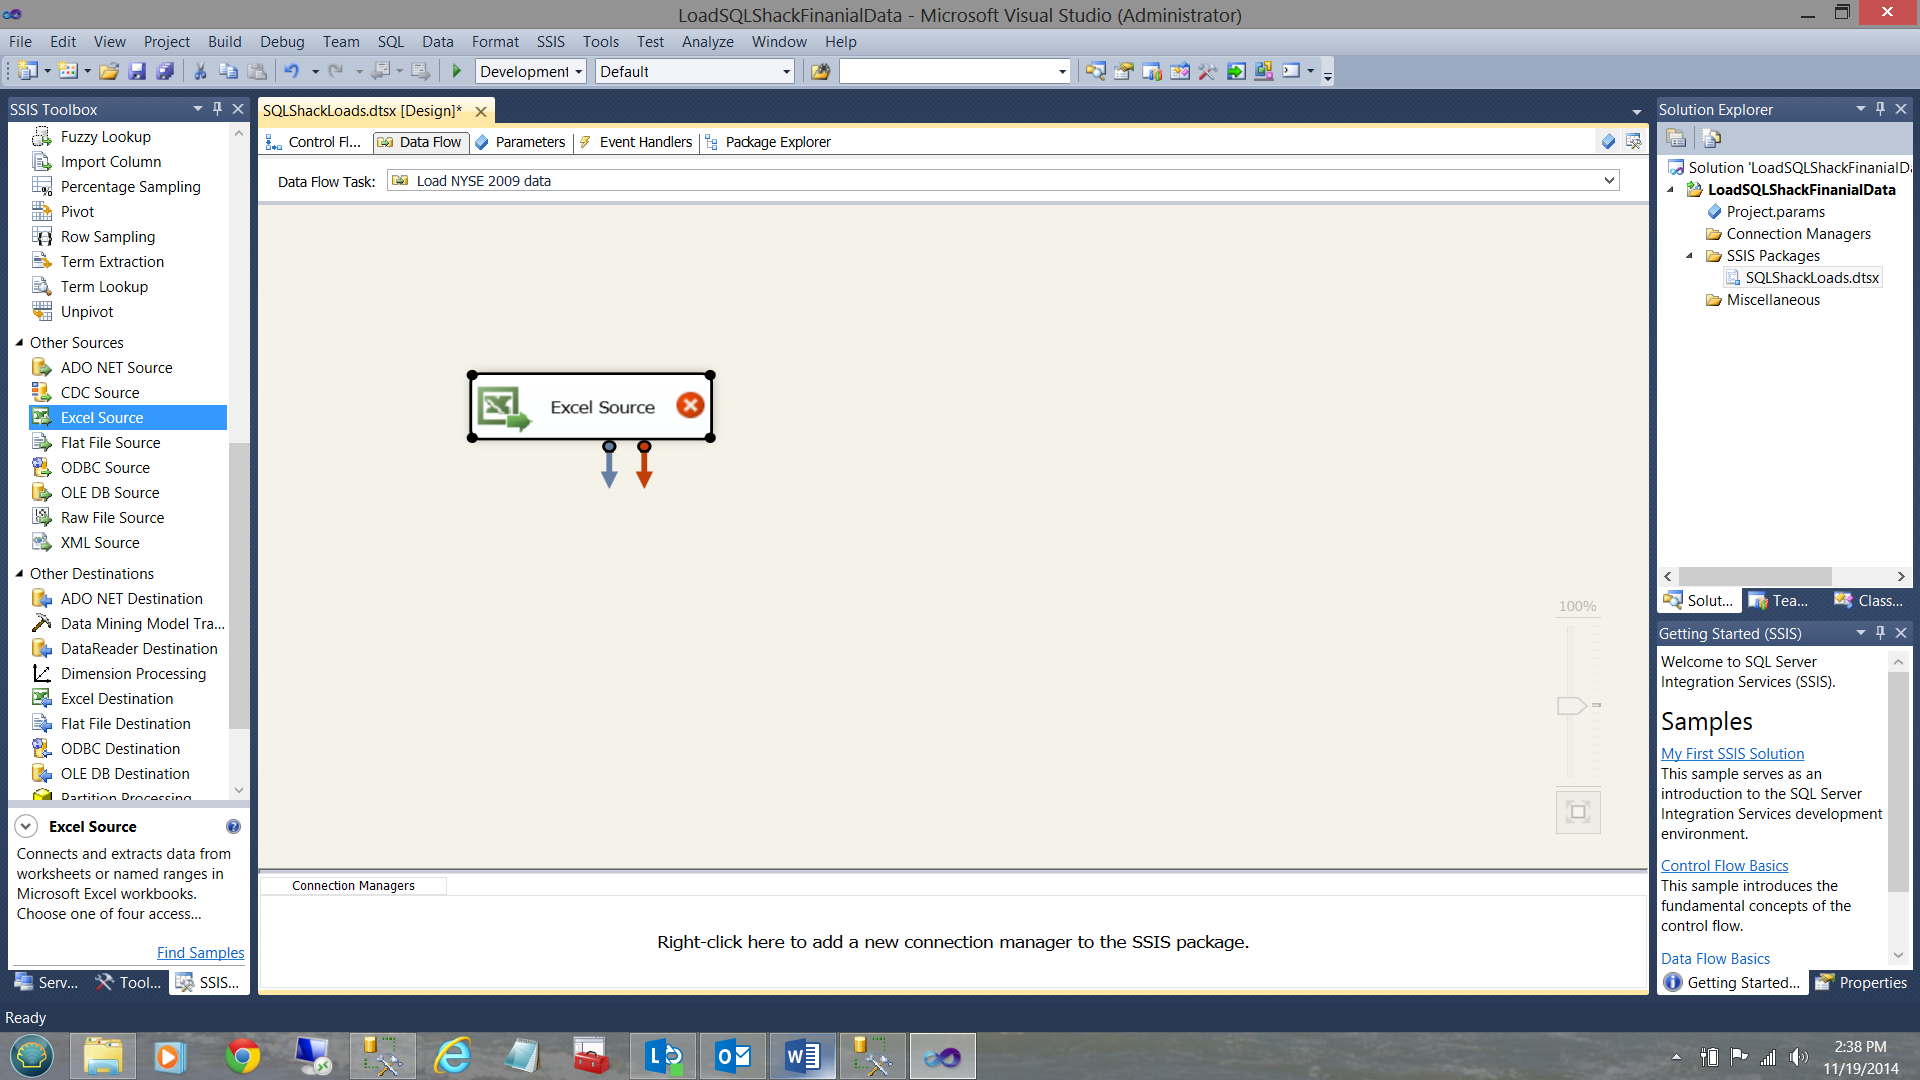
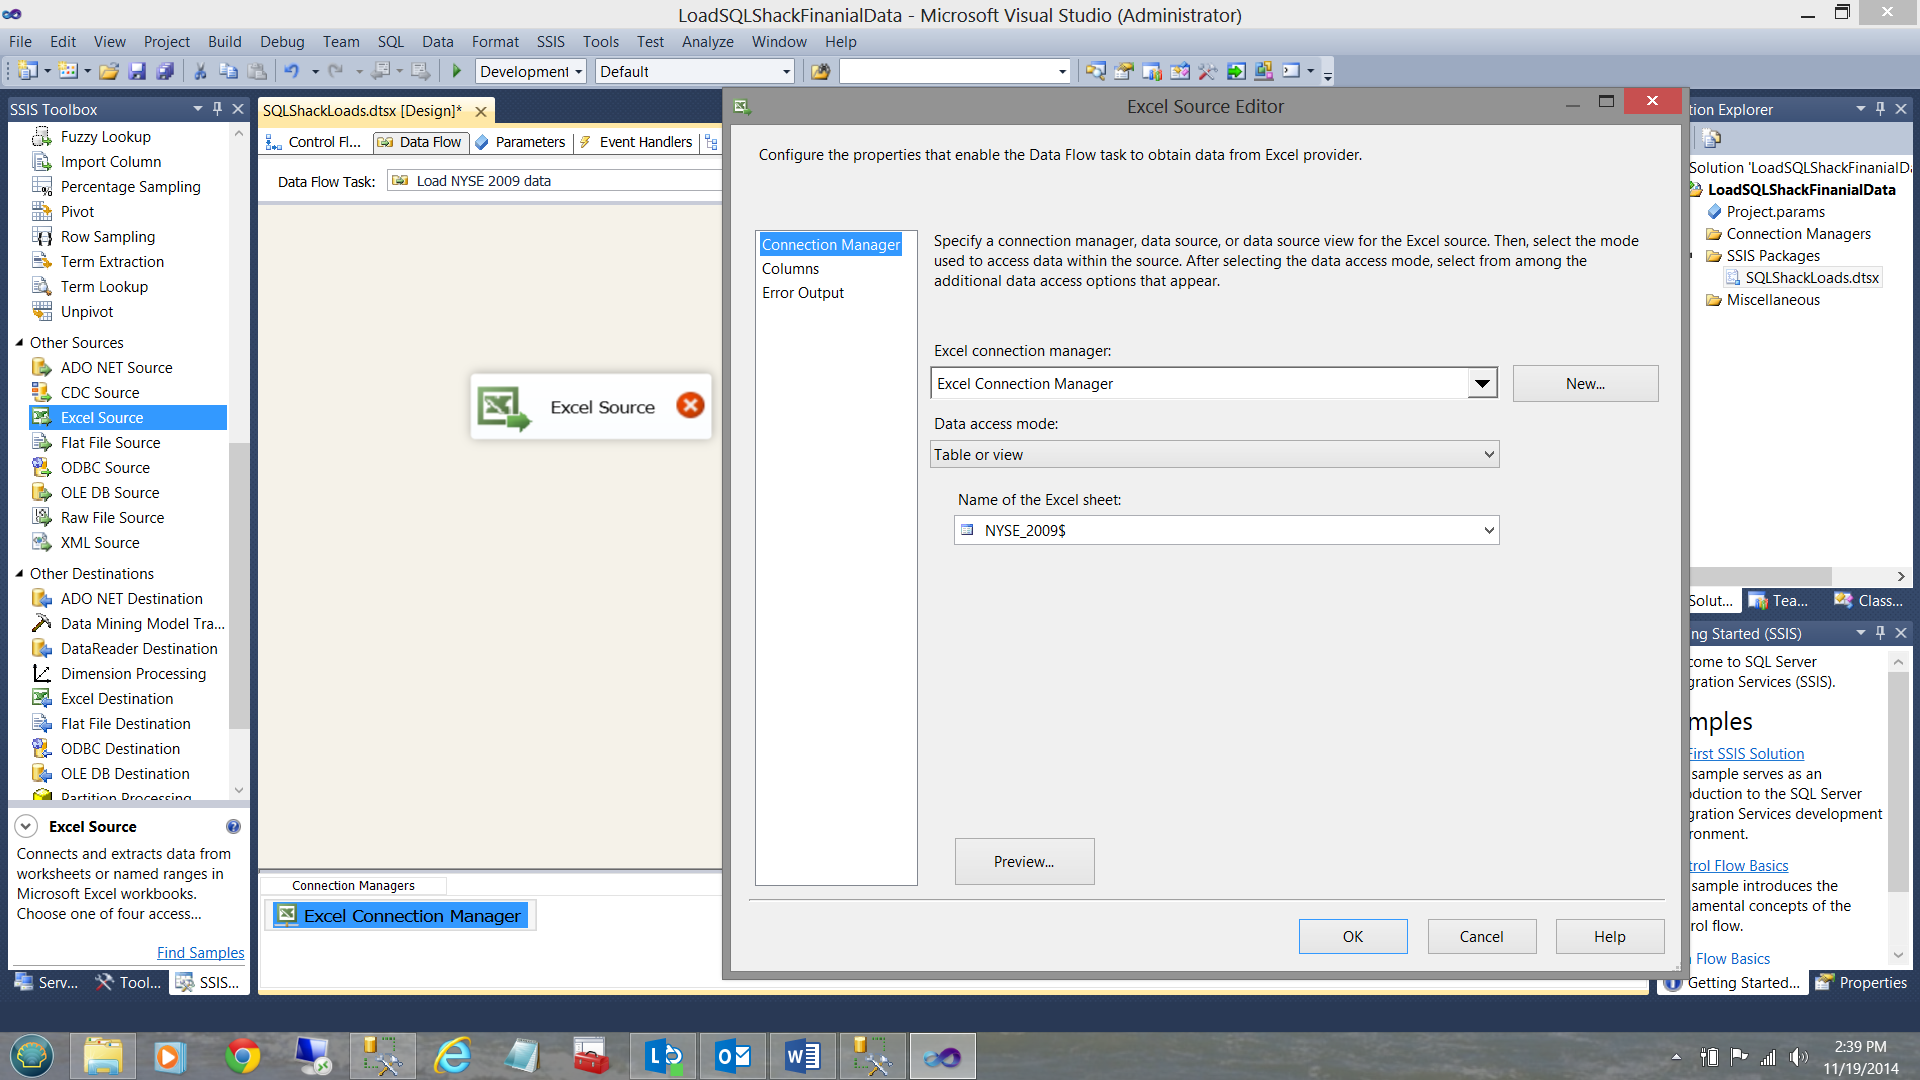
Double clicking on the data flow (see above) we are brought to the ‘Data Flow’ tab. I add an ‘Excel Data Source’ (see below)
双击数据流(见上文),我们进入“数据流”选项卡。 我添加了一个“ Excel数据源”(见下文)
I merely configure this data source to point to my NYSE Excel Workbook.
我仅配置此数据源以指向我的NYSE Excel Workbook。
And view my incoming data columns (see below).
并查看我的传入数据列(请参见下文)。
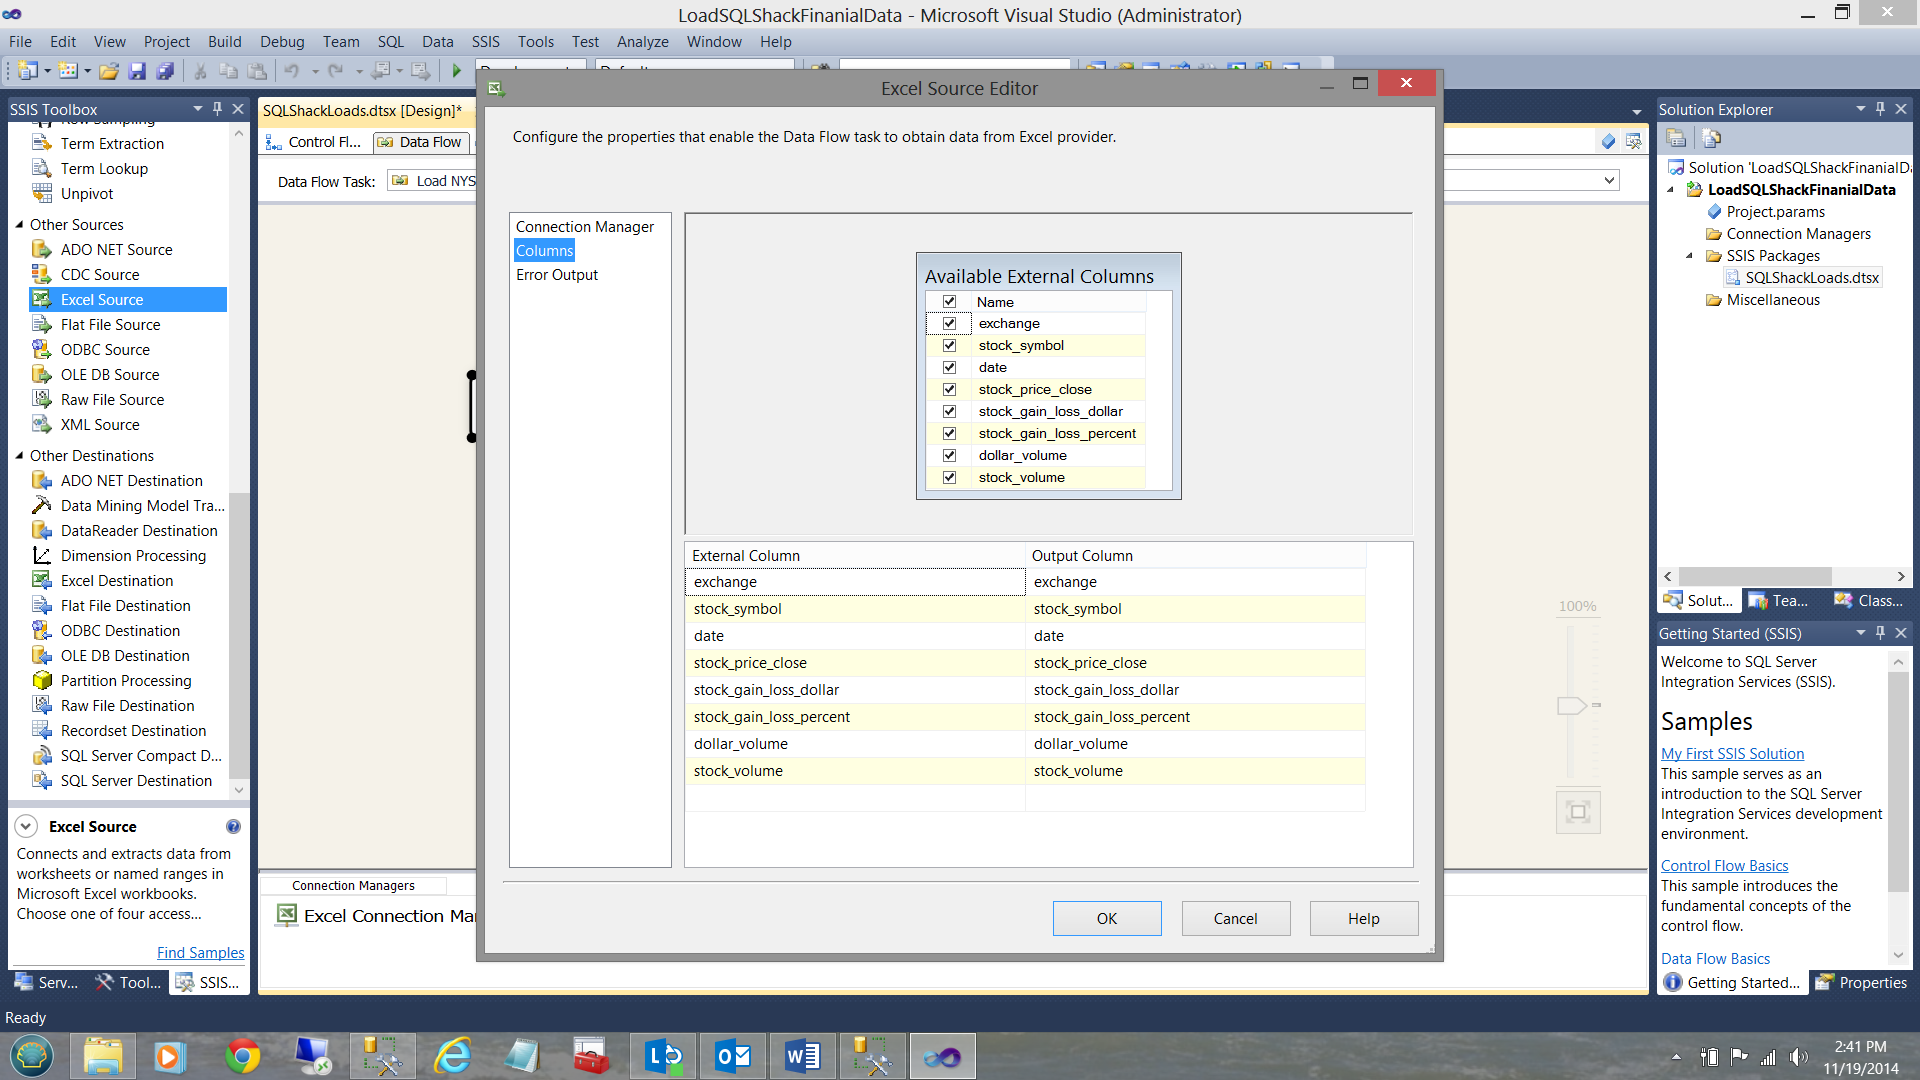
I now click OK to leave the ‘Excel Source’ configuration screen, having defined my data source.
现在,我单击“确定”以离开“ Excel Source”配置屏幕,并定义了我的数据源。
Our next step is to create a data connection to our SQL Server database so that the data from the Excel data source may be placed in a table within the database. I right click within the Connection Managers box and create a new OLE DB connection (see below).
下一步是创建与SQL Server数据库的数据连接,以便可以将来自Excel数据源的数据放在数据库中的表中。 我在“连接管理器”框中右键单击并创建一个新的OLE DB连接(请参见下文)。
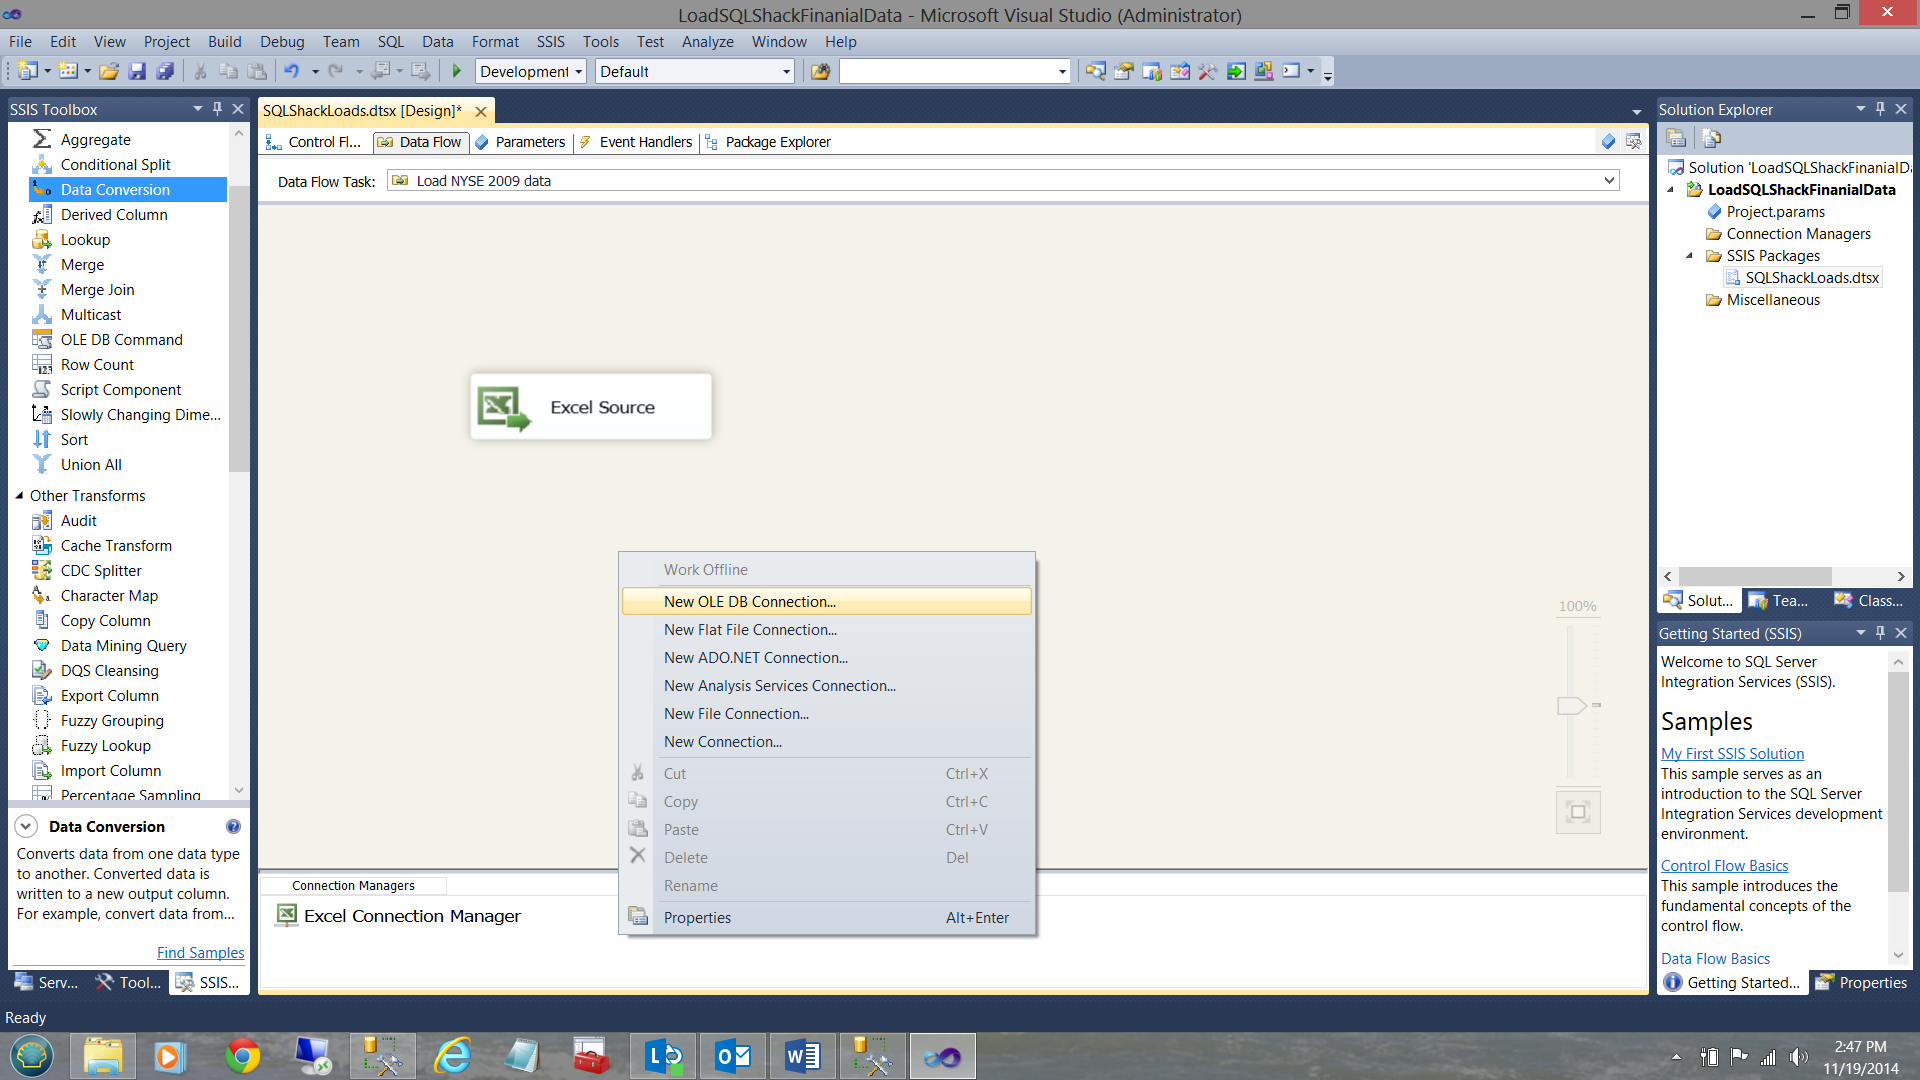
We must now configure this connection (see below).
现在,我们必须配置此连接(请参见下文)。
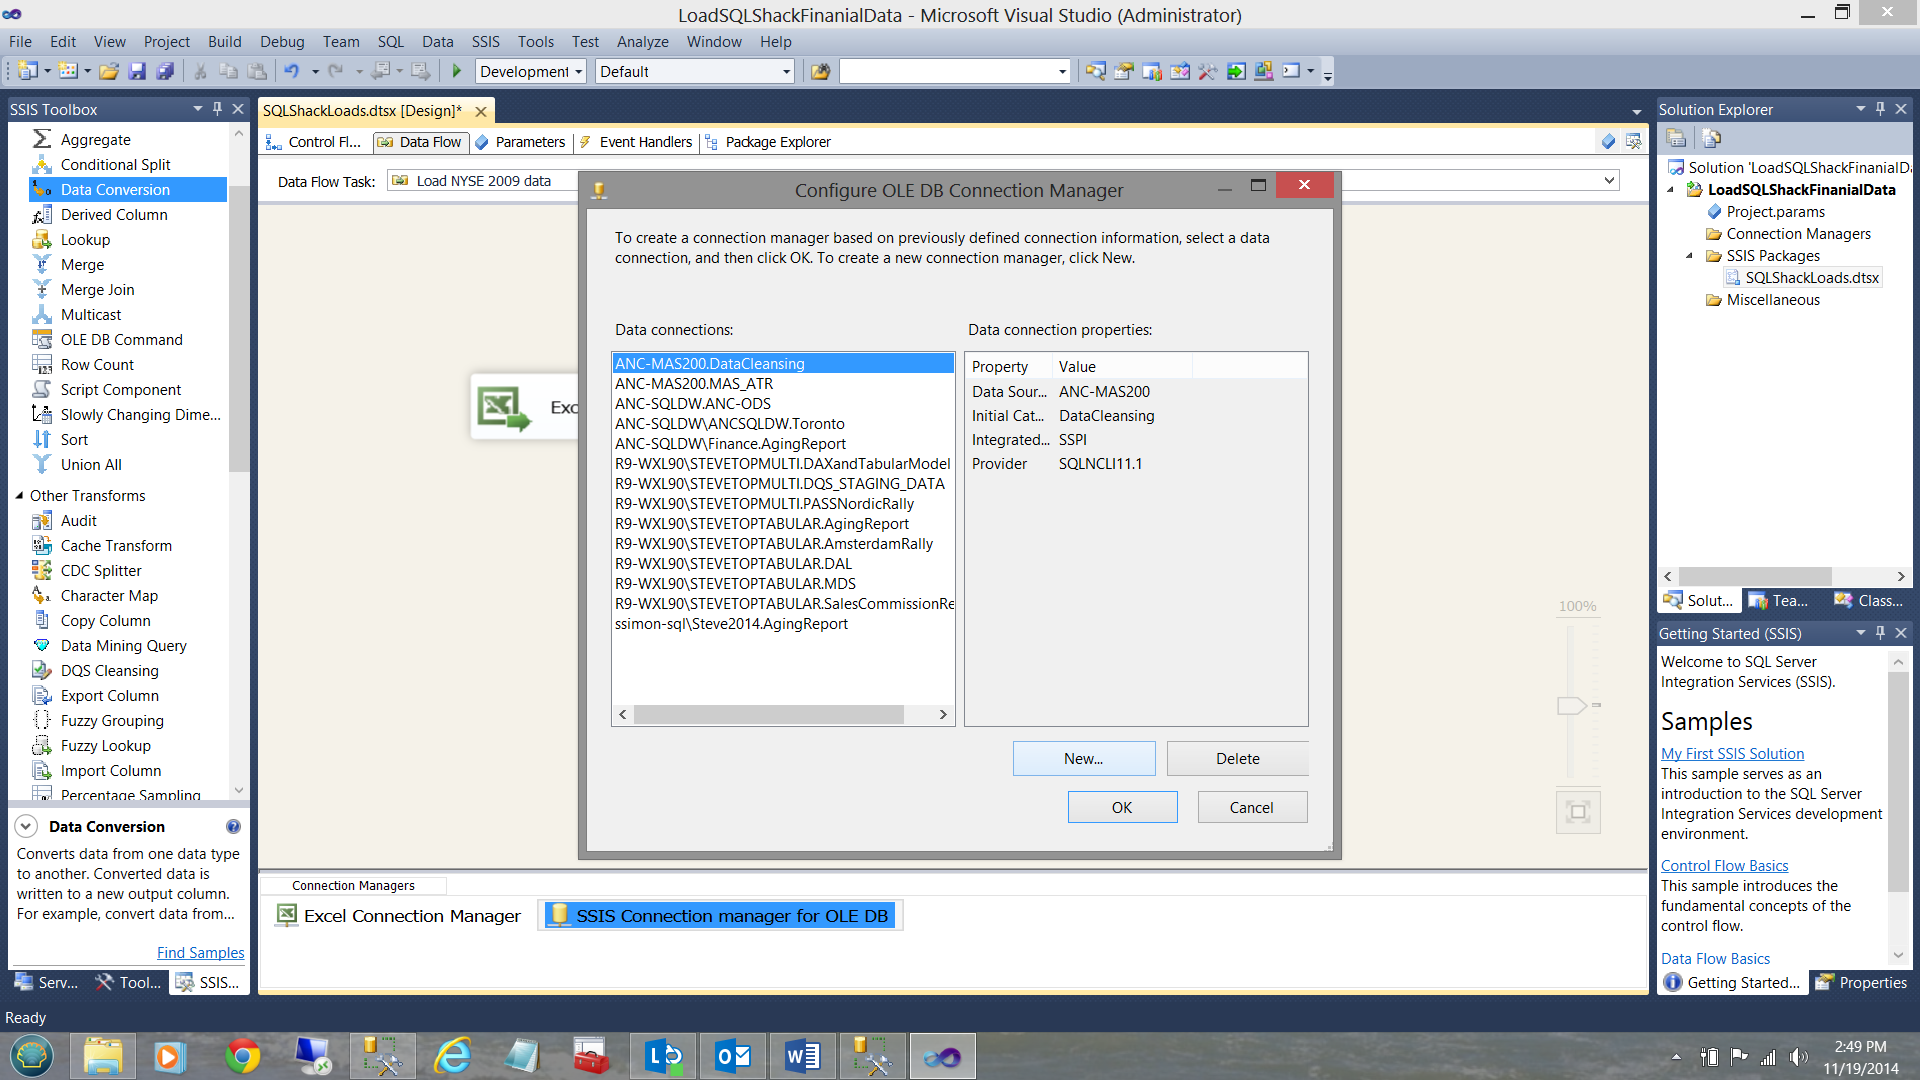
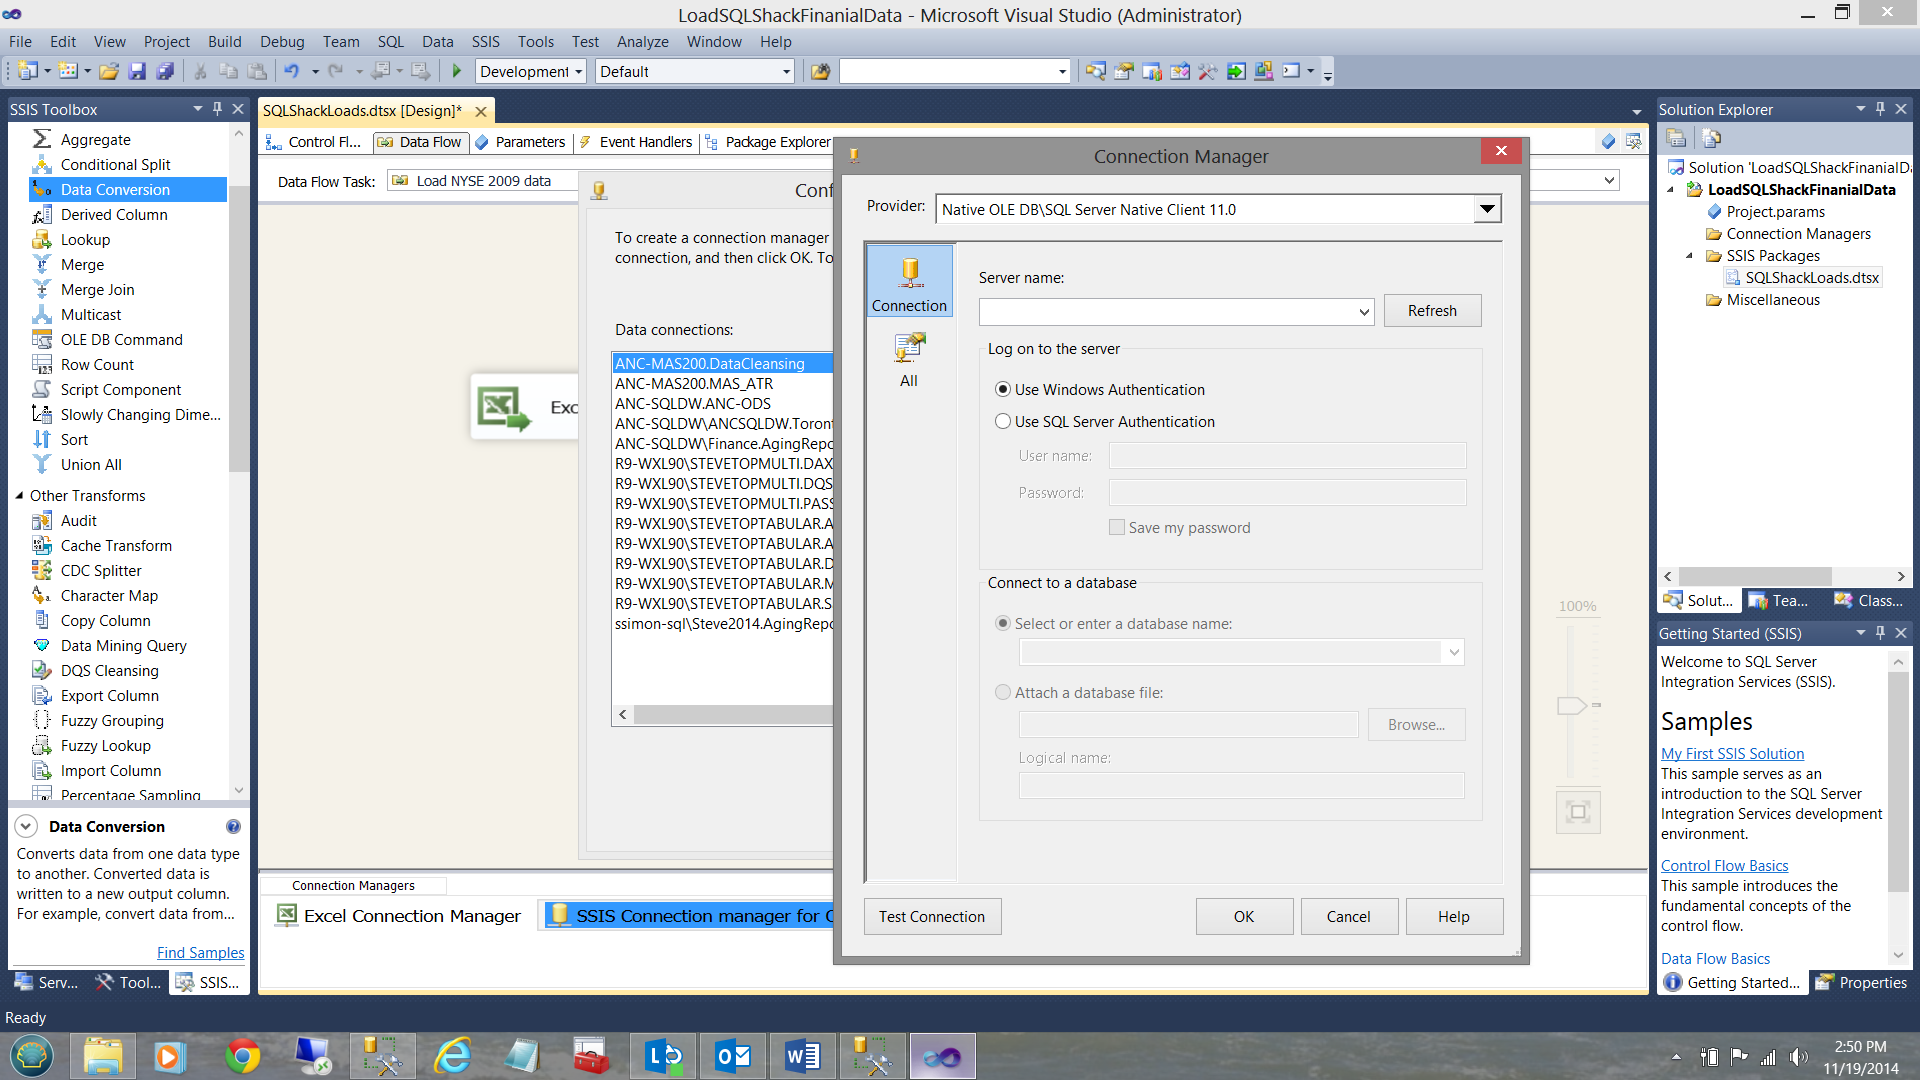
As this is the first time attempting to access the SQLShackFinancial database, we create a ‘new connection’. I click on the ‘New’ button shown above. The connection manager data collection screen is brought into view.
由于这是第一次尝试访问SQLShackFinancial数据库,因此我们创建了一个“新连接”。 我点击上面显示的“新建”按钮。 进入连接管理器数据收集屏幕。
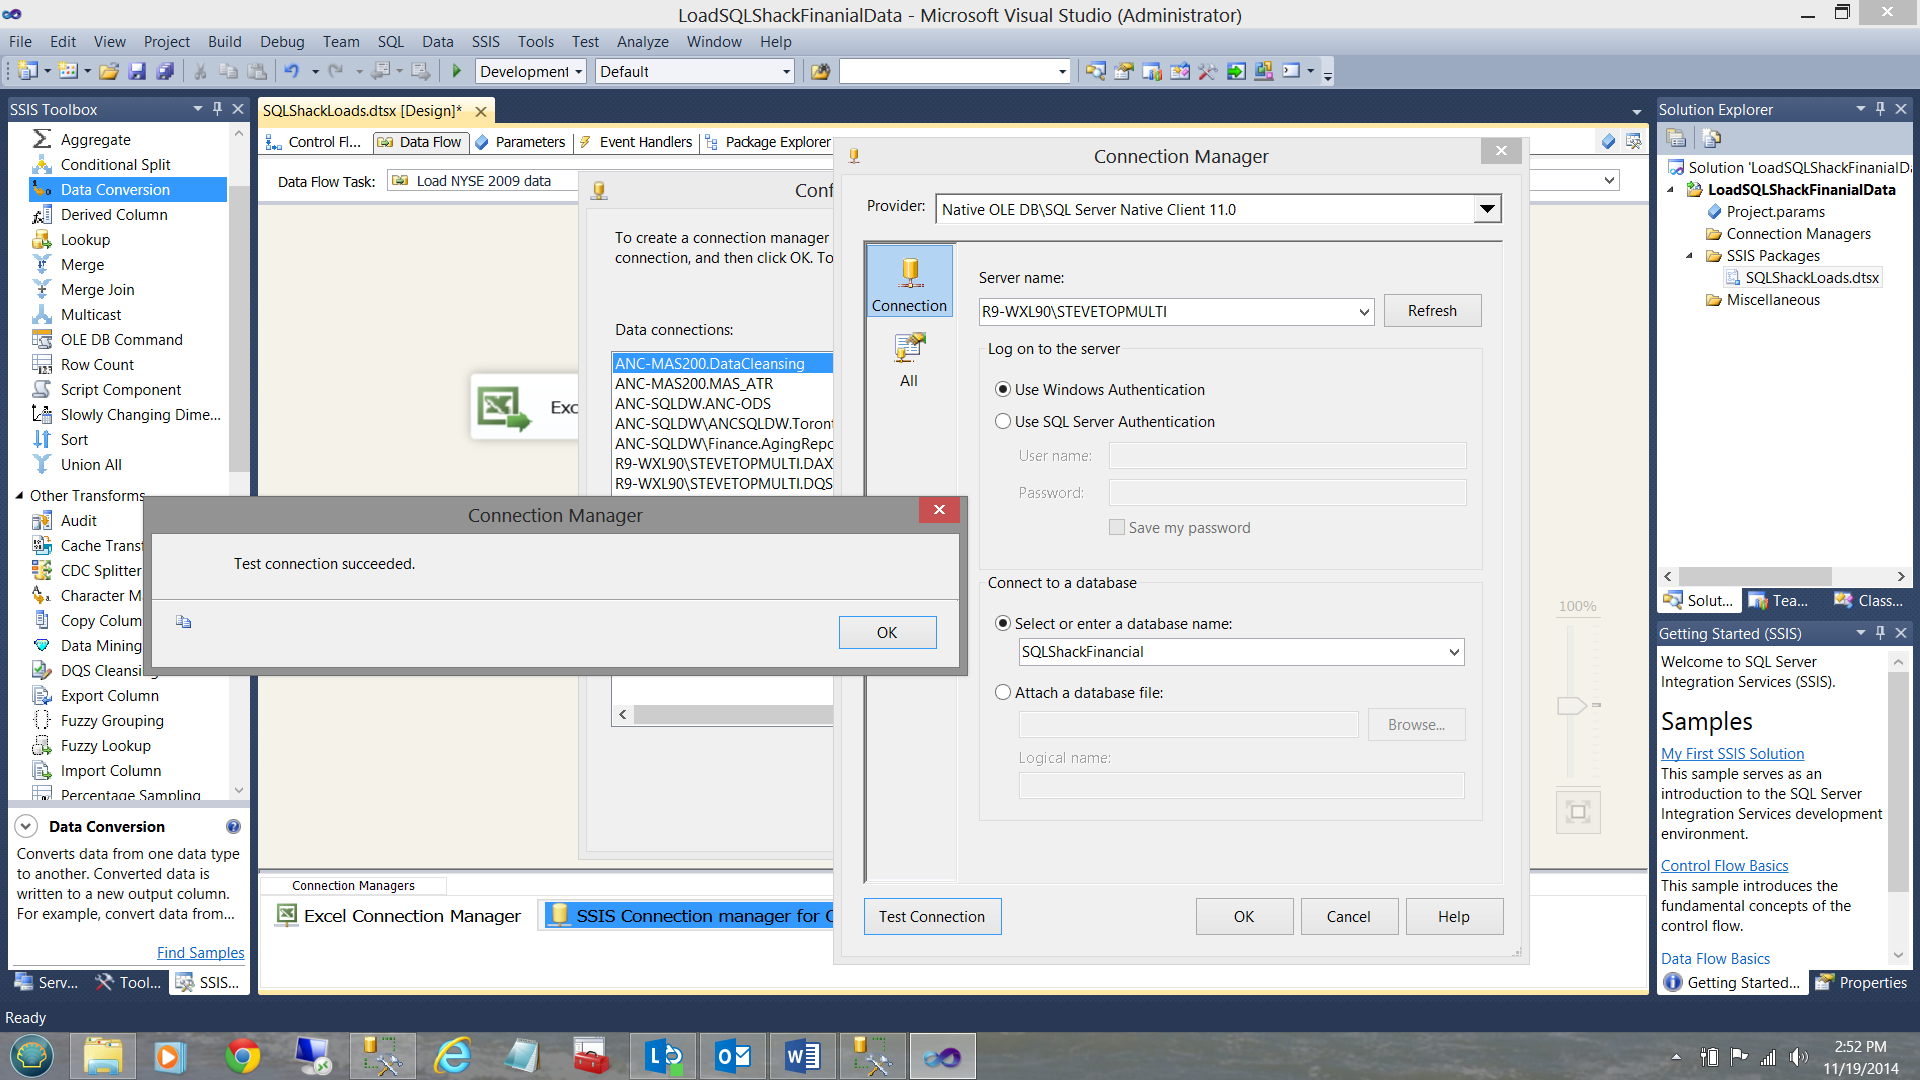
I merely complete the ‘Server name’ box, tell SSIS which database I wish to connect to, and test the connection. The completed data entry screen is shown below.
我仅完成“服务器名称”框,告诉SSIS我希望连接到哪个数据库,并测试连接。 完成的数据输入屏幕如下所示。
Finally, I click OK, OK and OK again to return to my ‘Data Flow’ screen.
最后,单击确定,再次单击确定,然后返回到“数据流”屏幕。
We do have one issue with this data: the date field within the spreadsheet is a ‘text’ field (see below).
我们确实对此数据存在一个问题:电子表格中的日期字段是一个“文本”字段(请参见下文)。
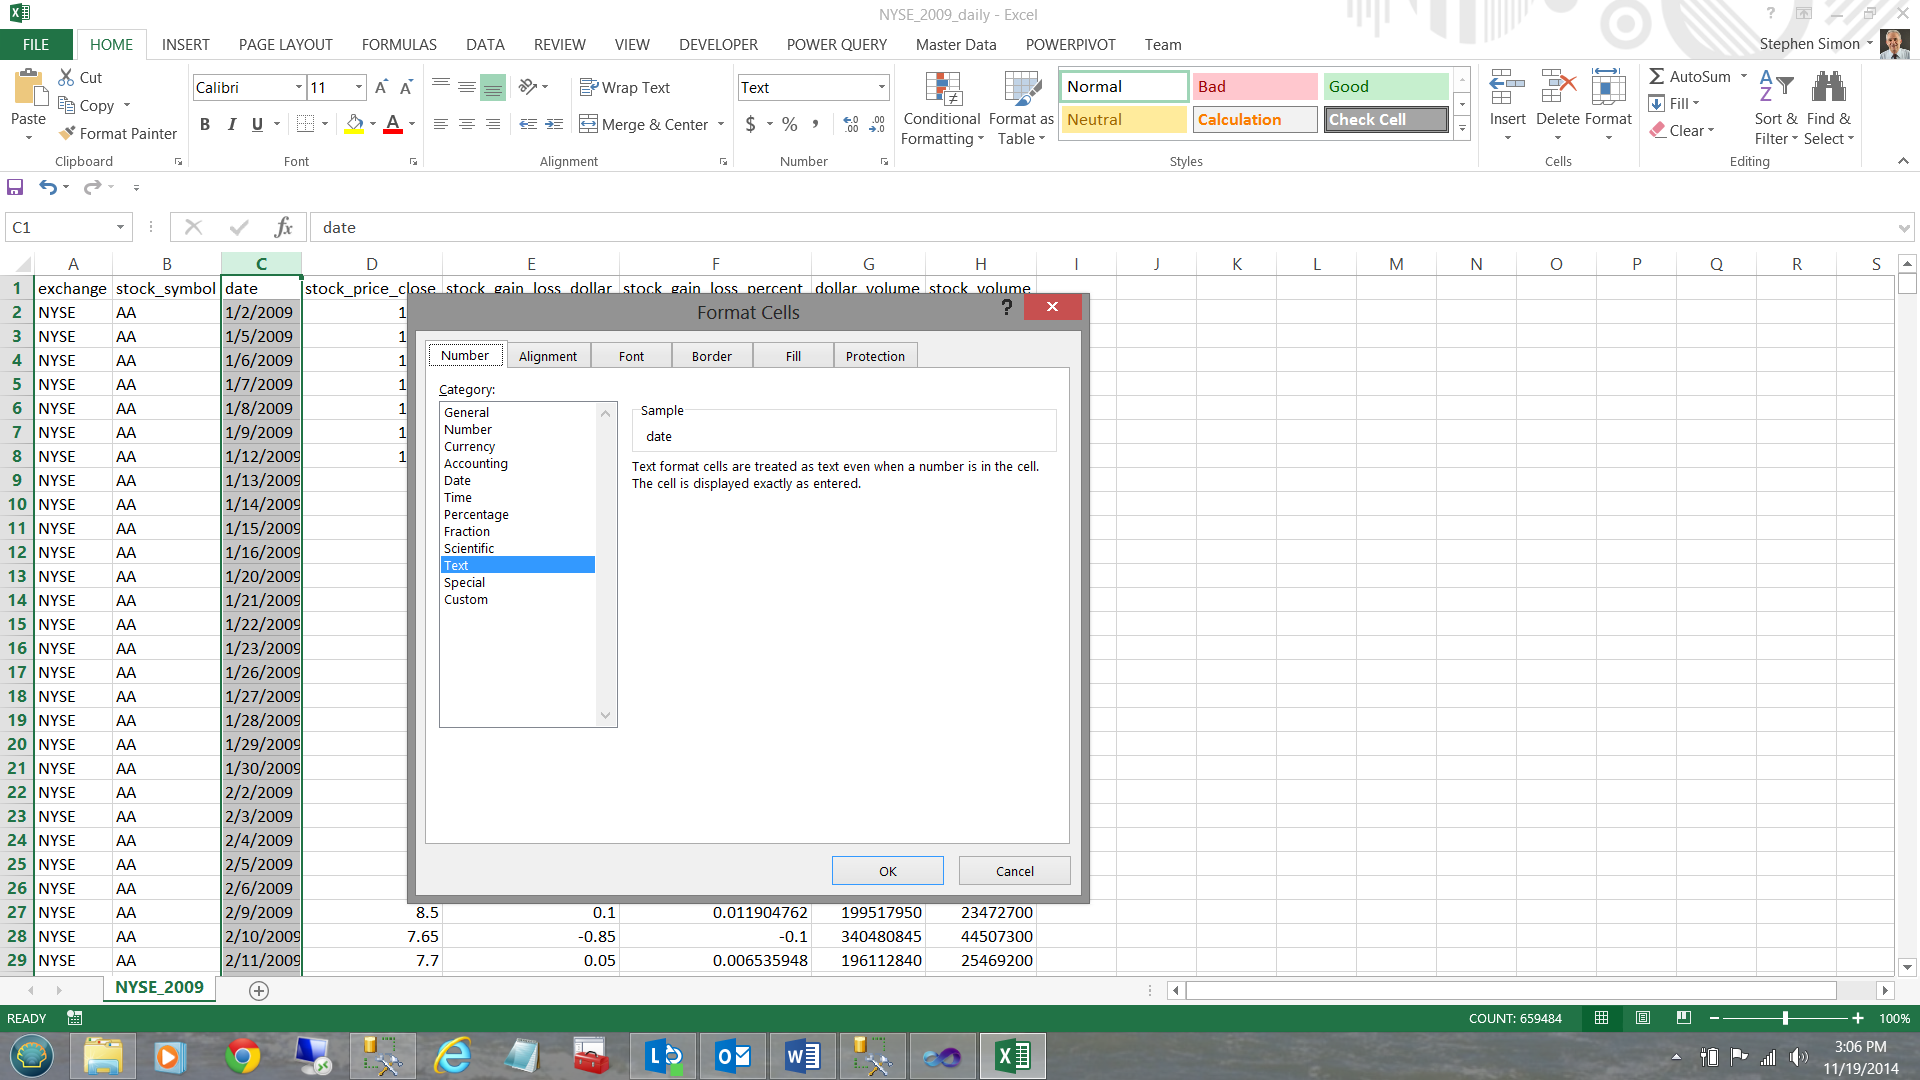
This is not really optimal as I know that I shall be doing date related queries. Therefore upon loading the data into our database table I shall convert it to a date, prior to actually inserting it into the table. To achieve this, I add a ‘data conversion’ control onto the design surface (see below).
这并不是真正的最佳选择,因为我知道我将进行与日期相关的查询。 因此,在将数据加载到数据库表中之后,我将其转换为日期,然后才将其实际插入表中。 为此,我在设计图面上添加了“数据转换”控件(请参见下文)。
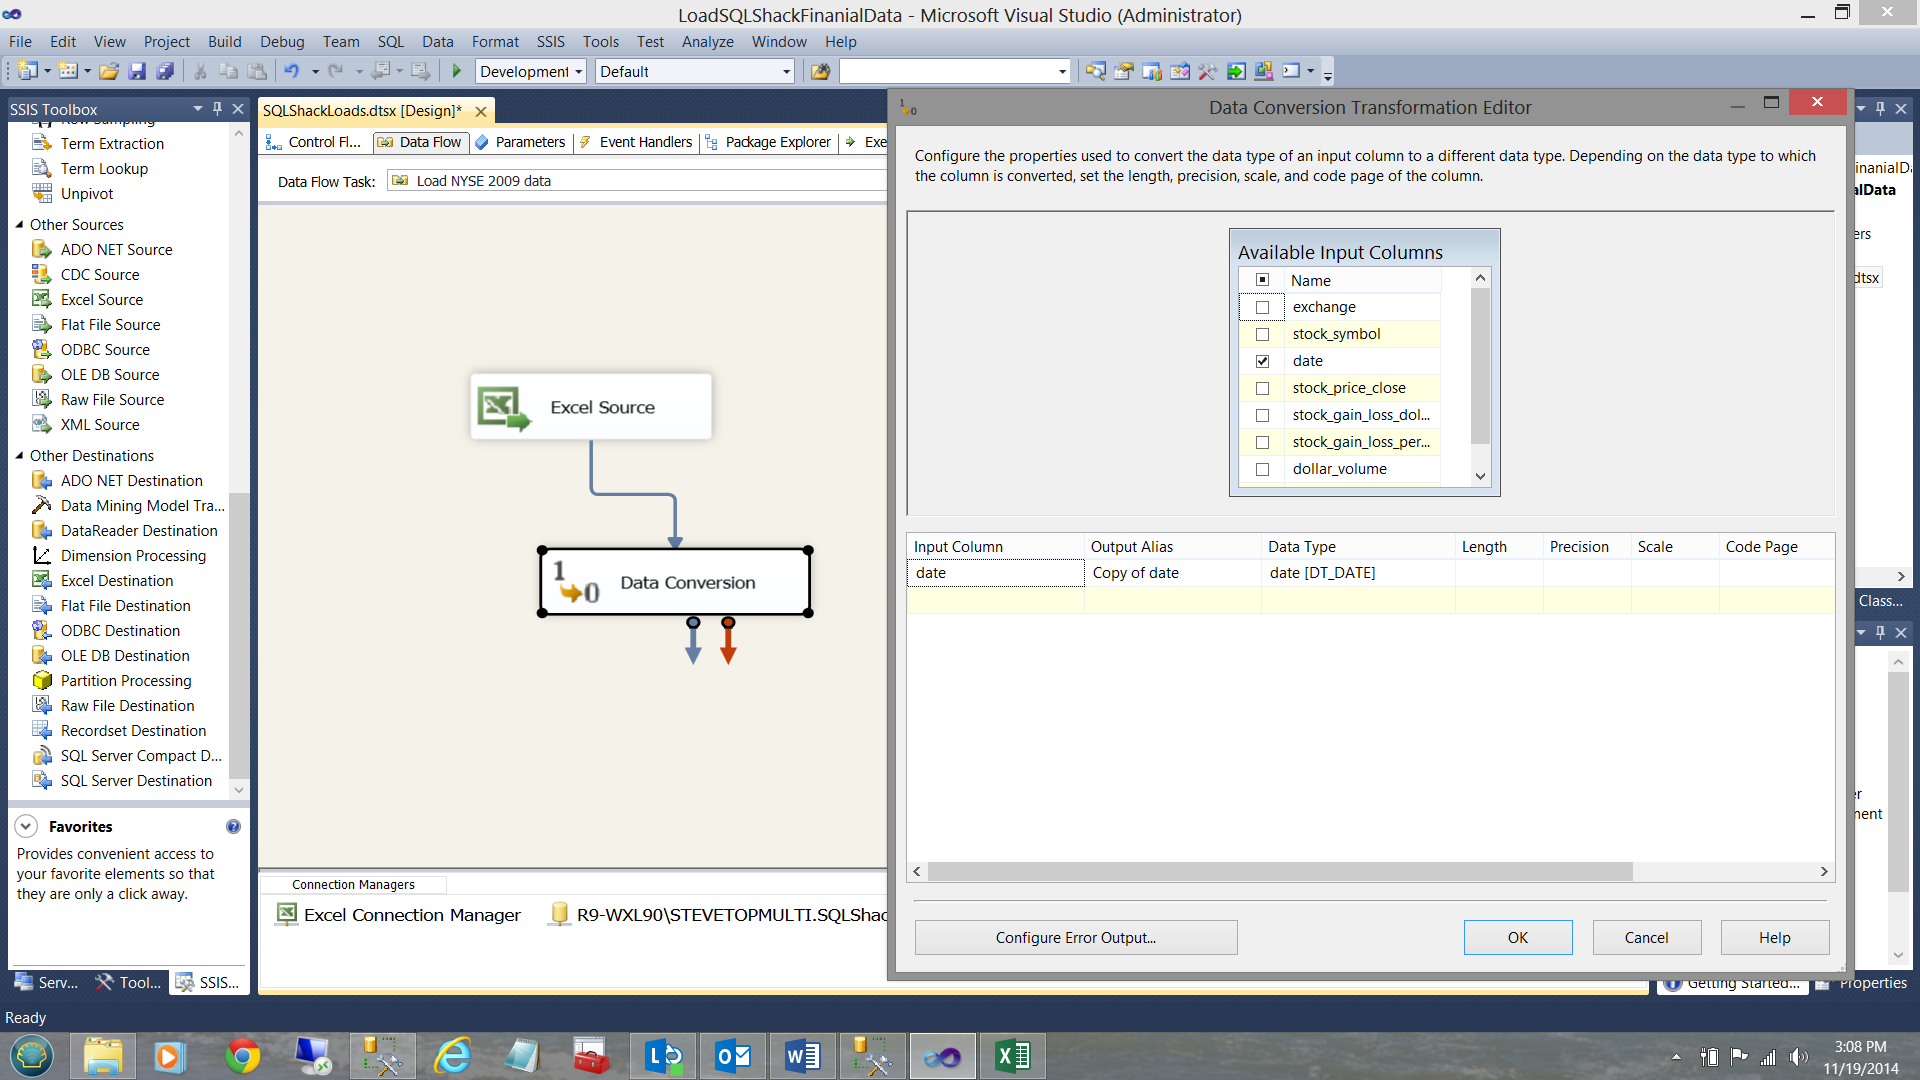
Opening the control, I check the ‘date’ input column and change the data type of the output to ‘DT_DATE’ and click OK. Our final step in the process is to add an OLE DB destination control which will connect the data flow to our final data repository table (see below).
打开控件,我检查“日期”输入列,并将输出的数据类型更改为“ DT_DATE”,然后单击“确定”。 在此过程中,我们的最后一步是添加一个OLE DB目标控件,它将数据流连接到我们的最终数据存储库表(请参见下文)。
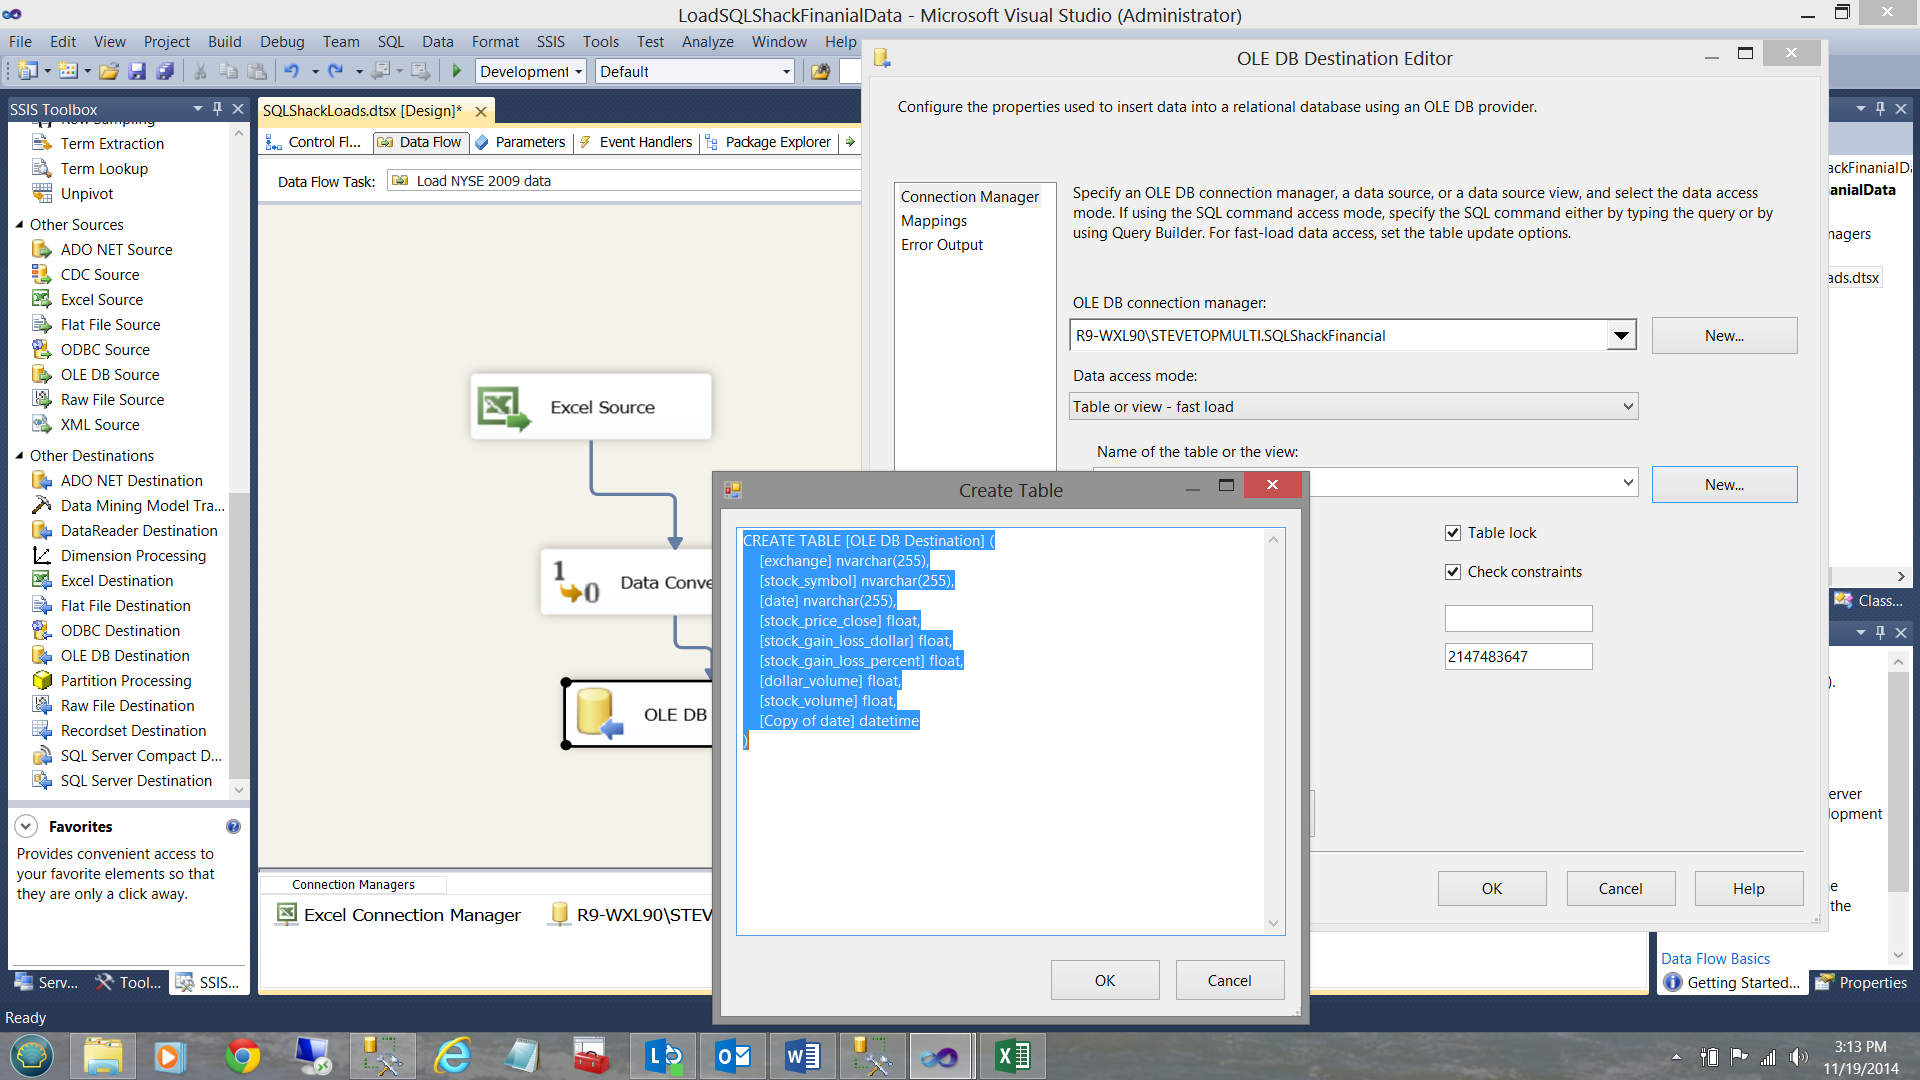
By double clicking the ‘OLE DB Destination’ that we just brought onto our surface, the OLE DB Destination Editor is brought up. I point it to the SQLShackFinancial connection that I created above and I click the ‘New’ button for the ‘Name of the table or the view’ option. We must remember that the table does not yet exist as this is the first time that I am loading data into the database.
通过双击刚带到表面上的“ OLE DB目标”,将启动OLE DB目标编辑器。 我将其指向上面创建SQLShackFinancial连接,然后单击“表或视图名称”选项的“新建”按钮。 我们必须记住,该表尚不存在,因为这是我第一次将数据加载到数据库中。
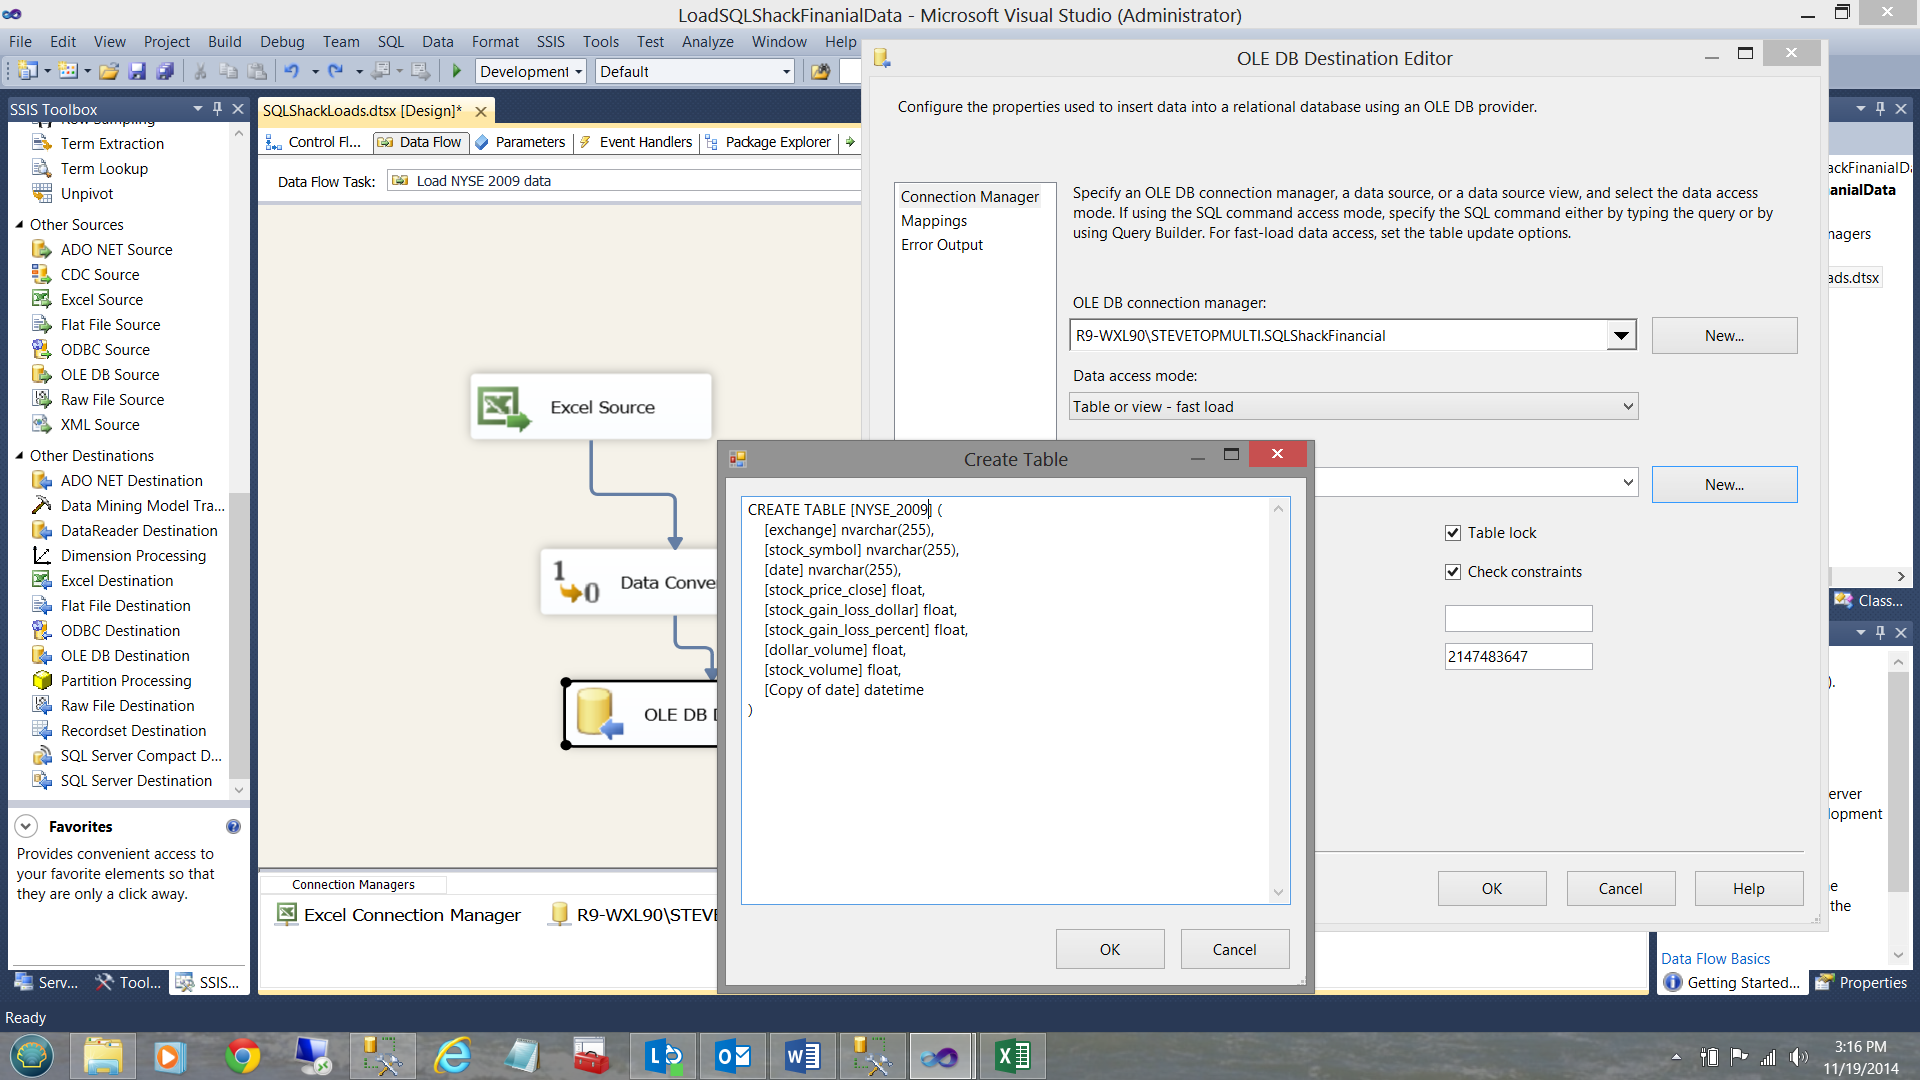
I name the table NYSE_2009 and click OK (see below).
我将表命名为NYSE_2009,然后单击“确定”(见下文)。
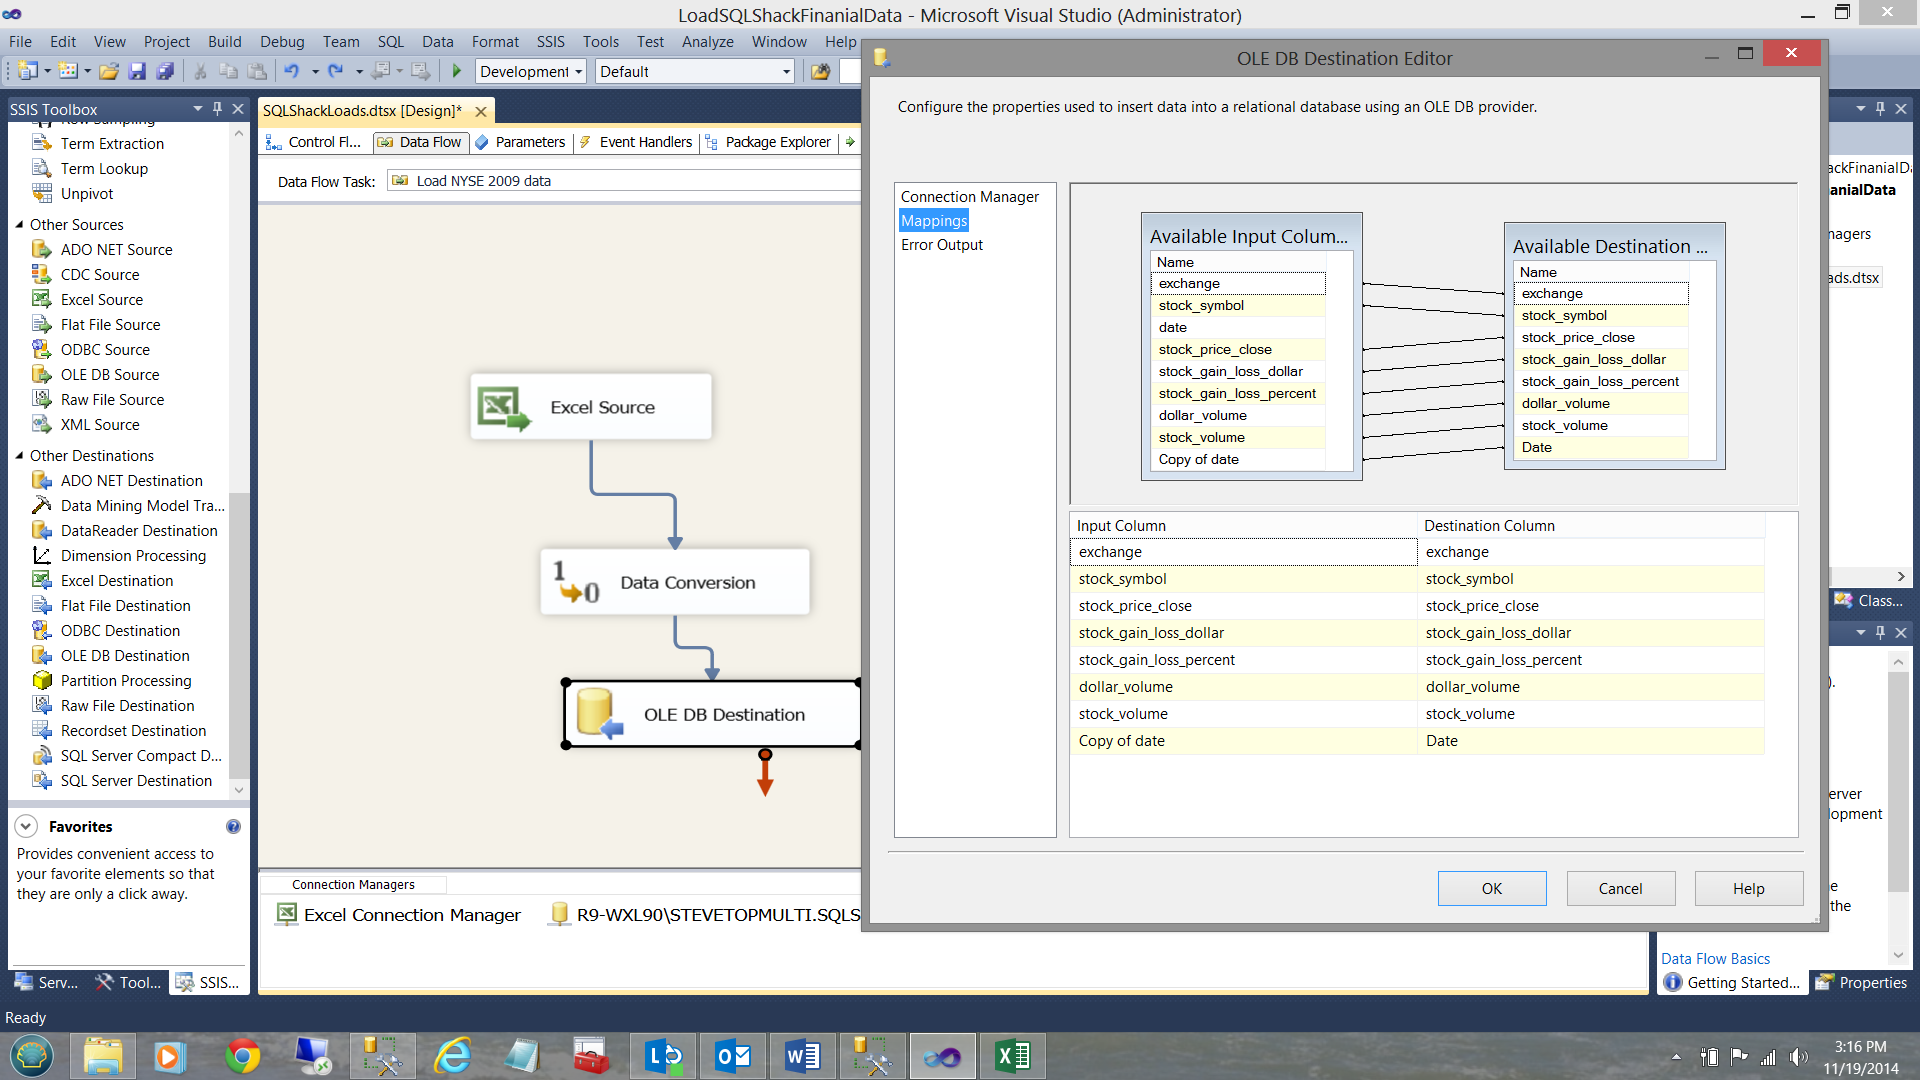
Clicking the ‘Mappings Table’, I am now able to link the incoming fields with the final fields within the database.
单击“映射表”,现在可以将输入字段与数据库中的最终字段进行链接。
We are now in a position to load the table.
现在,我们可以加载表格了。
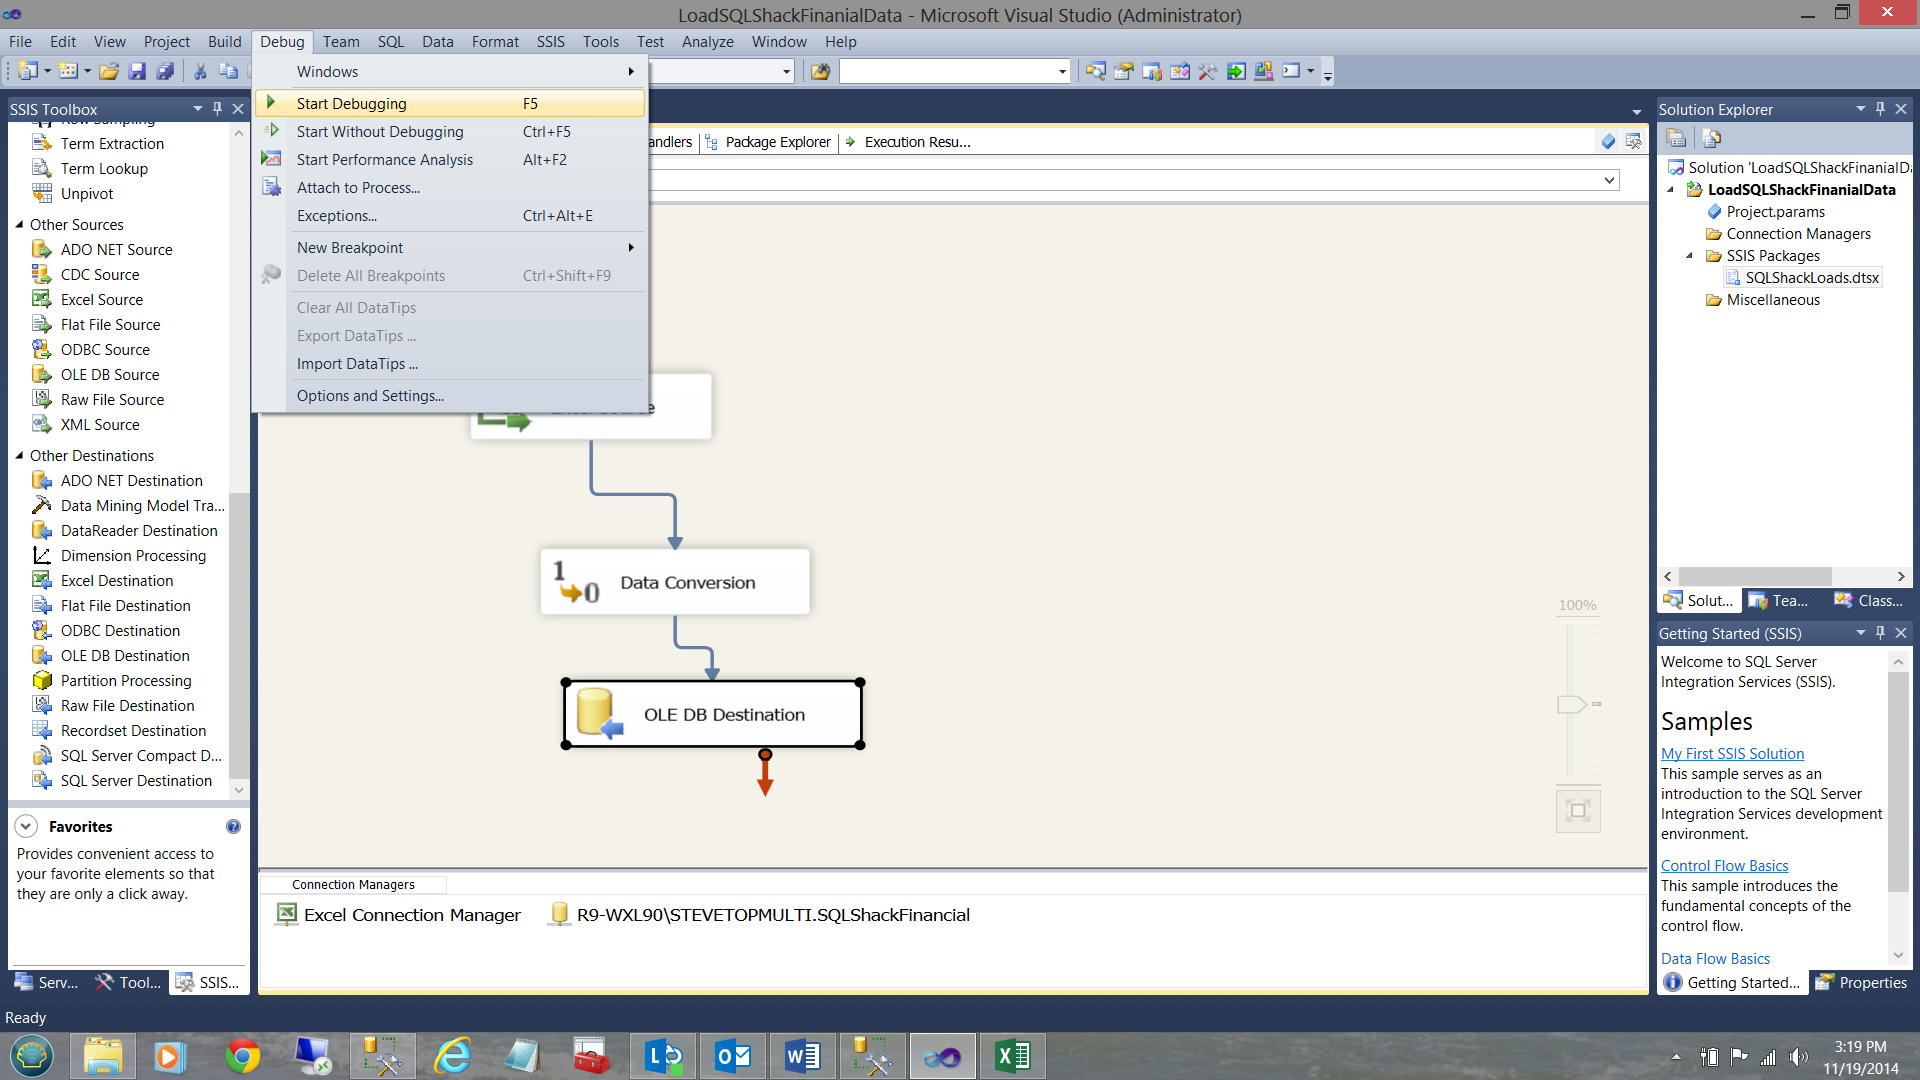
As a one off, I shall execute the load manually (as setting up the load to run as a batch job is outside the scope of this paper). I click on the ‘Debug’ table and select ‘Start Debugging’ (see above).
首先,我将手动执行加载(因为将加载设置为作为批处理作业运行不在本文讨论范围之内)。 我单击“调试”表,然后选择“开始调试”(请参见上文)。
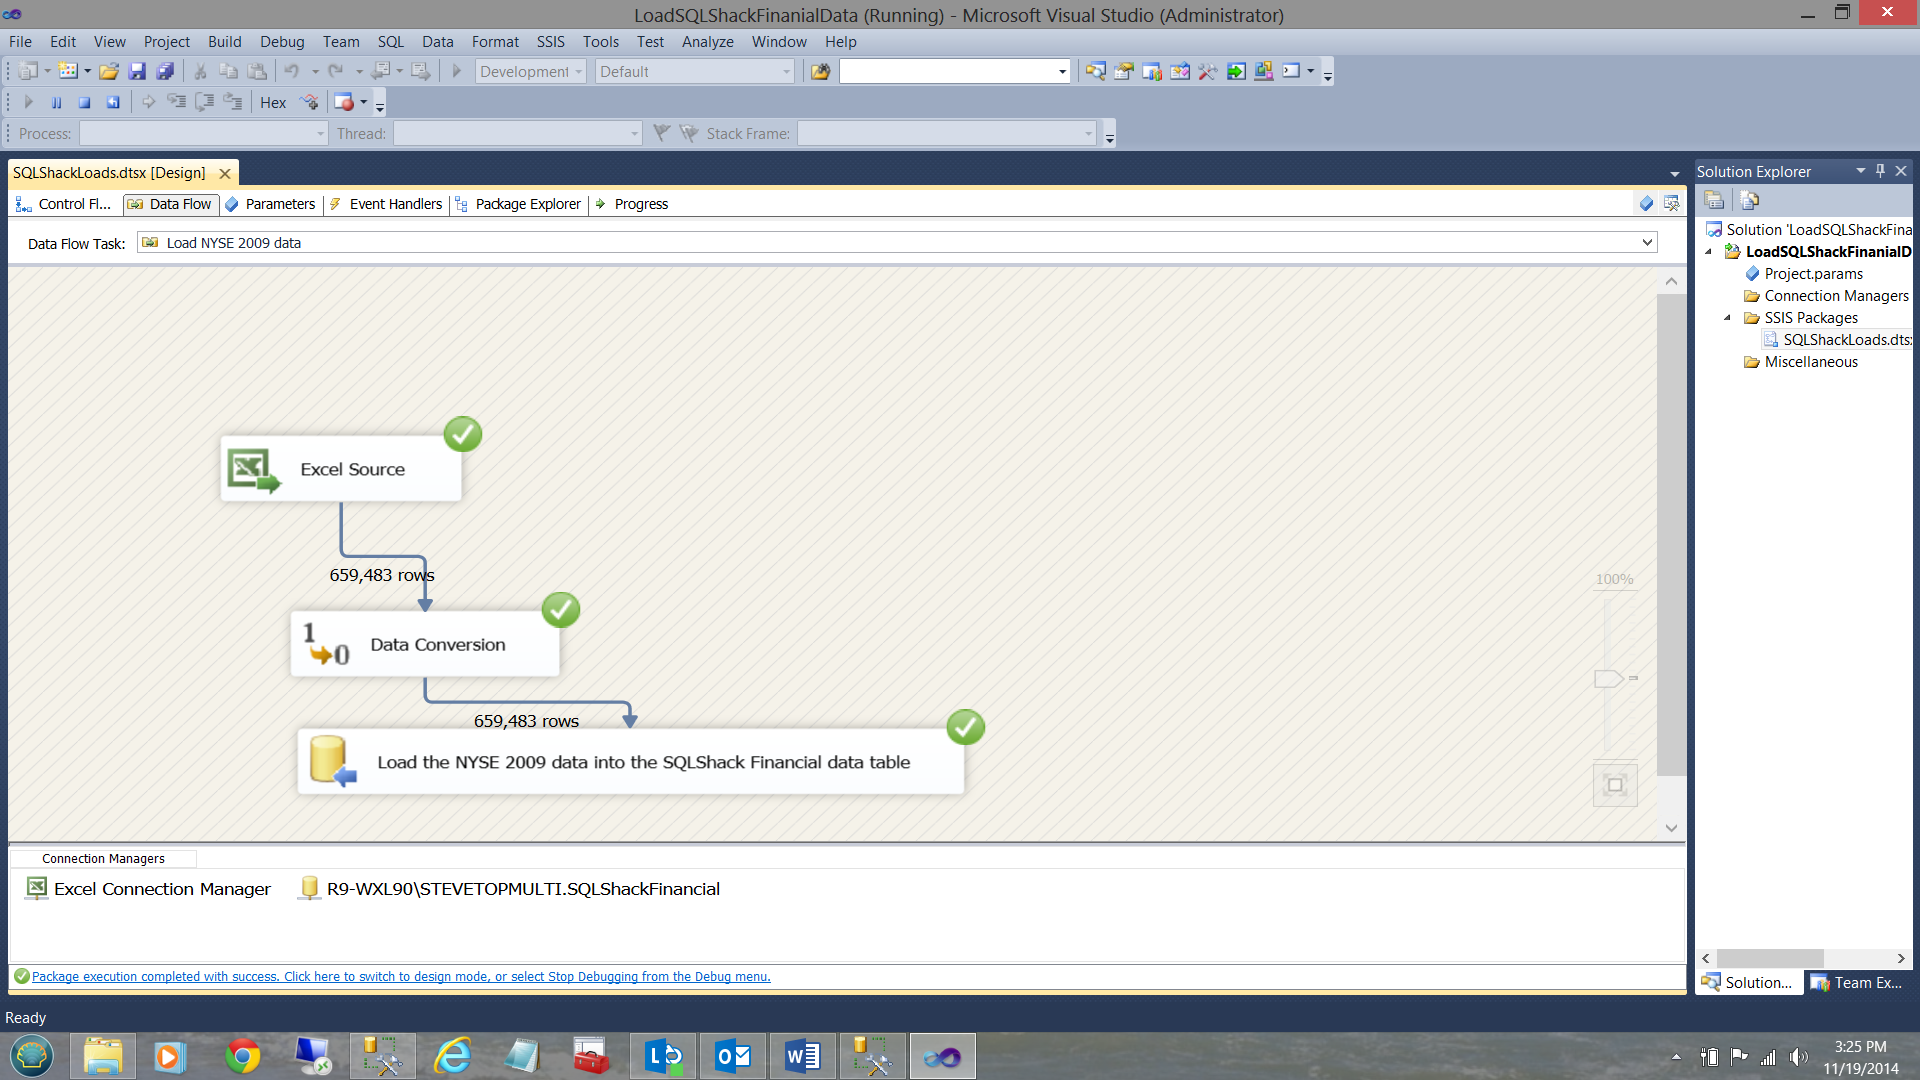
When the load is complete, the screen will appear as shown below:
加载完成后,将显示如下屏幕:
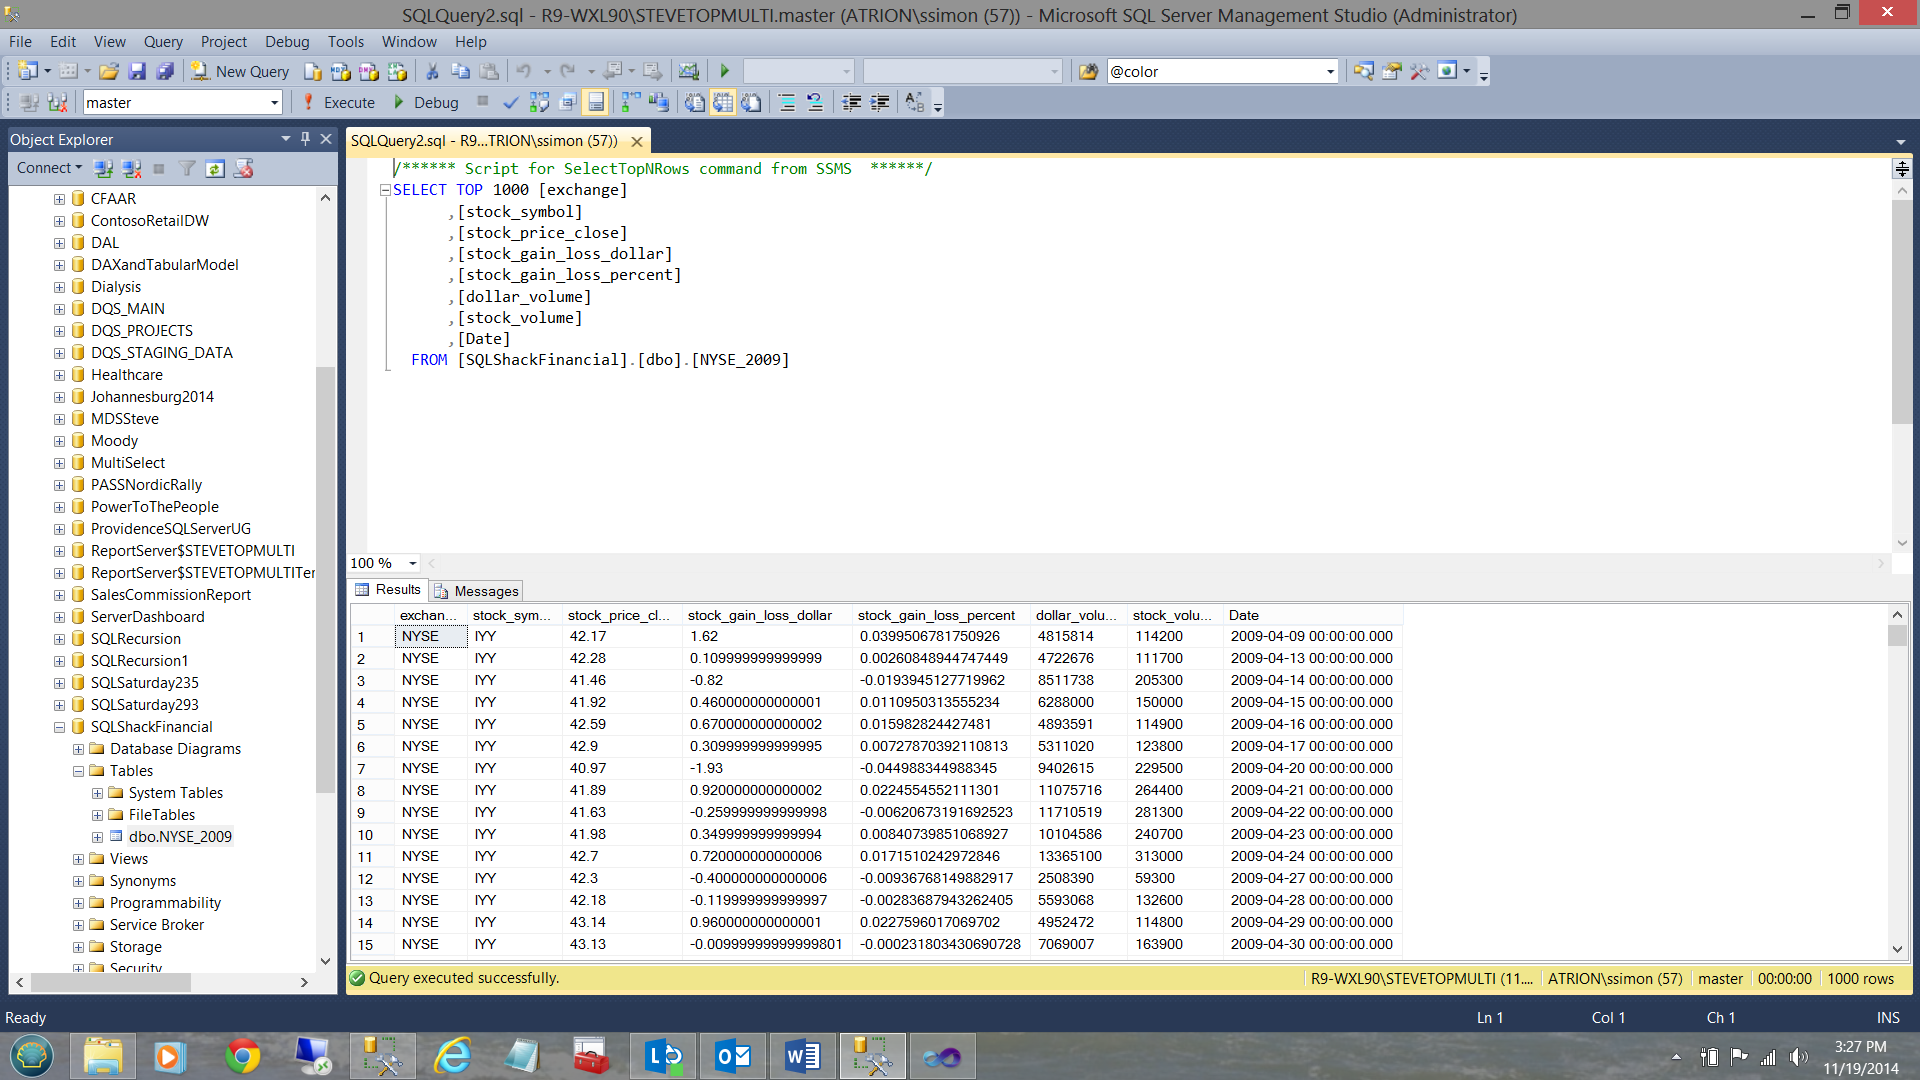
Meanwhile, back in SQL Server Management Studio, the data that we just loaded may be seen below:
同时,回到SQL Server Management Studio,我们刚刚加载的数据如下所示:
It is left up to the reader to repeat the same steps to load the NASDAQ and S&P data in a similar manner to that shown above.
留给读者的是重复上述步骤,以与上面所示类似的方式加载NASDAQ和S&P数据。
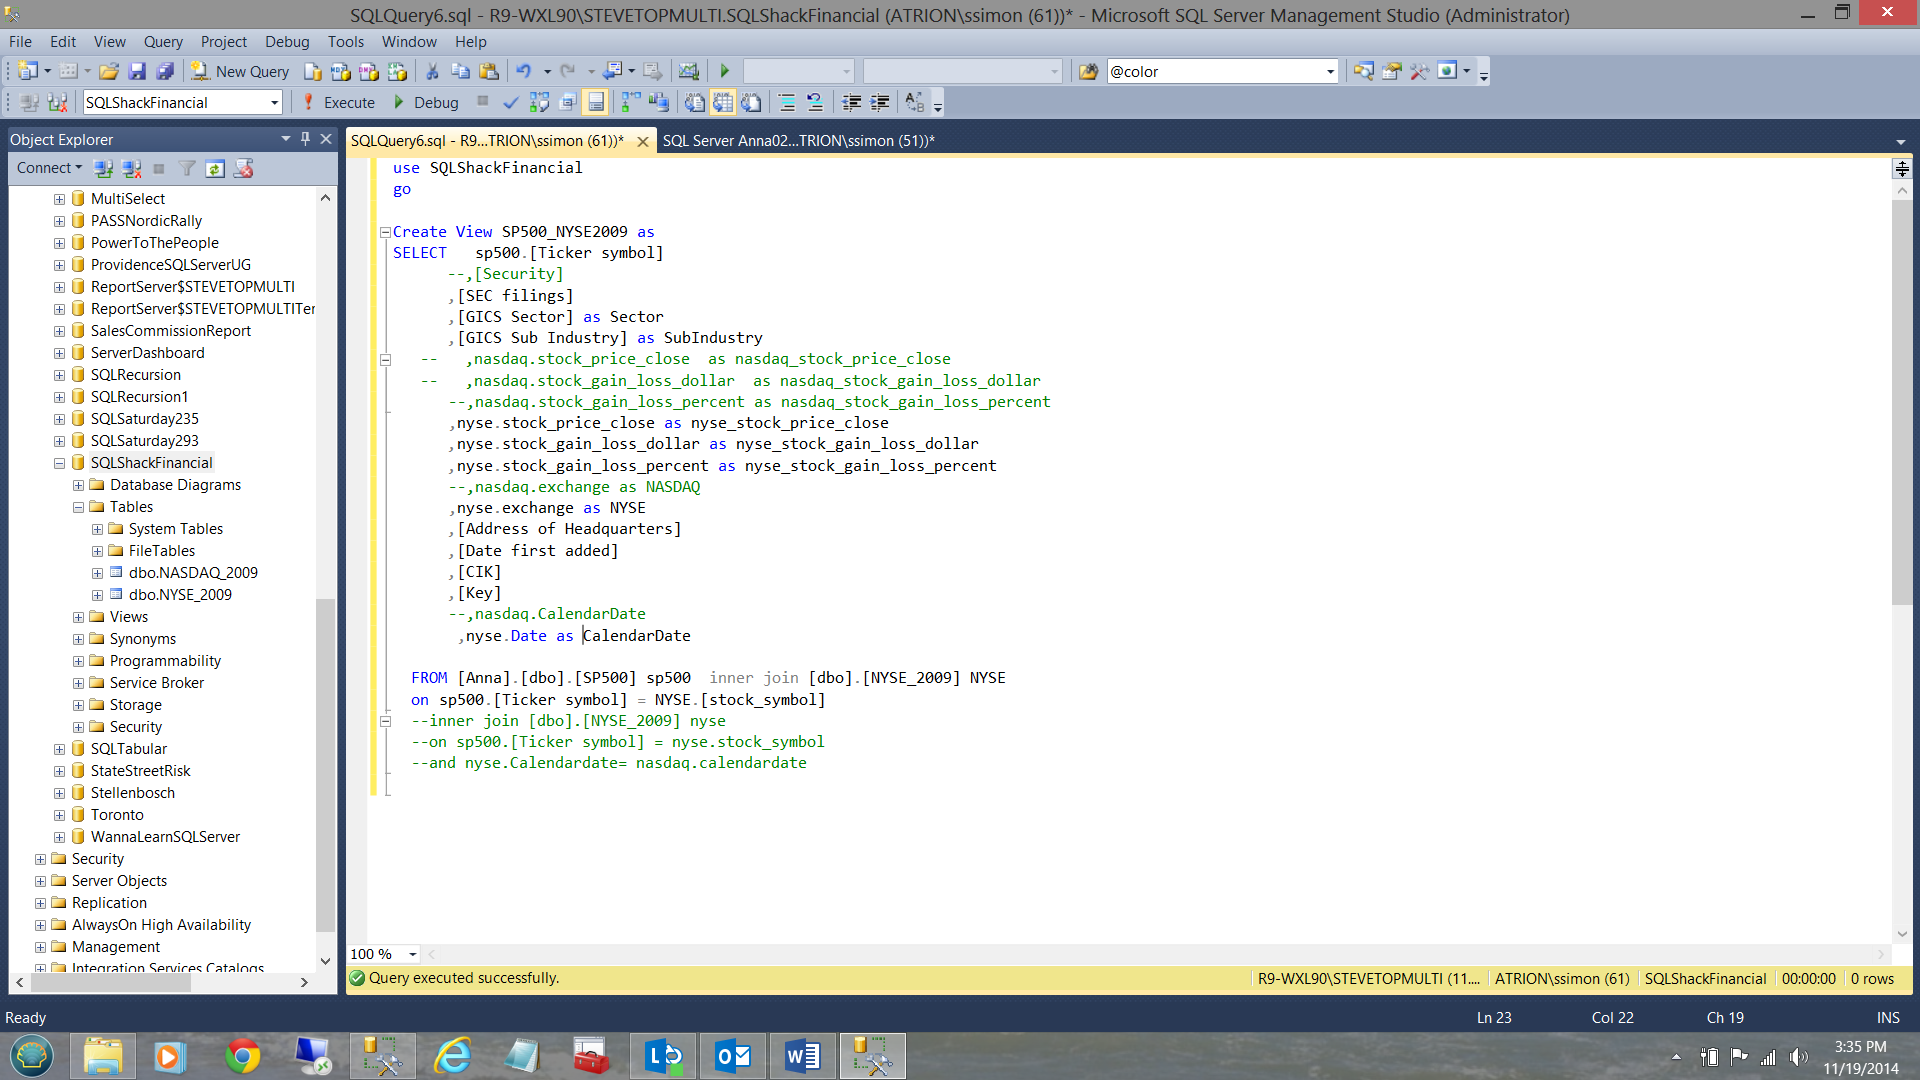
We shall now create two views, one of which will be used to link the S&P 500 table to the NYSE_2009
现在,我们将创建两个视图,其中一个将用于将S&P 500表链接到NYSE_2009。
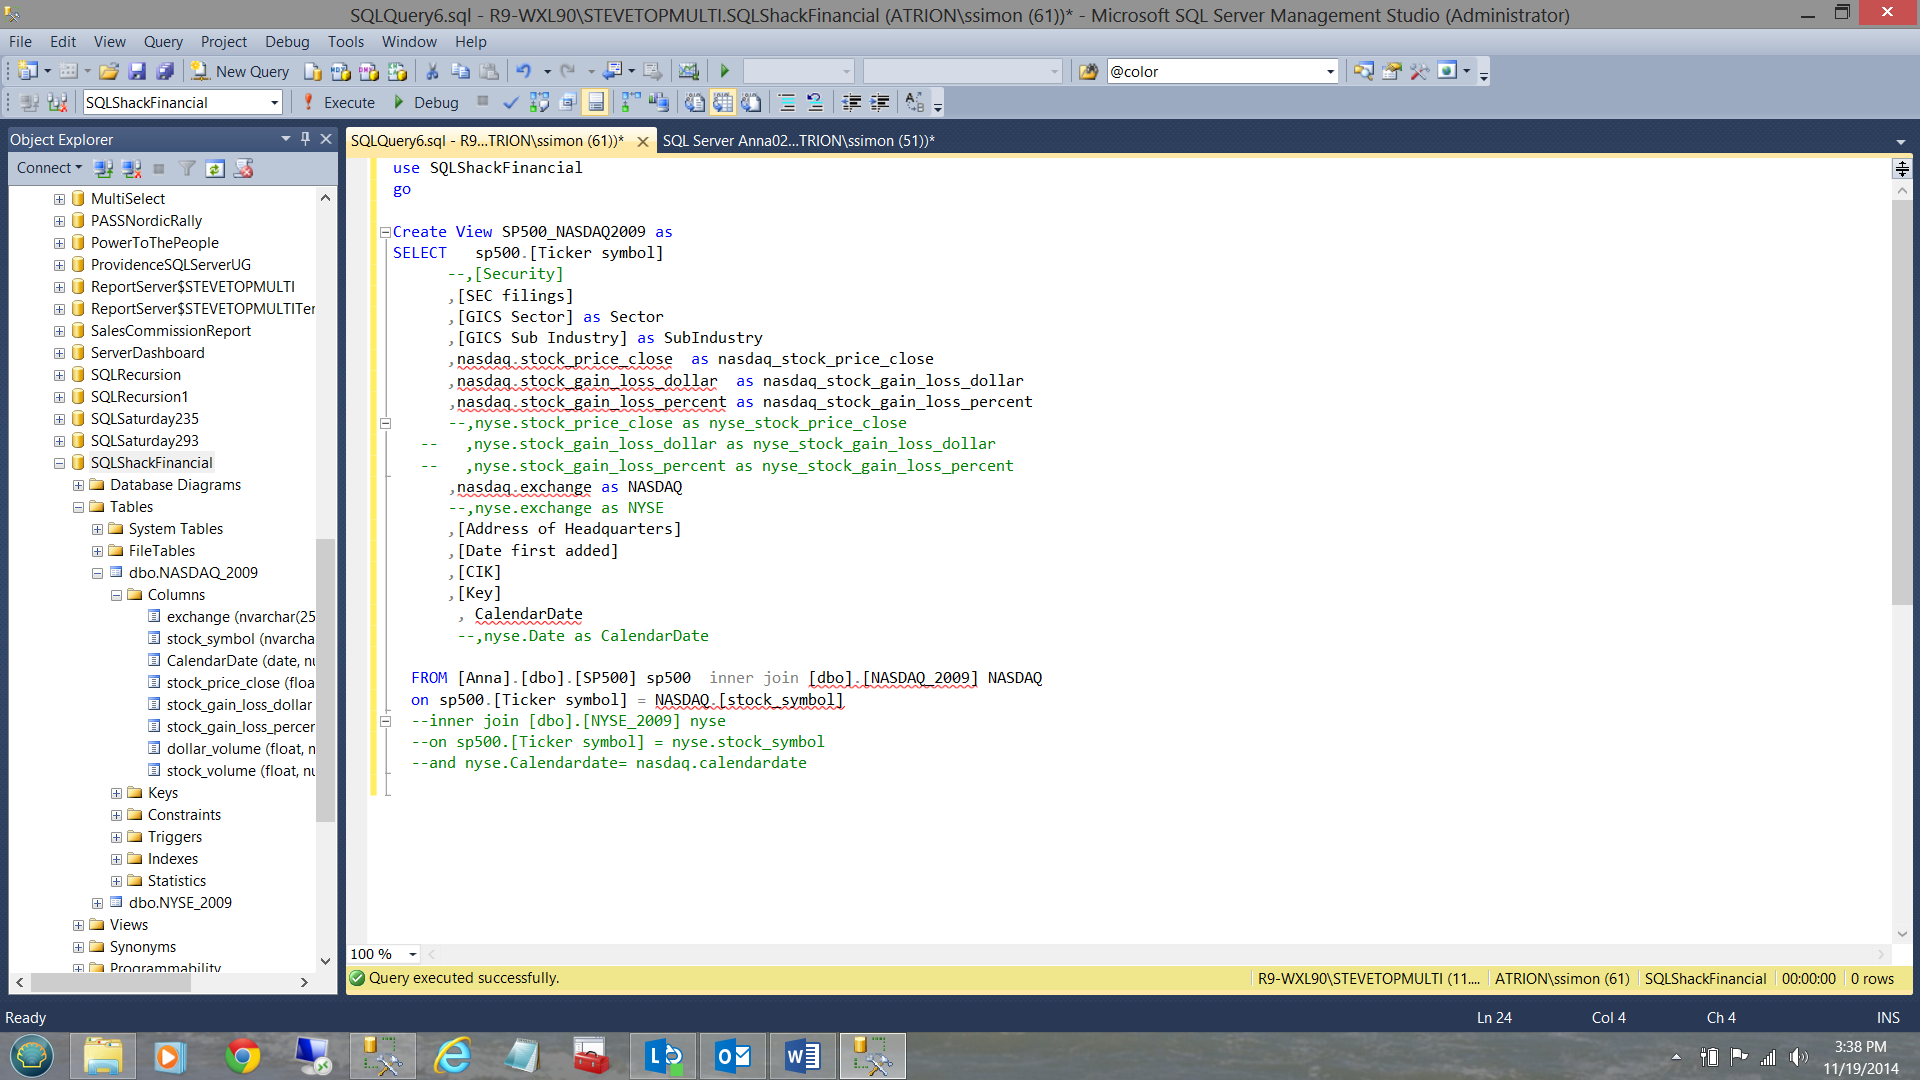
and the other to link the S&P 500 table to the NASDAQ_2009 table (see below).
另一个将S&P 500表链接到NASDAQ_2009表(请参见下文)。
构建我们的表格分析解决方案 (Constructing our Tabular Analytic Solution)
After much thought and design, I chose to utilize the tabular model. Not only does the tabular model give users the look and feel of a spreadsheet, it also permits us to create our own microcosm which is not easily established utilizing conventional multi-dimensional modeling.
经过深思熟虑和设计,我选择使用表格模型。 表格模型不仅为用户提供了电子表格的外观和感觉,还使我们能够创建自己的缩影,而使用常规的多维建模不容易建立缩影。
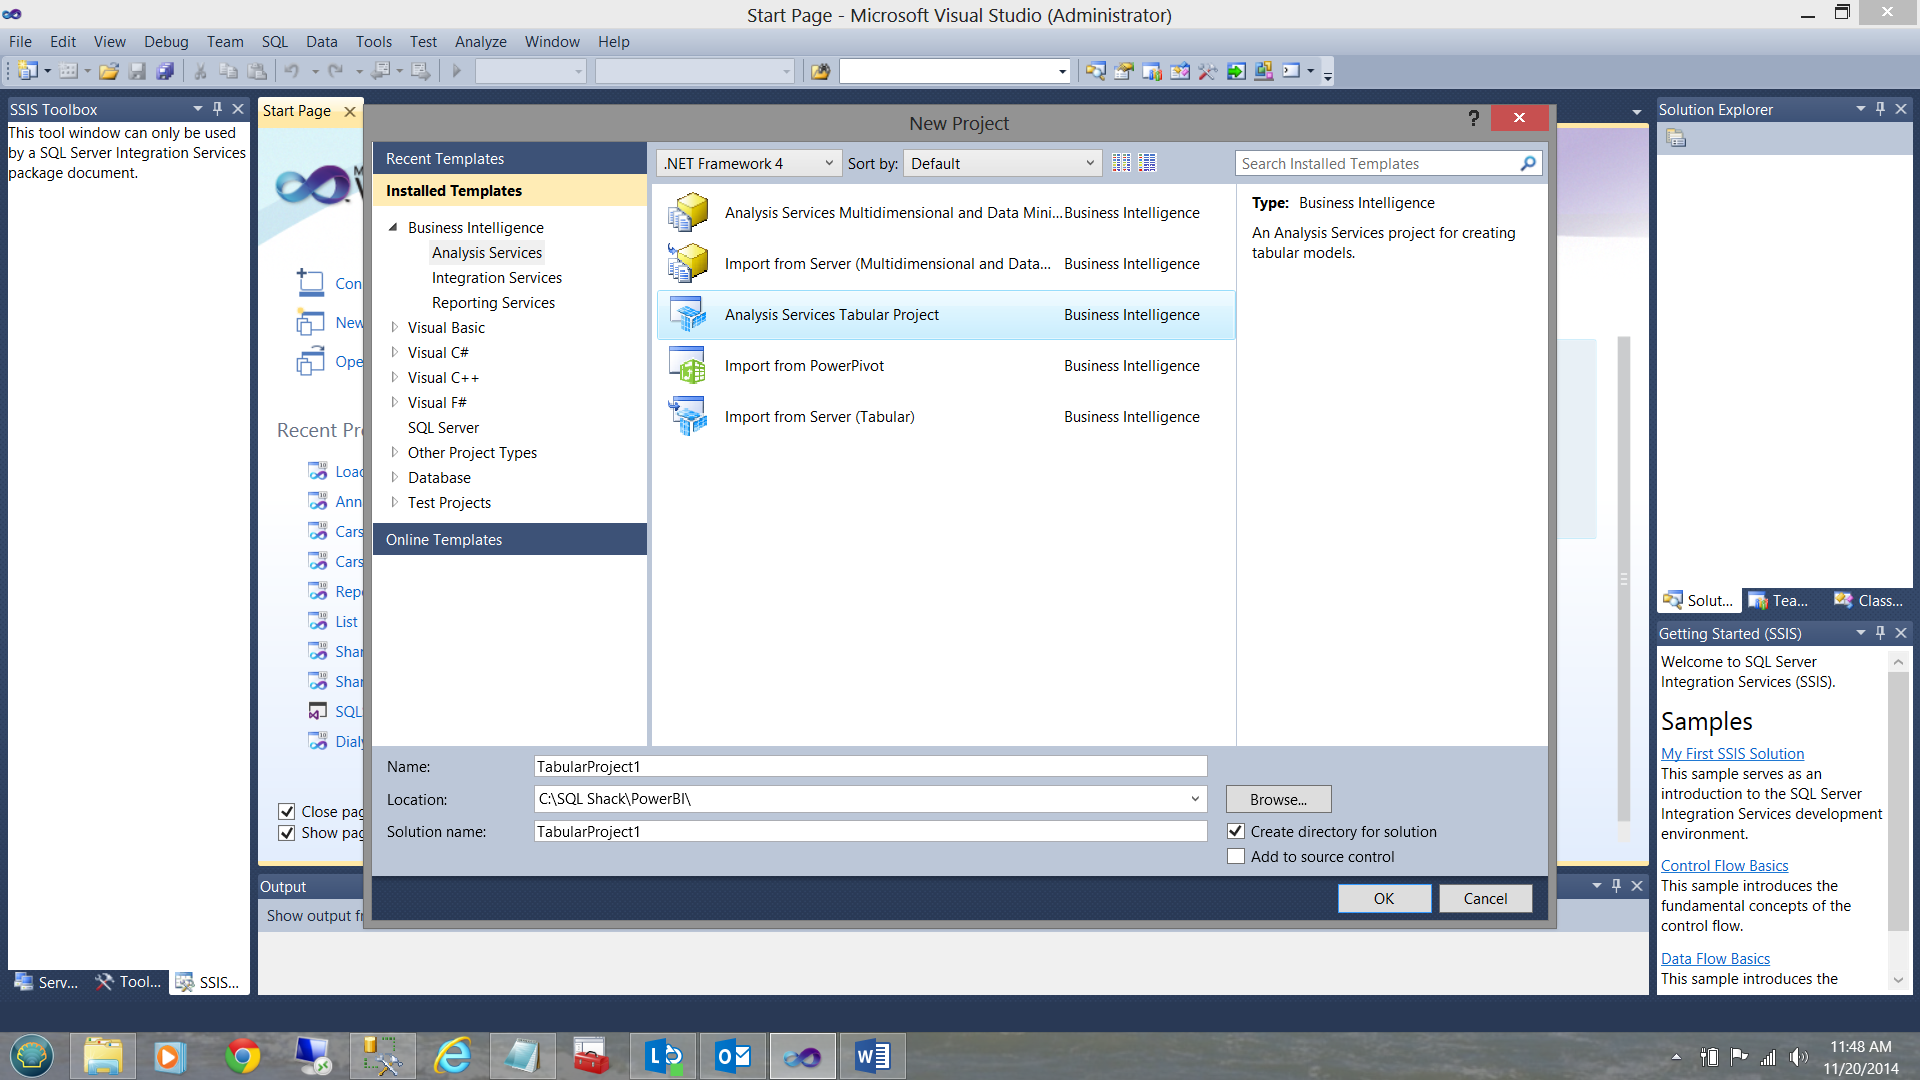
To begin we bring up SQL Server Data Tools (SSDT) and this time we are going to create and ‘Analysis Services Tabular Project’.
首先,我们介绍SQL Server数据工具(SSDT),这次我们将创建“ Analysis Services表格项目”。
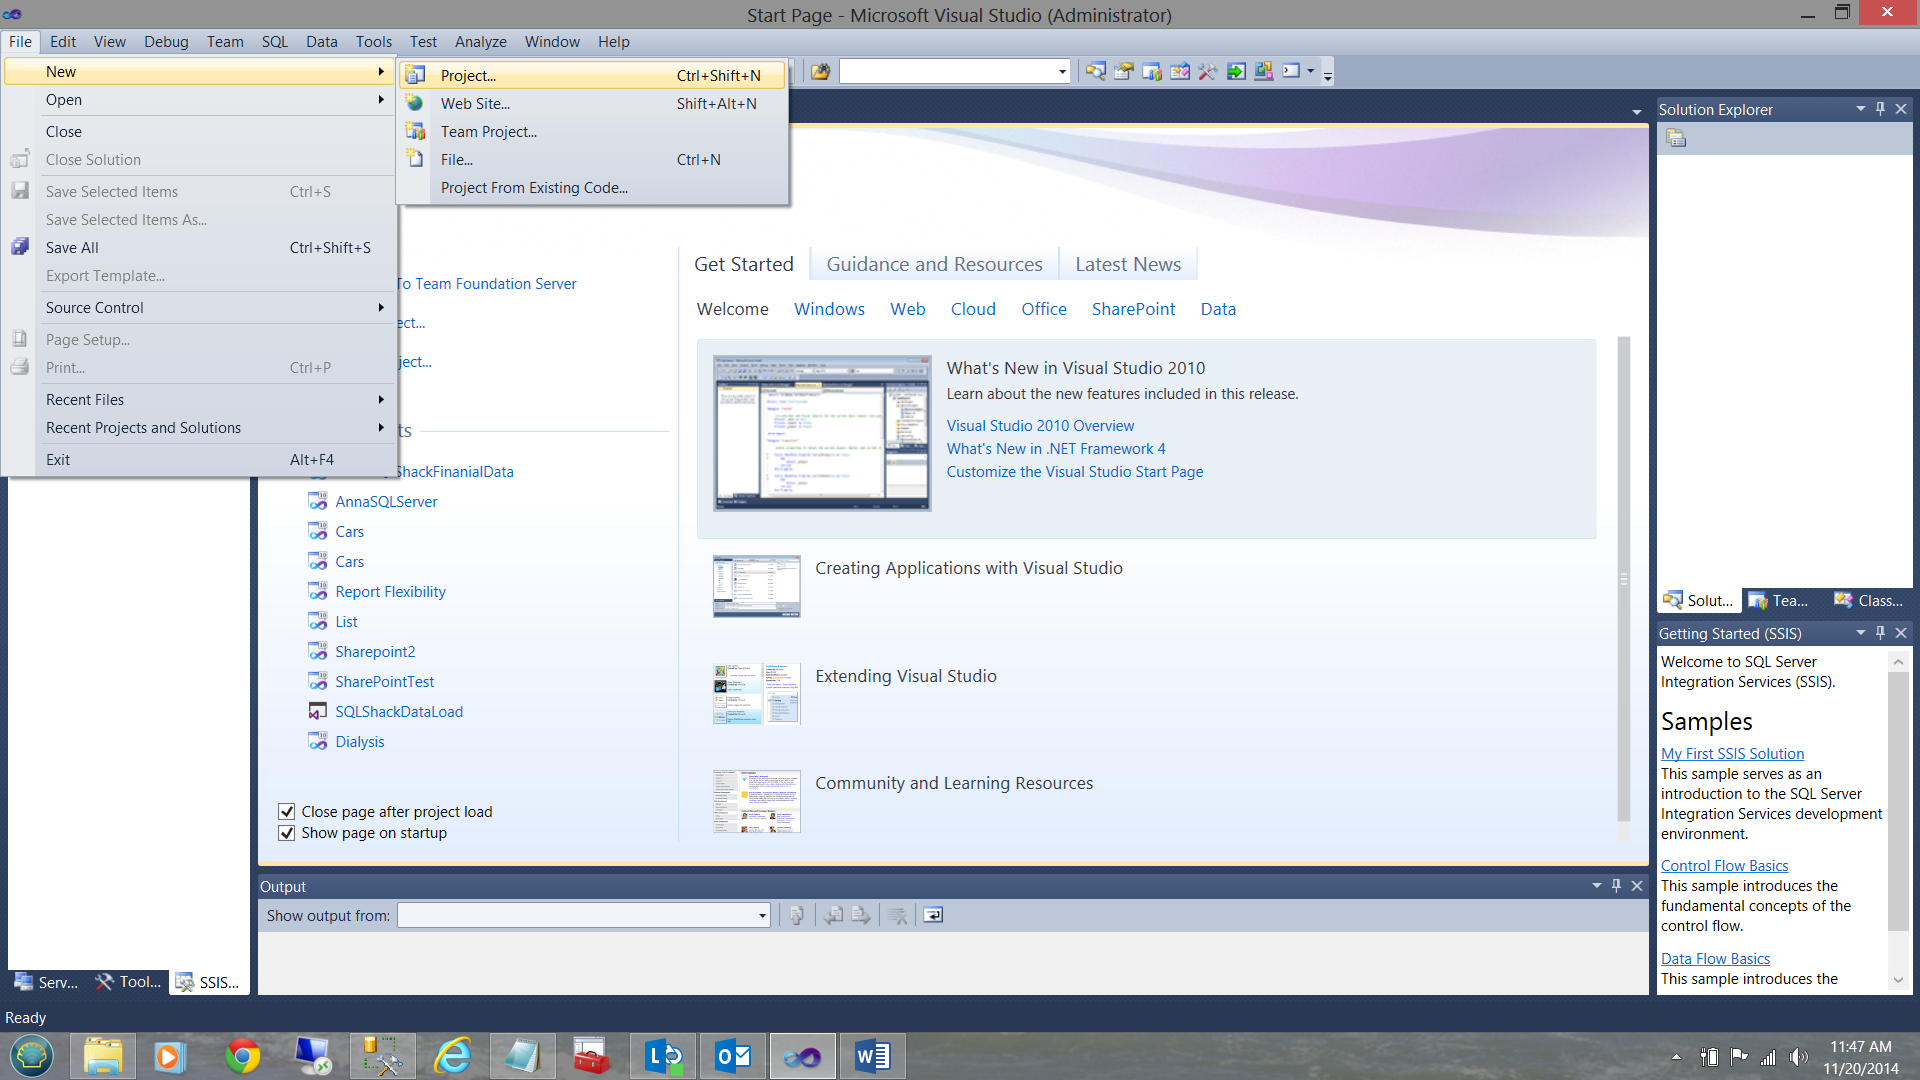
We click ‘New’ and select ‘Project’ from the main menu (see above). A further menu is then displayed. We select ‘Analysis Services Tabular Project from the ‘New Project’ menu (see below).
我们单击“新建”,然后从主菜单中选择“项目”(请参见上文)。 然后显示另一个菜单。 我们从“新项目”菜单中选择“ Analysis Services表格项目”(见下文)。
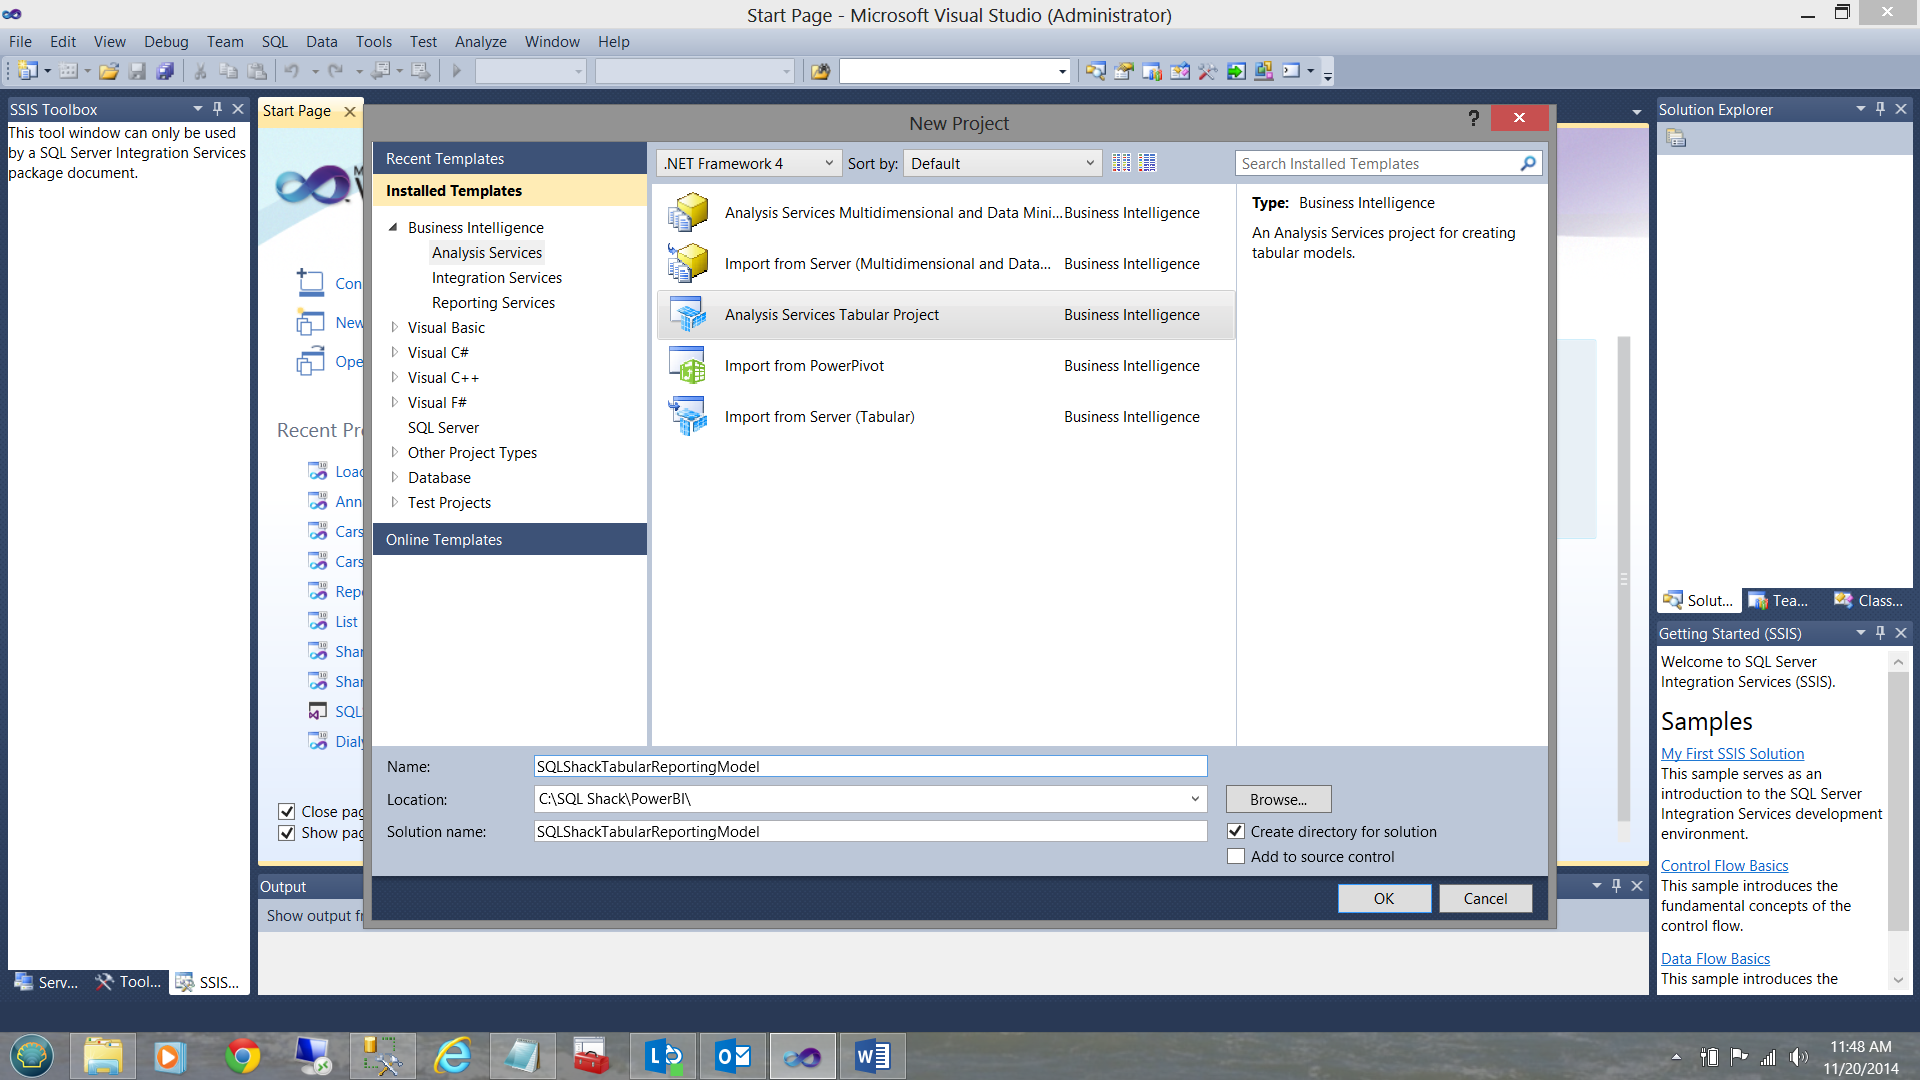
I give the project a name. In our case I call it ‘SQLShackTabulaReportingModel’, and click OK (see below).
我给这个项目起个名字。 在我们的例子中,我将其称为“ SQLShackTabulaReportingModel”,然后单击“确定”(见下文)。
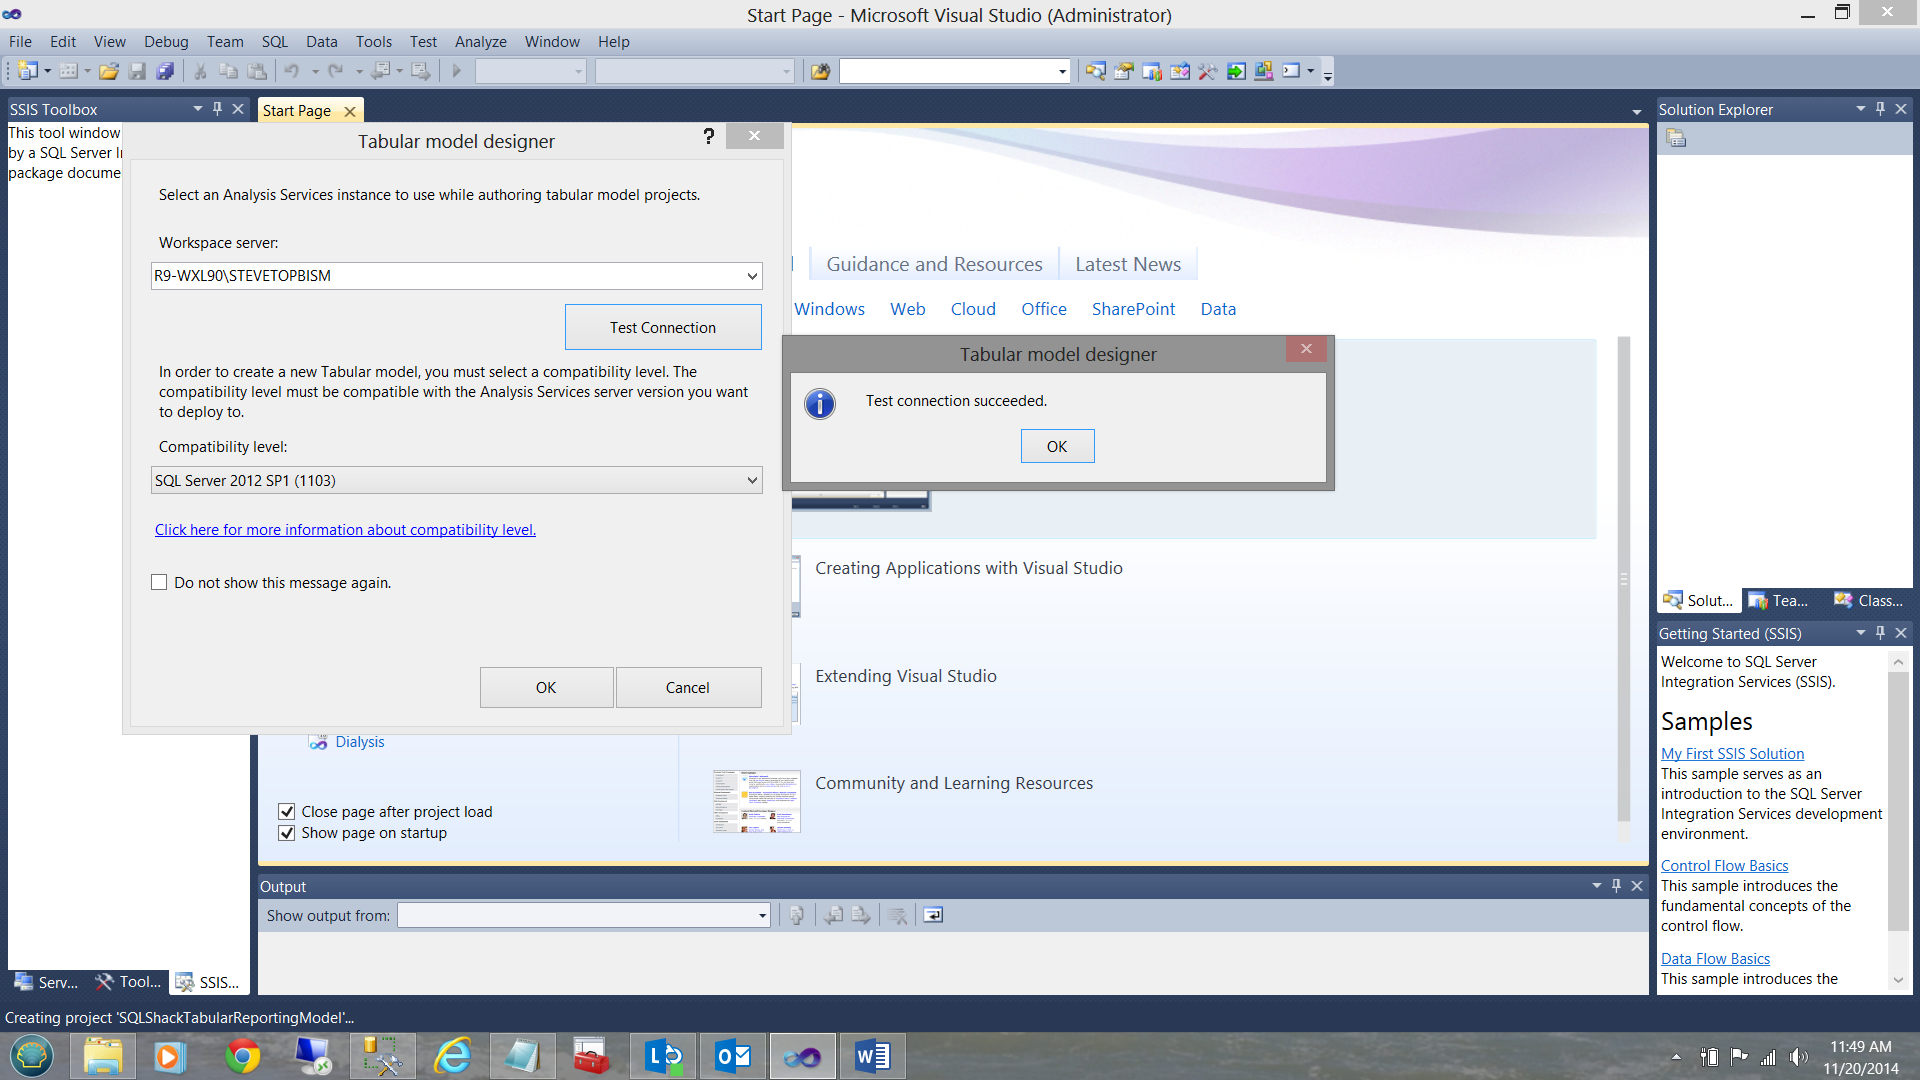
The system now asks me where the end project will reside, i.e. on which Analysis Services server. Having created the connection, I test it and I am informed that all is in order (see below).
系统现在询问我最终项目将驻留在哪里,即哪个Analysis Services服务器。 创建连接后,我对其进行了测试,并通知我一切正常(请参见下文)。
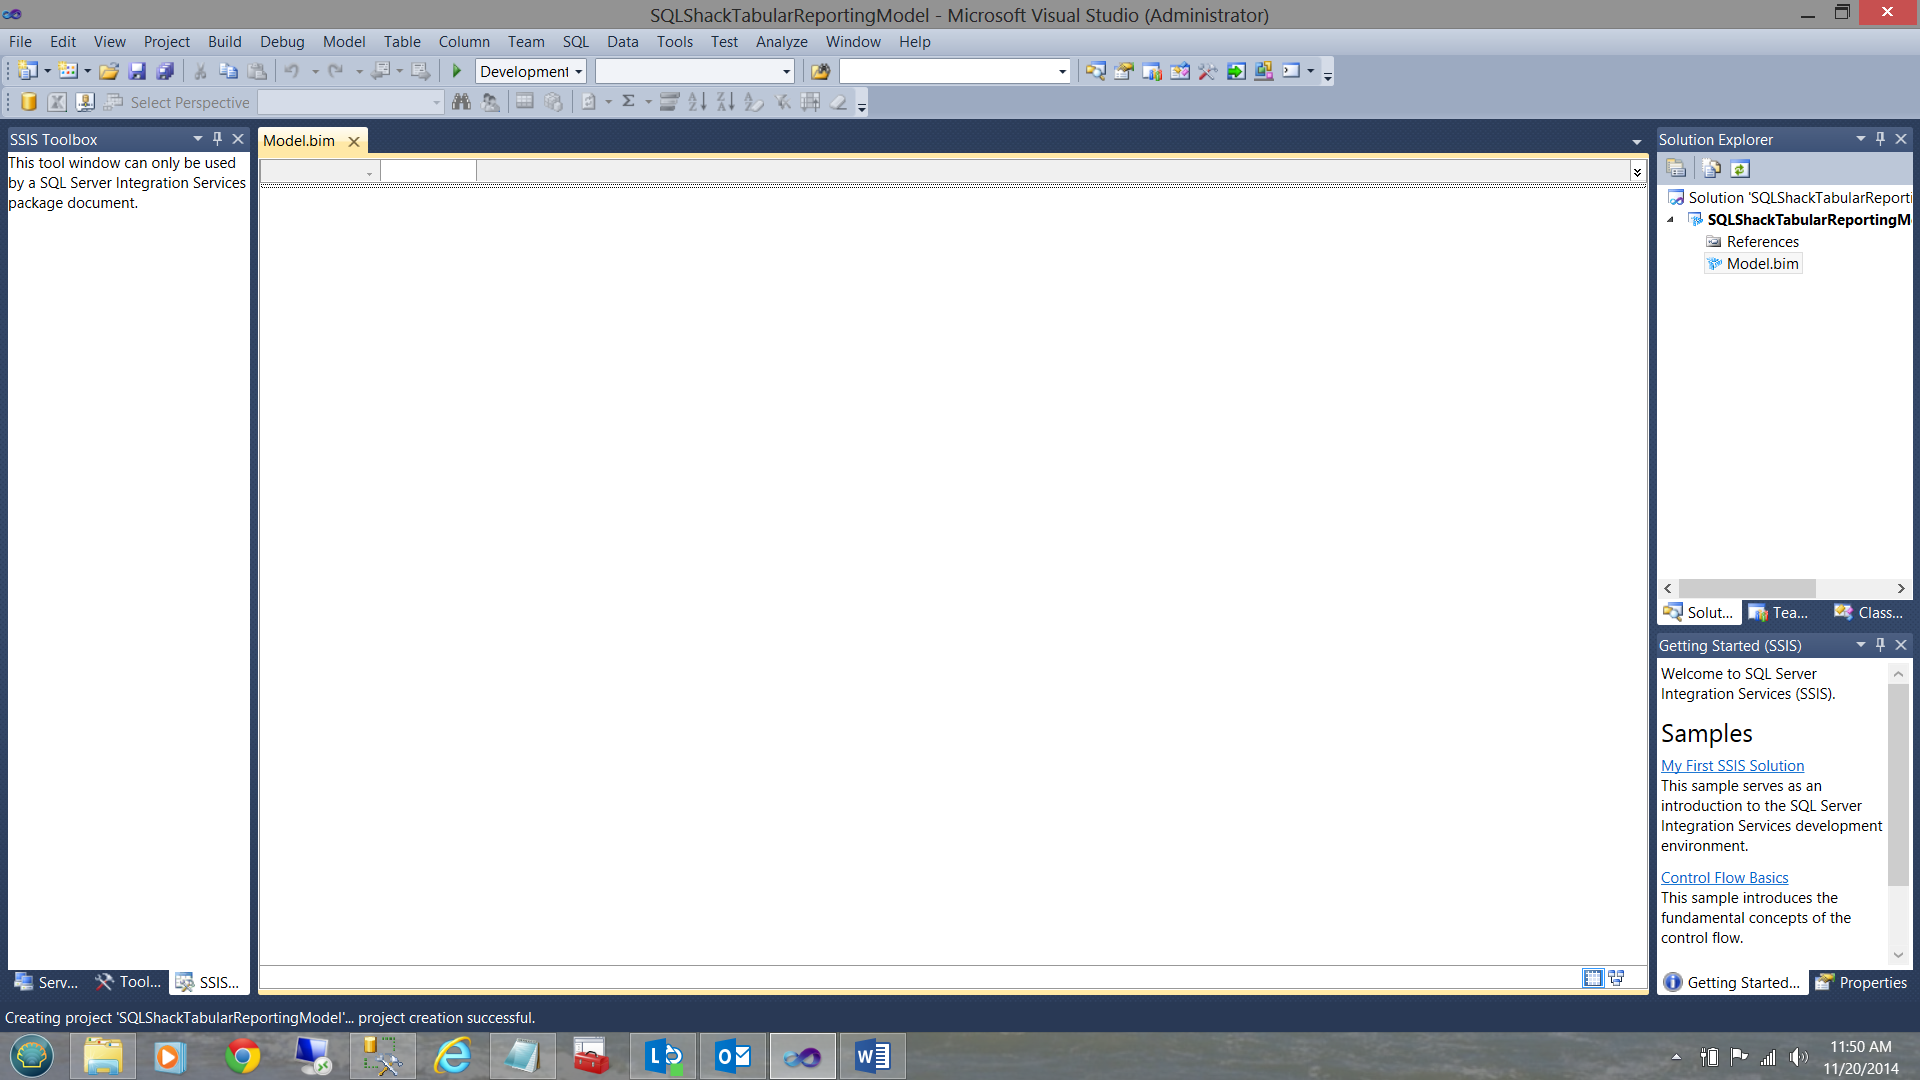
Having configured our project, we now arrived at our main work surface (the data model). Whilst we have defined where our end project will reside, we have yet to define the data source.
配置完项目后,我们现在到达主工作界面(数据模型)。 虽然我们已经定义了最终项目将驻留在哪里,但是我们还没有定义数据源。
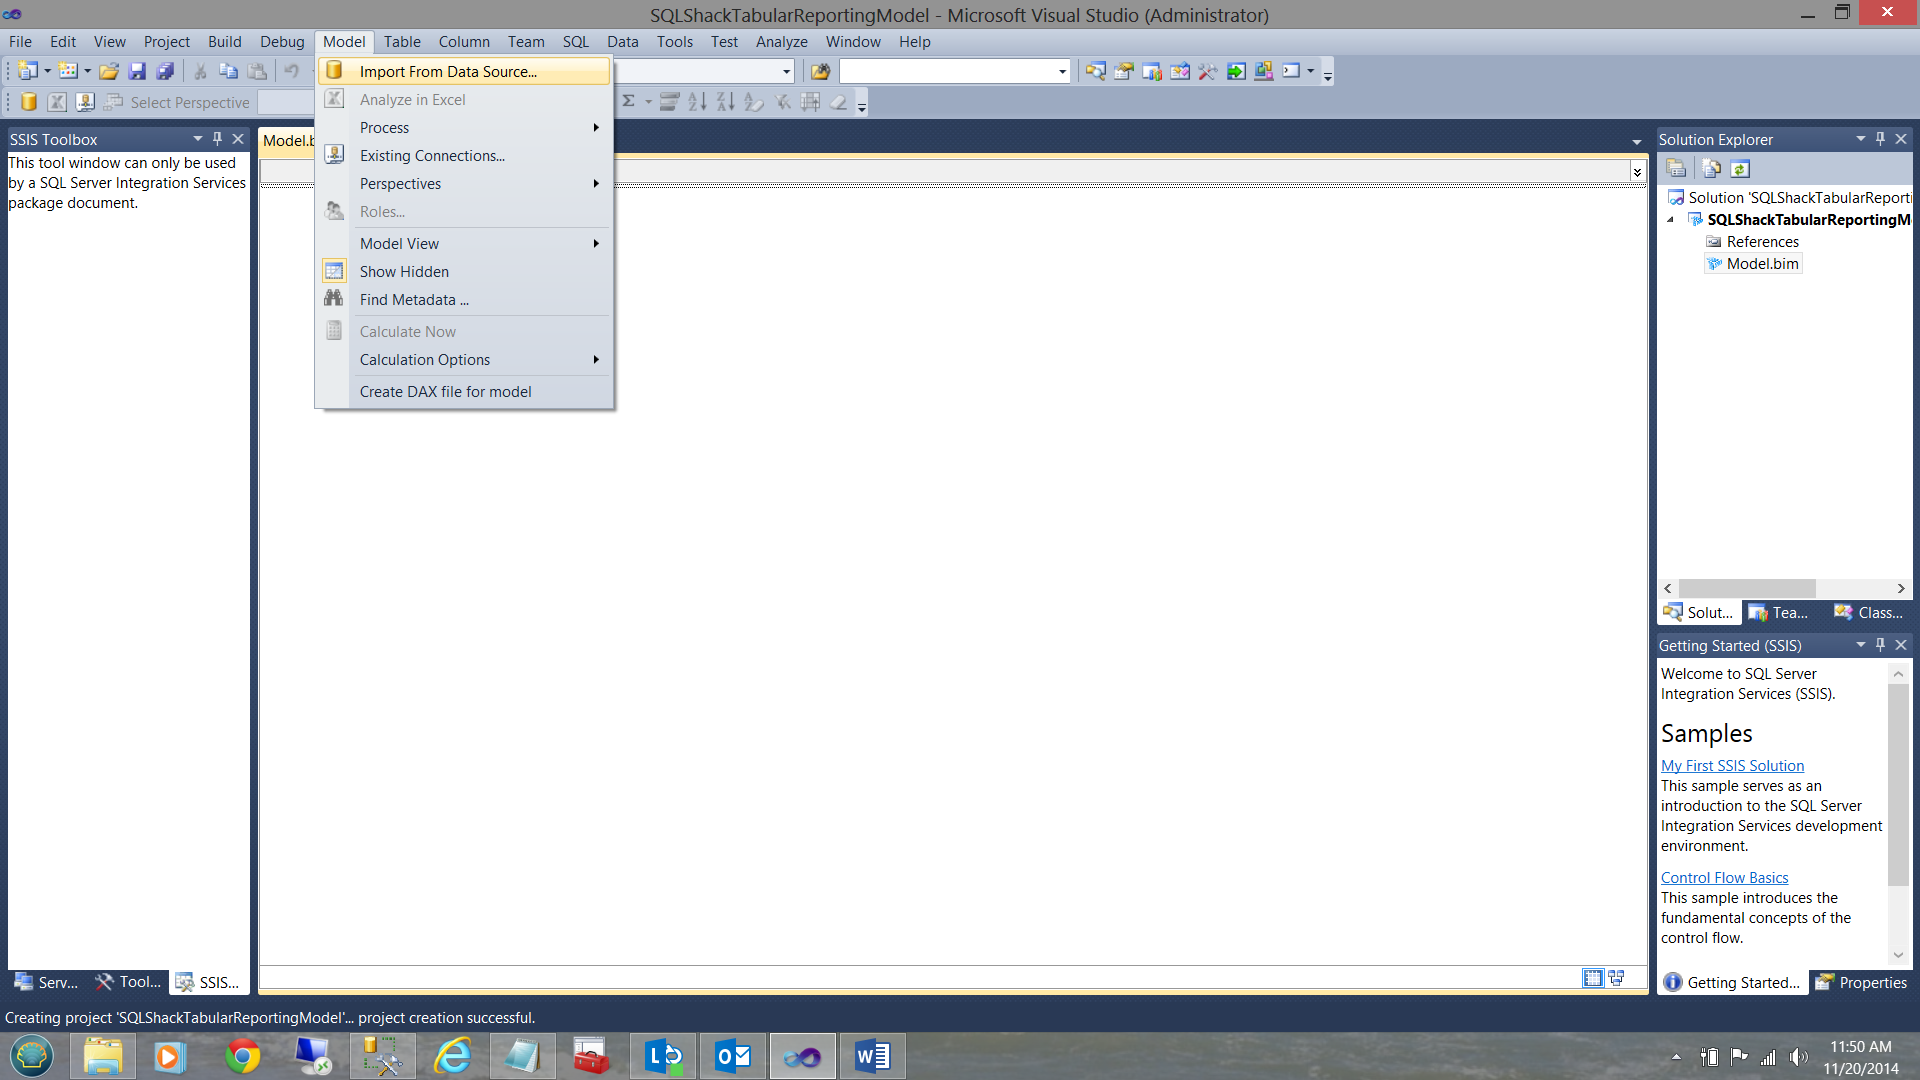
I click ‘Model’ and then “Import from Data Source’.
我单击“模型”,然后单击“从数据源导入”。
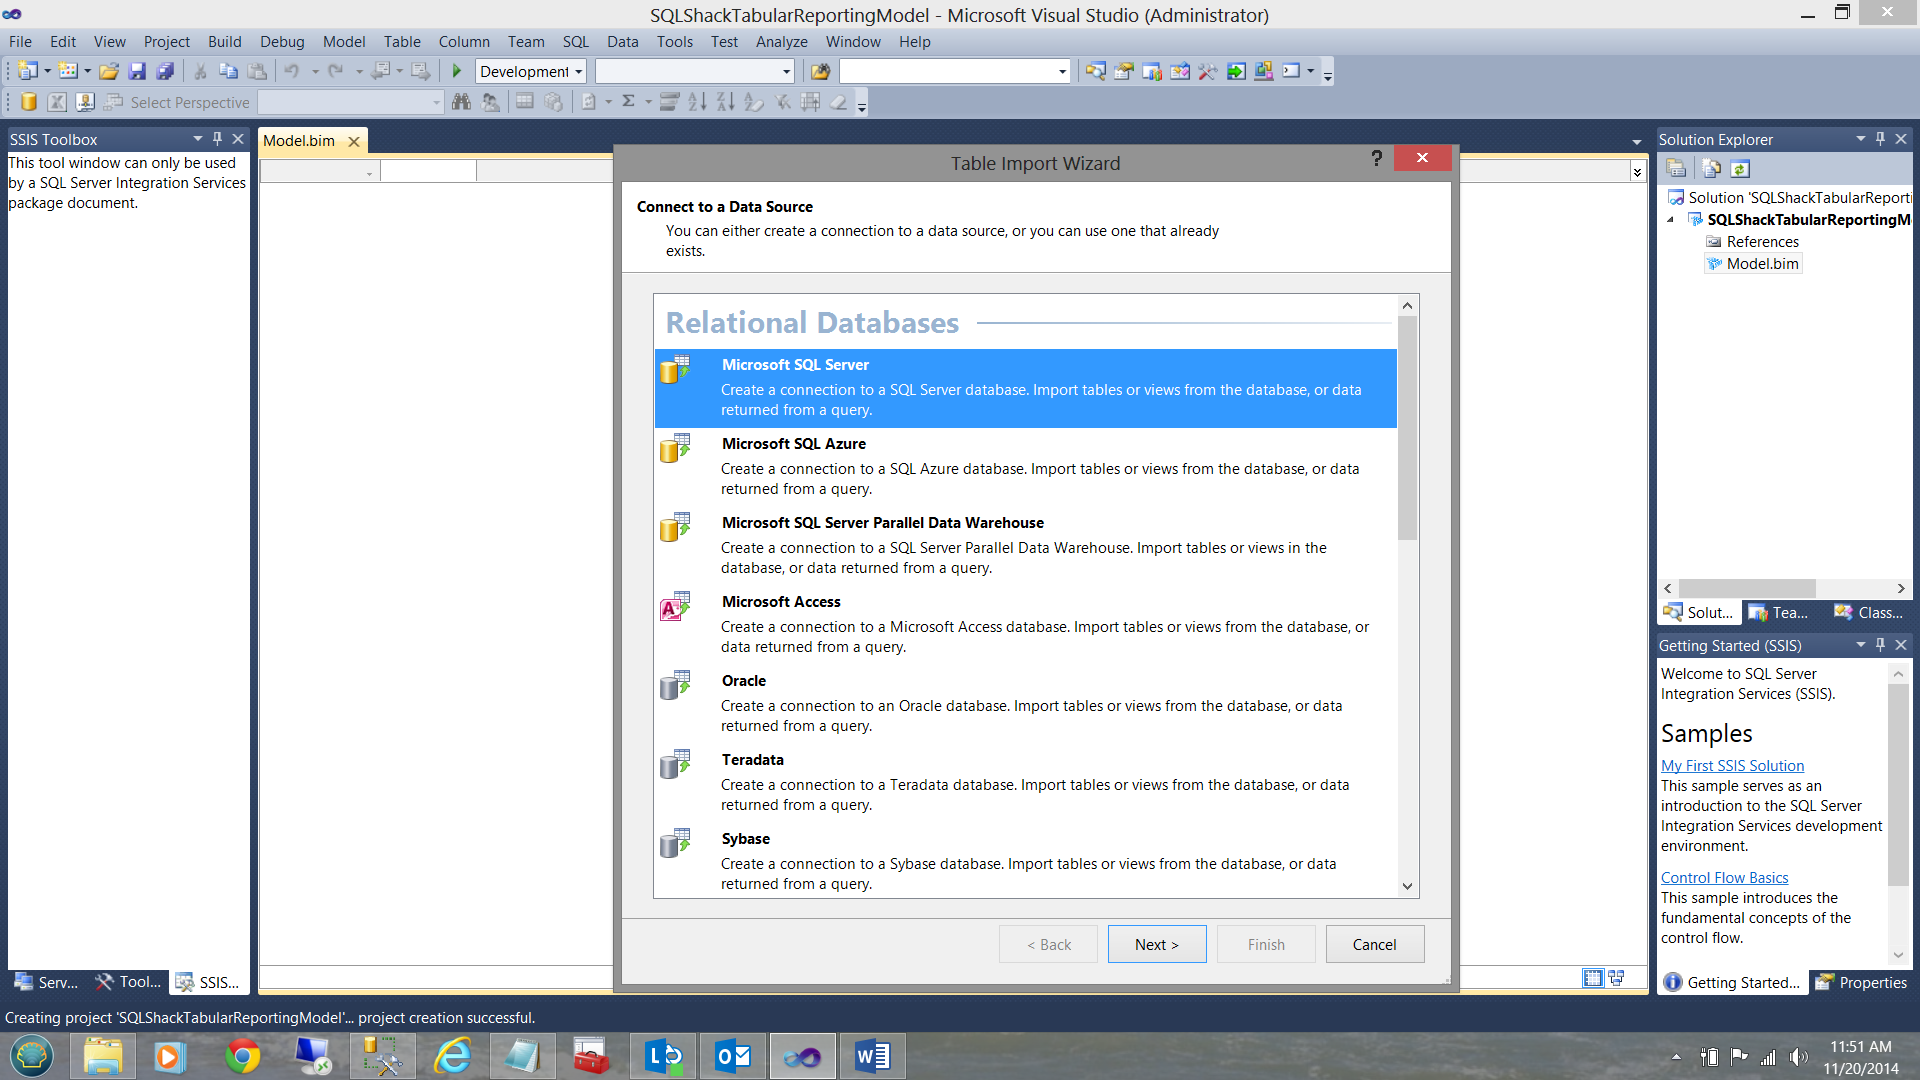
The ‘Table Import Wizard’ is brought up. I choose a ‘Microsoft SQL Server’ data source (see above). The ‘Define your data source’ input screen is now displayed (see below).
出现“表导入向导”。 我选择一个“ Microsoft SQL Server”数据源(请参见上文)。 现在显示“定义数据源”输入屏幕(请参见下文)。
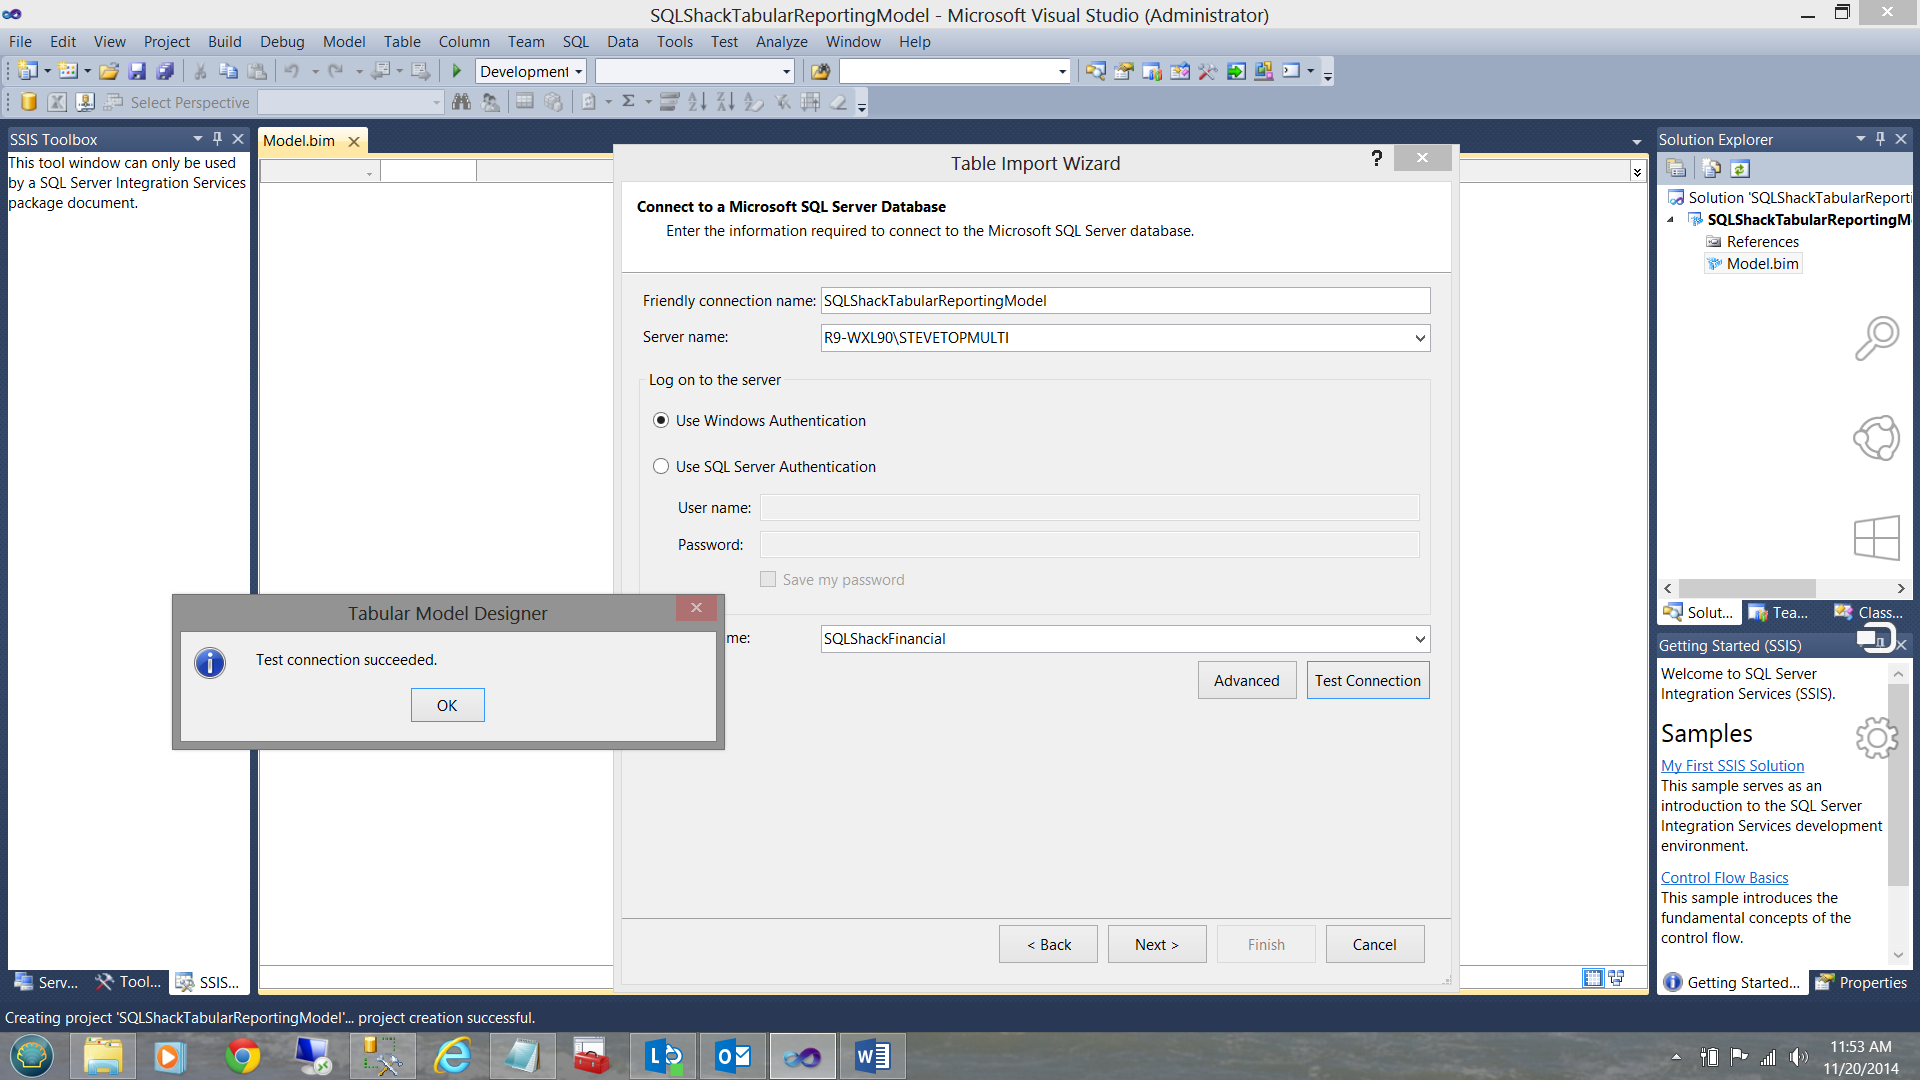
I can now test the connectivity to the ‘SQLShackFinancial’ relational database, the source data for our efforts today.
现在,我可以测试到“ SQLShackFinancial”关系数据库的连接性,这是我们今天努力的源数据。
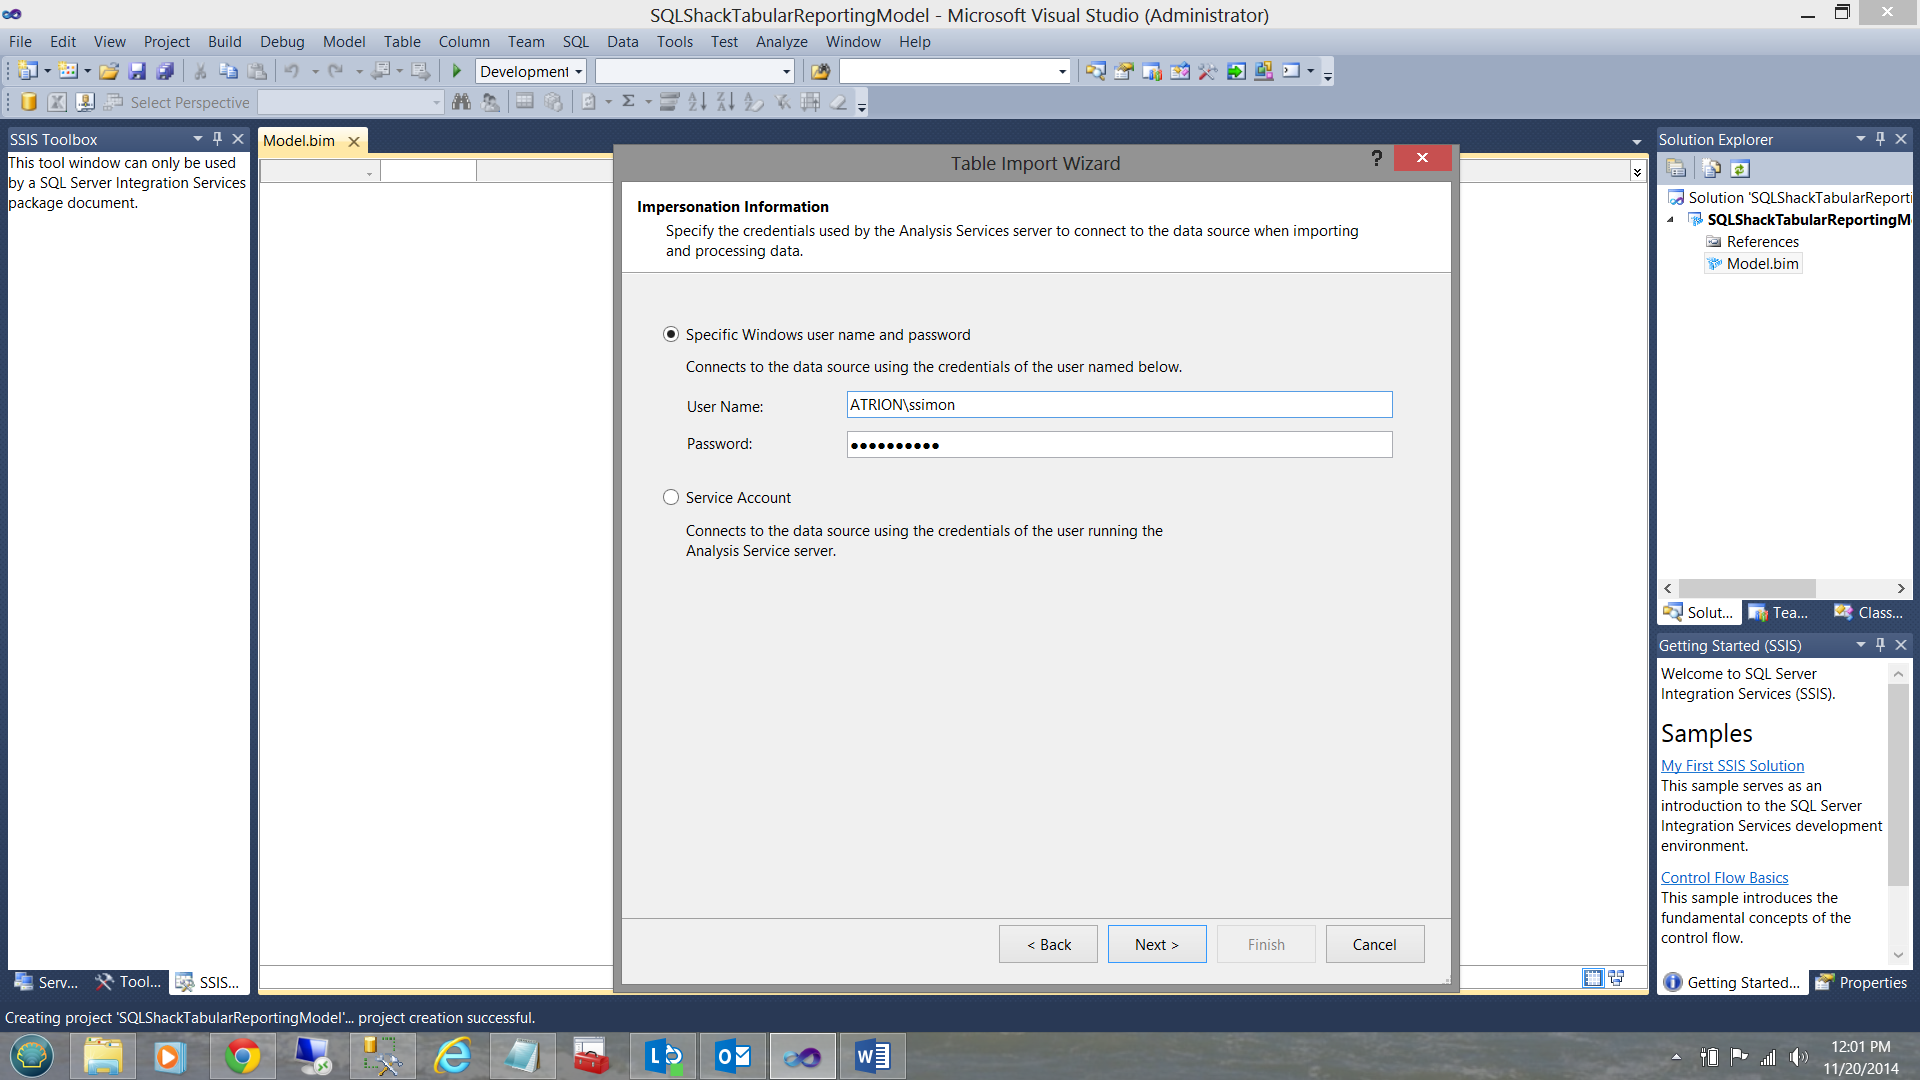
Having defined the connection, I am next asked for the credentials that will be used to access the data (see above). The system then verifies that I have the necessary rights to view the data and if the authentication is successful then the system will ask me to select the table(s) and view(s) that I wish to import into our project (see below).
定义了连接之后,接下来要求我提供用于访问数据的凭据(请参见上文)。 然后,系统会验证我是否具有查看数据的必要权限,并且如果身份验证成功,那么系统将要求我选择要导入到我们的项目中的表和视图(请参见下文) 。

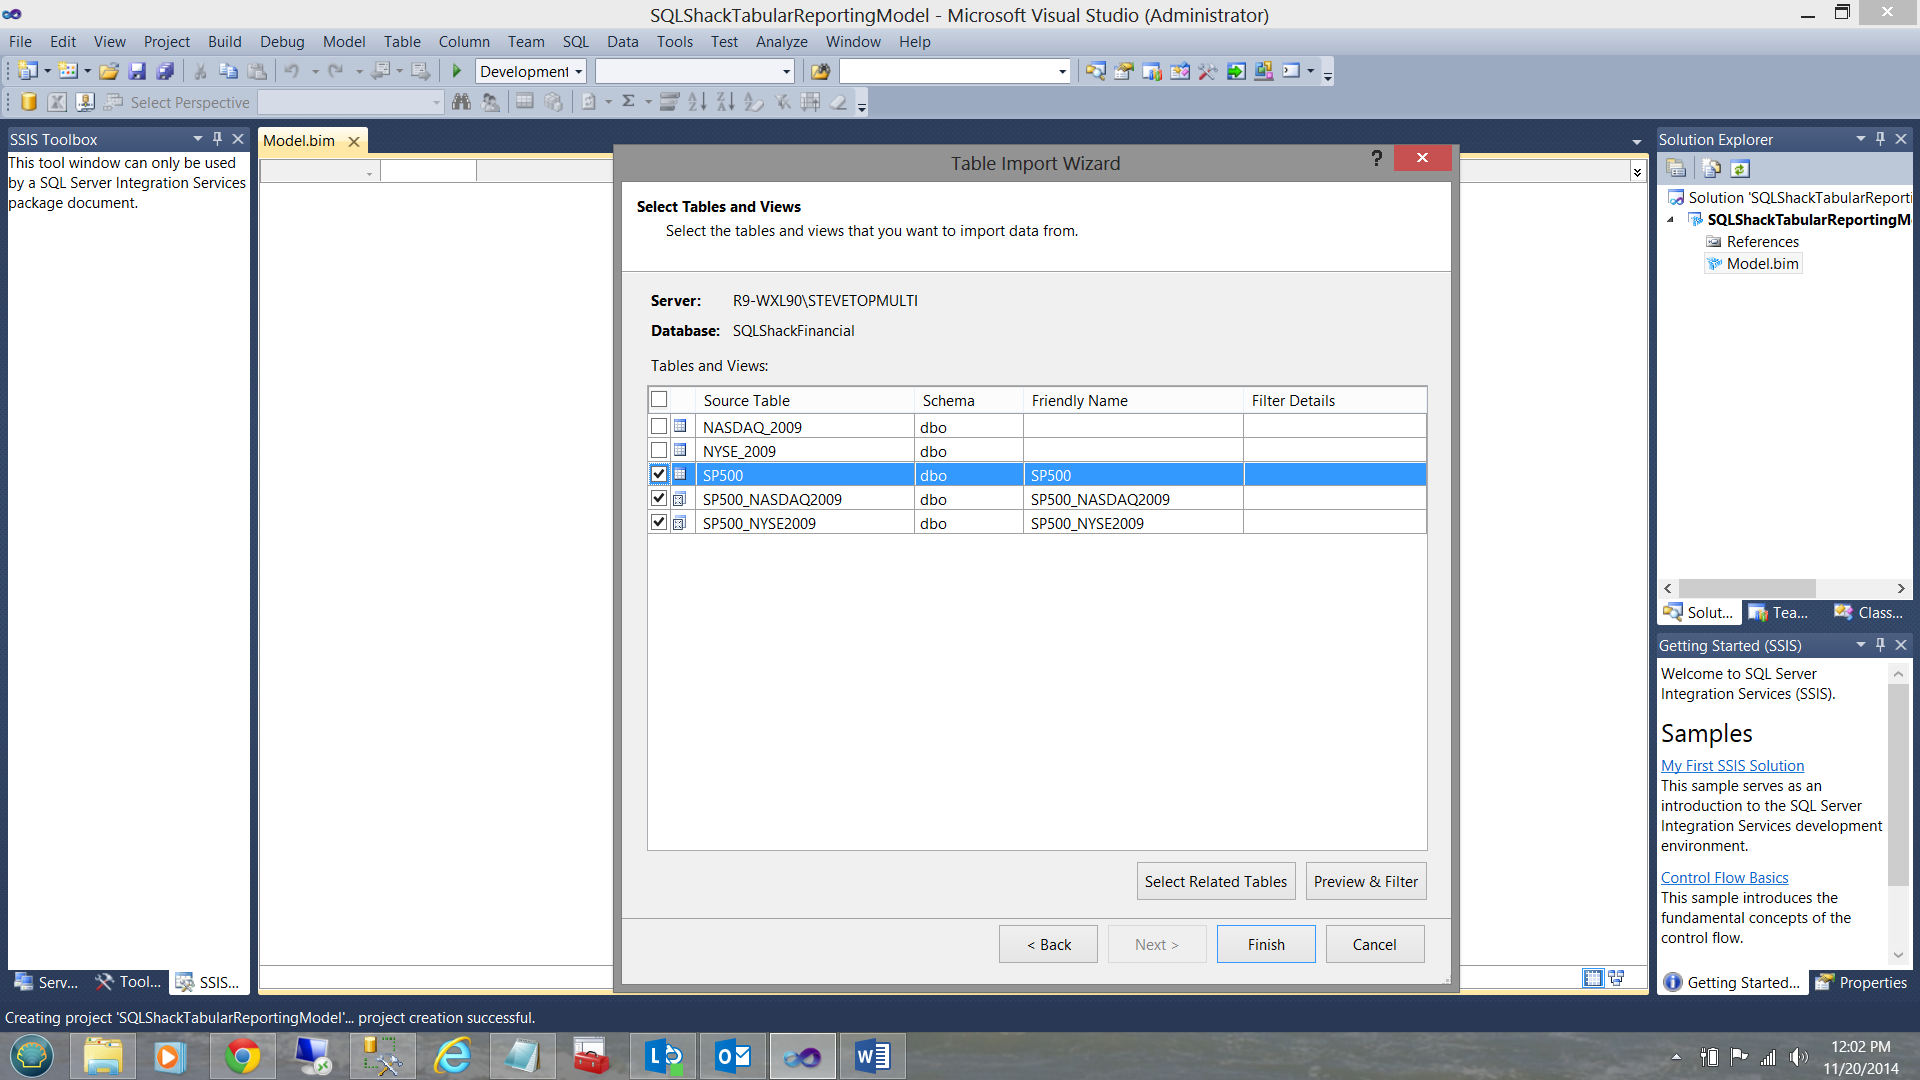
The best ‘fit’ for what we shall utilize in this discussion are data from the SP500 table and from the two views that we created above (see the screen dump above).
我们在本次讨论中将要使用的最佳“契合度”是来自SP500表和上面创建的两个视图的数据(请参见上面的屏幕转储)。
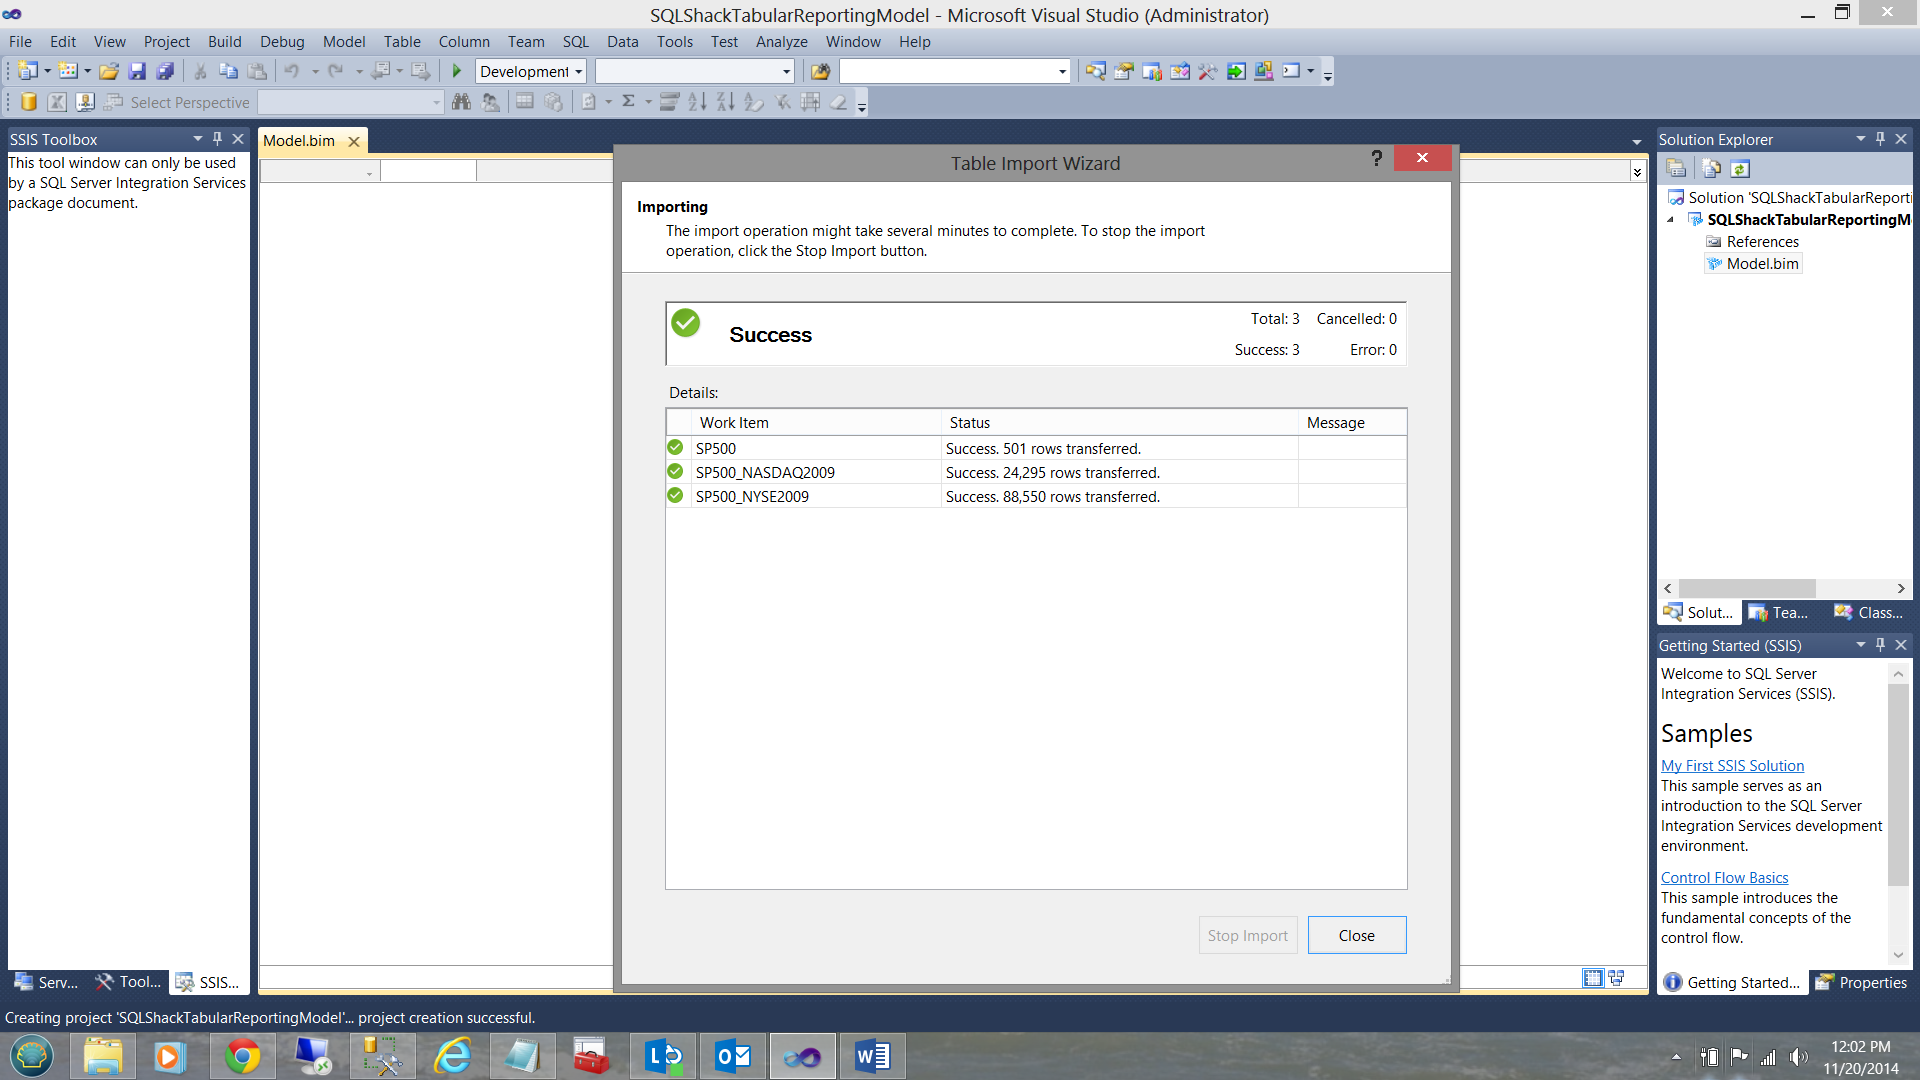
The system now loads the data and when loading has completed (and if the load was successful), you will receive a ‘Success’ notification as may be seen below:
现在,系统将加载数据,并且在加载完成后(如果加载成功),您将收到“成功”通知,如下所示:
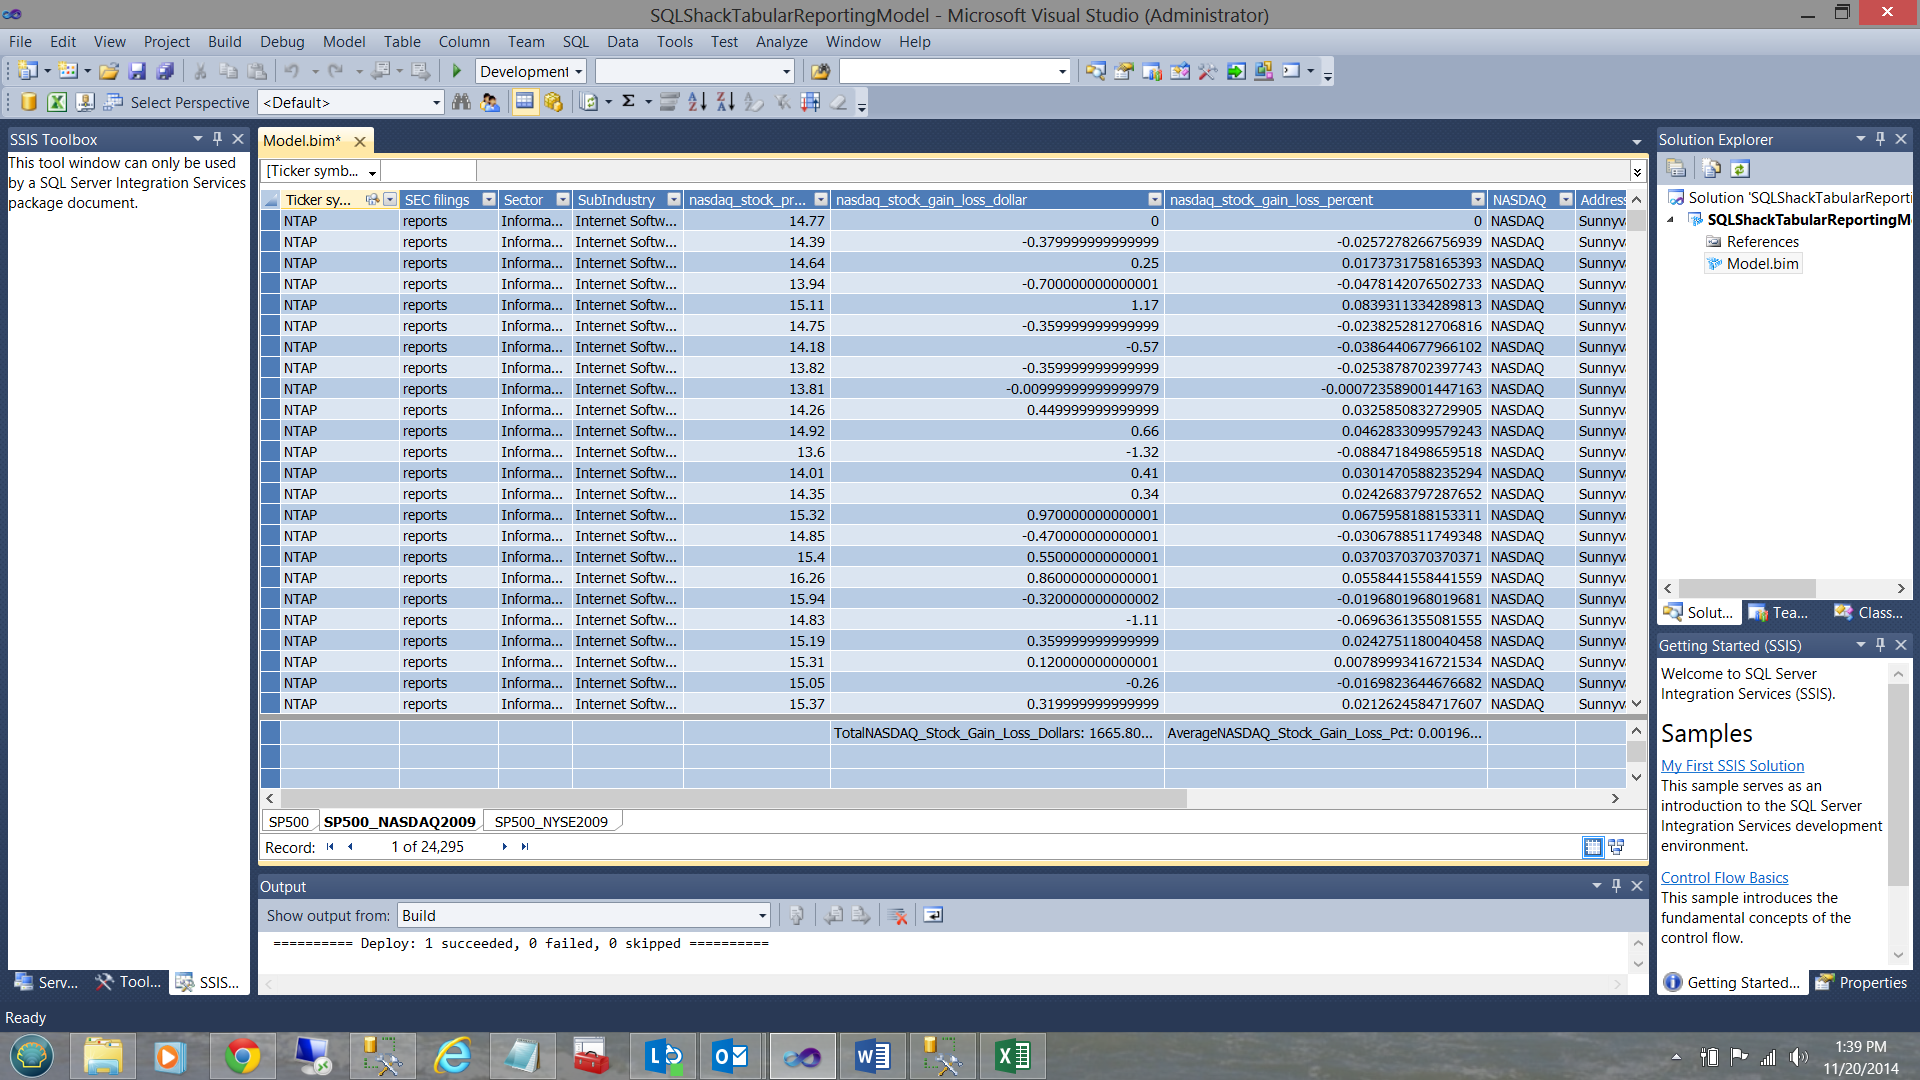
Once the process is complete your screen should be similar to the one below:
该过程完成后,您的屏幕应类似于以下屏幕:
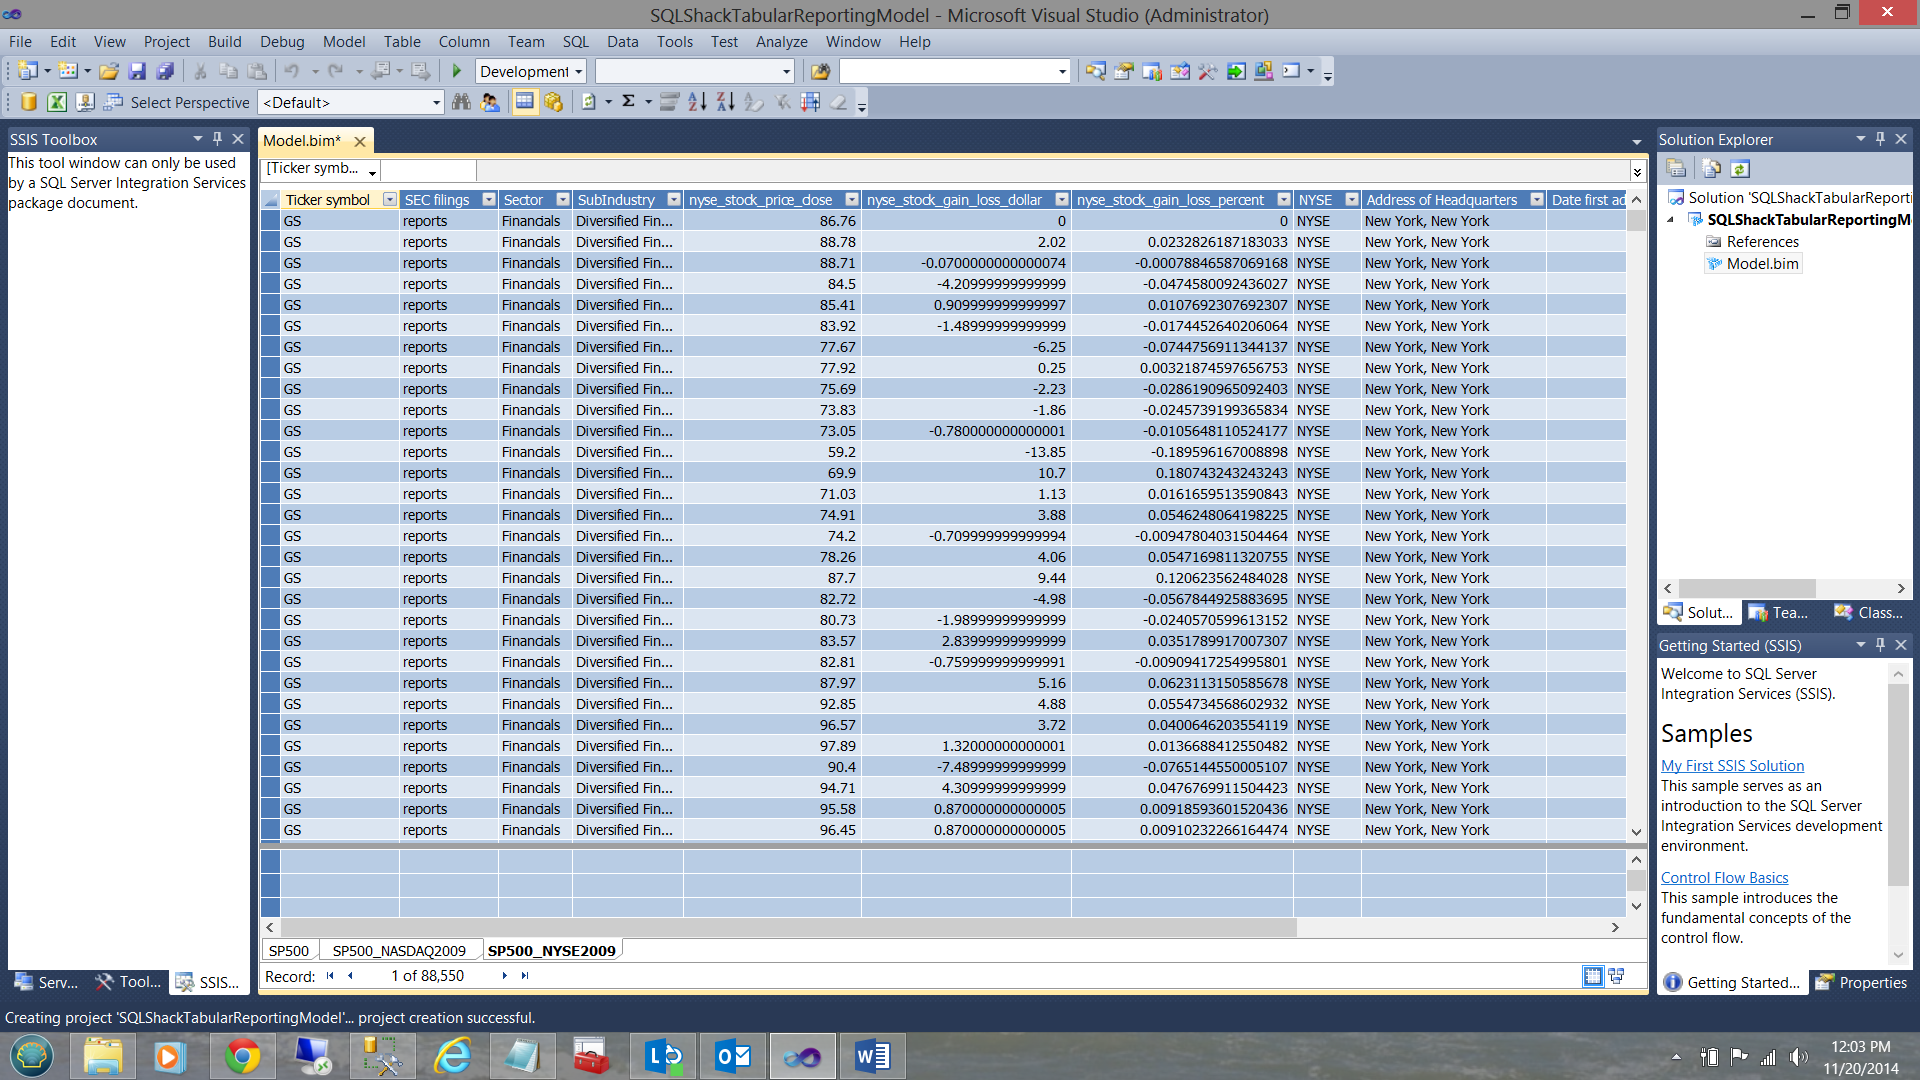
Note that the data from the SP500 table and data from the two views may be seen in the screen dump above. Note also, the manner in which the data is displayed and it does bring to mind the workings of a spreadsheet. This is the big selling point for the product, especially where financial folks are concerned.
请注意,可以在上面的屏幕转储中看到SP500表中的数据和两个视图中的数据。 还要注意,数据的显示方式和它的确使我想到了电子表格的工作方式。 这是该产品的主要卖点,尤其是对于财务人员而言。
制定措施 (Creating our measures)
When working with any analytic solution, albeit Multidimensional or Tabular, we have ‘facts’ or ‘measures’ in addition to dimensions. In our case the ‘gain or loss dollars’ and the ‘gain or loss percentages’ are our measures and the sectors and sub-industries will be our dimensions. In short we shall be asking ourselves what are the gain/losses for a particular ‘sub-industry’ within a sector?
使用多维或表格形式的任何分析解决方案时,除维数外,我们还有“事实”或“度量”。 在我们的案例中,“获利或亏损美元”和“获利或亏损百分比”是我们的度量标准,行业和子行业将是我们的规模。 简而言之,我们将问自己一个部门中特定“子行业”的收益/损失是什么?
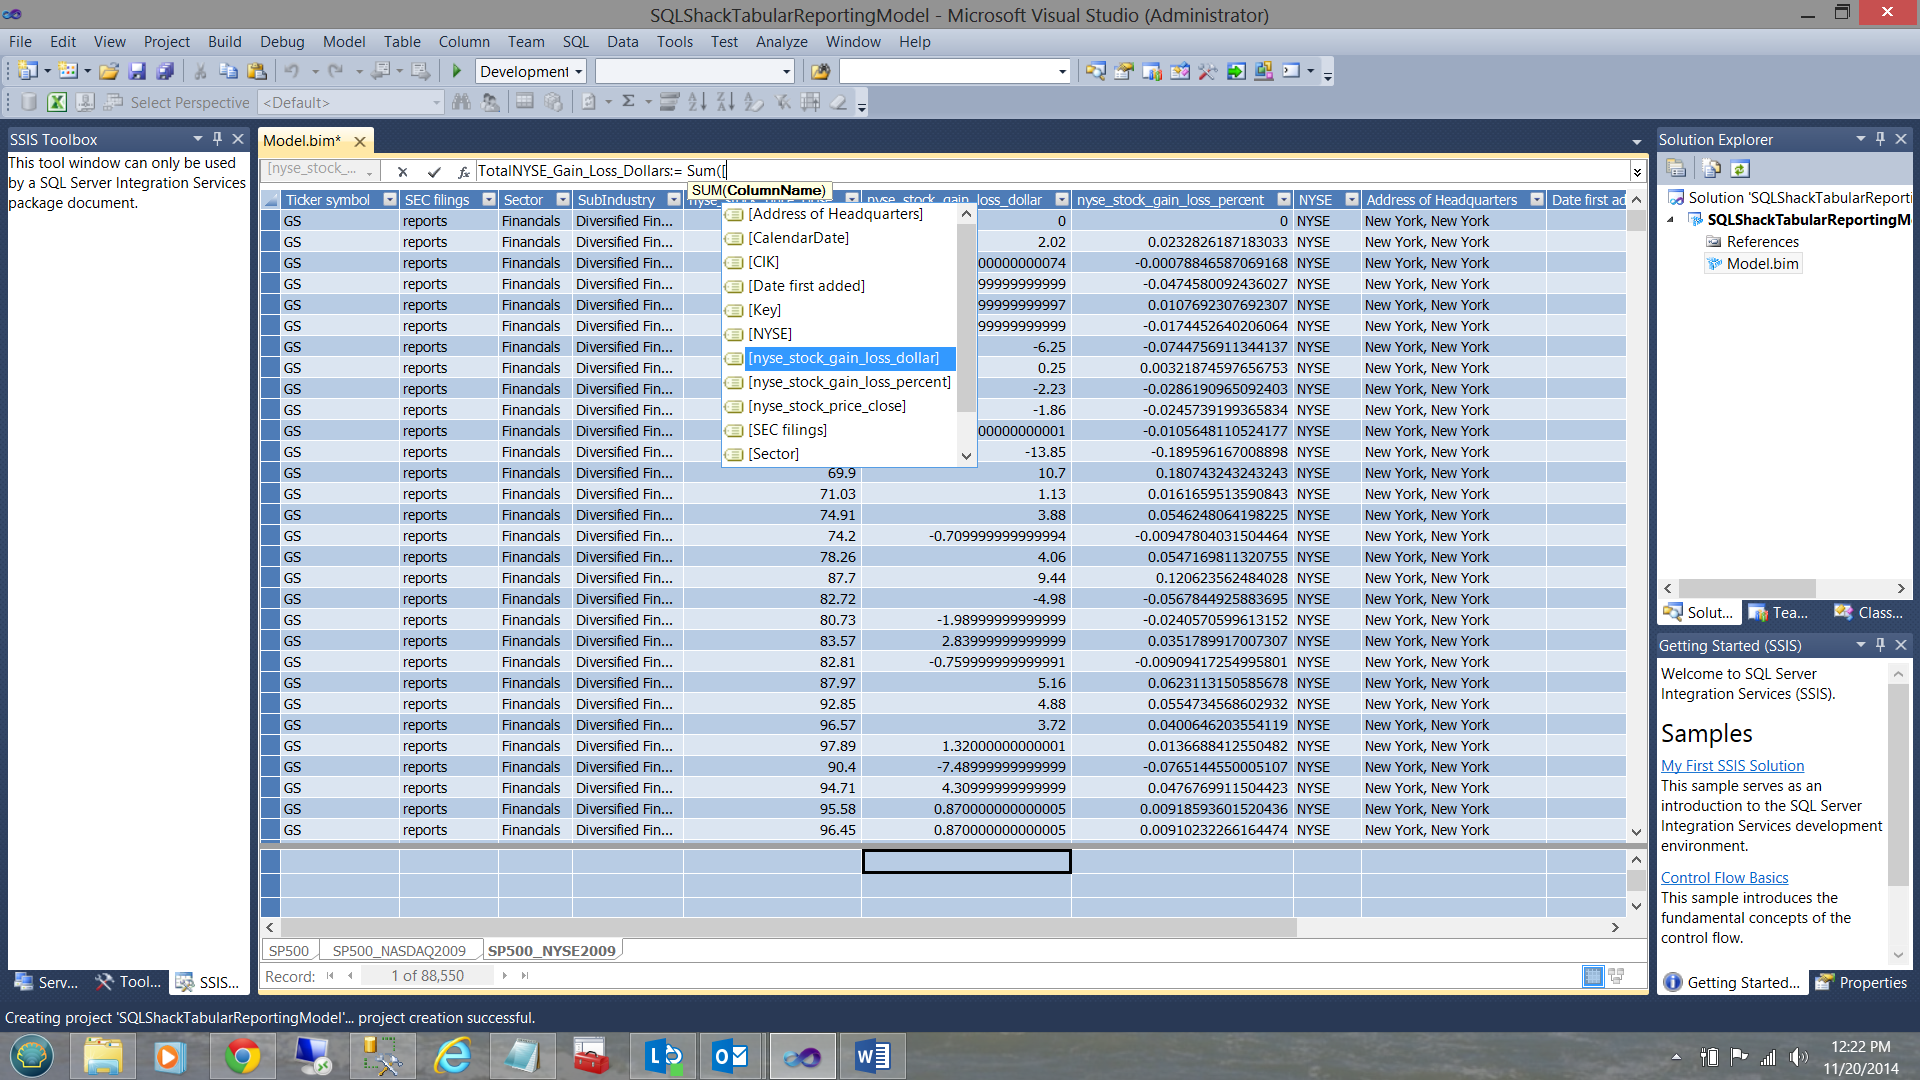
The measures for ‘NYSE_Stock_Gain_Loss_dollar’ and ‘NYSE_Stock_Gain_Loss_percent’ are shown below.
“ NYSE_Stock_Gain_Loss_perlar”和“ NYSE_Stock_Gain_Loss_percent”的度量如下所示。
An important point to emphasize is that although at first glance the column/field is merely being ‘summed’, this is NOT the case. What we are in fact looking at is a ‘cube’ and we can utilize our dimensions such as ‘sector’ and ‘sub-industries’ as slicers.
需要强调的重要一点是,尽管乍一看,列/字段只是“求和”的,但事实并非如此。 实际上,我们所看到的是一个“多维数据集”,我们可以将诸如“部门”和“子行业”之类的维度用作切片器。
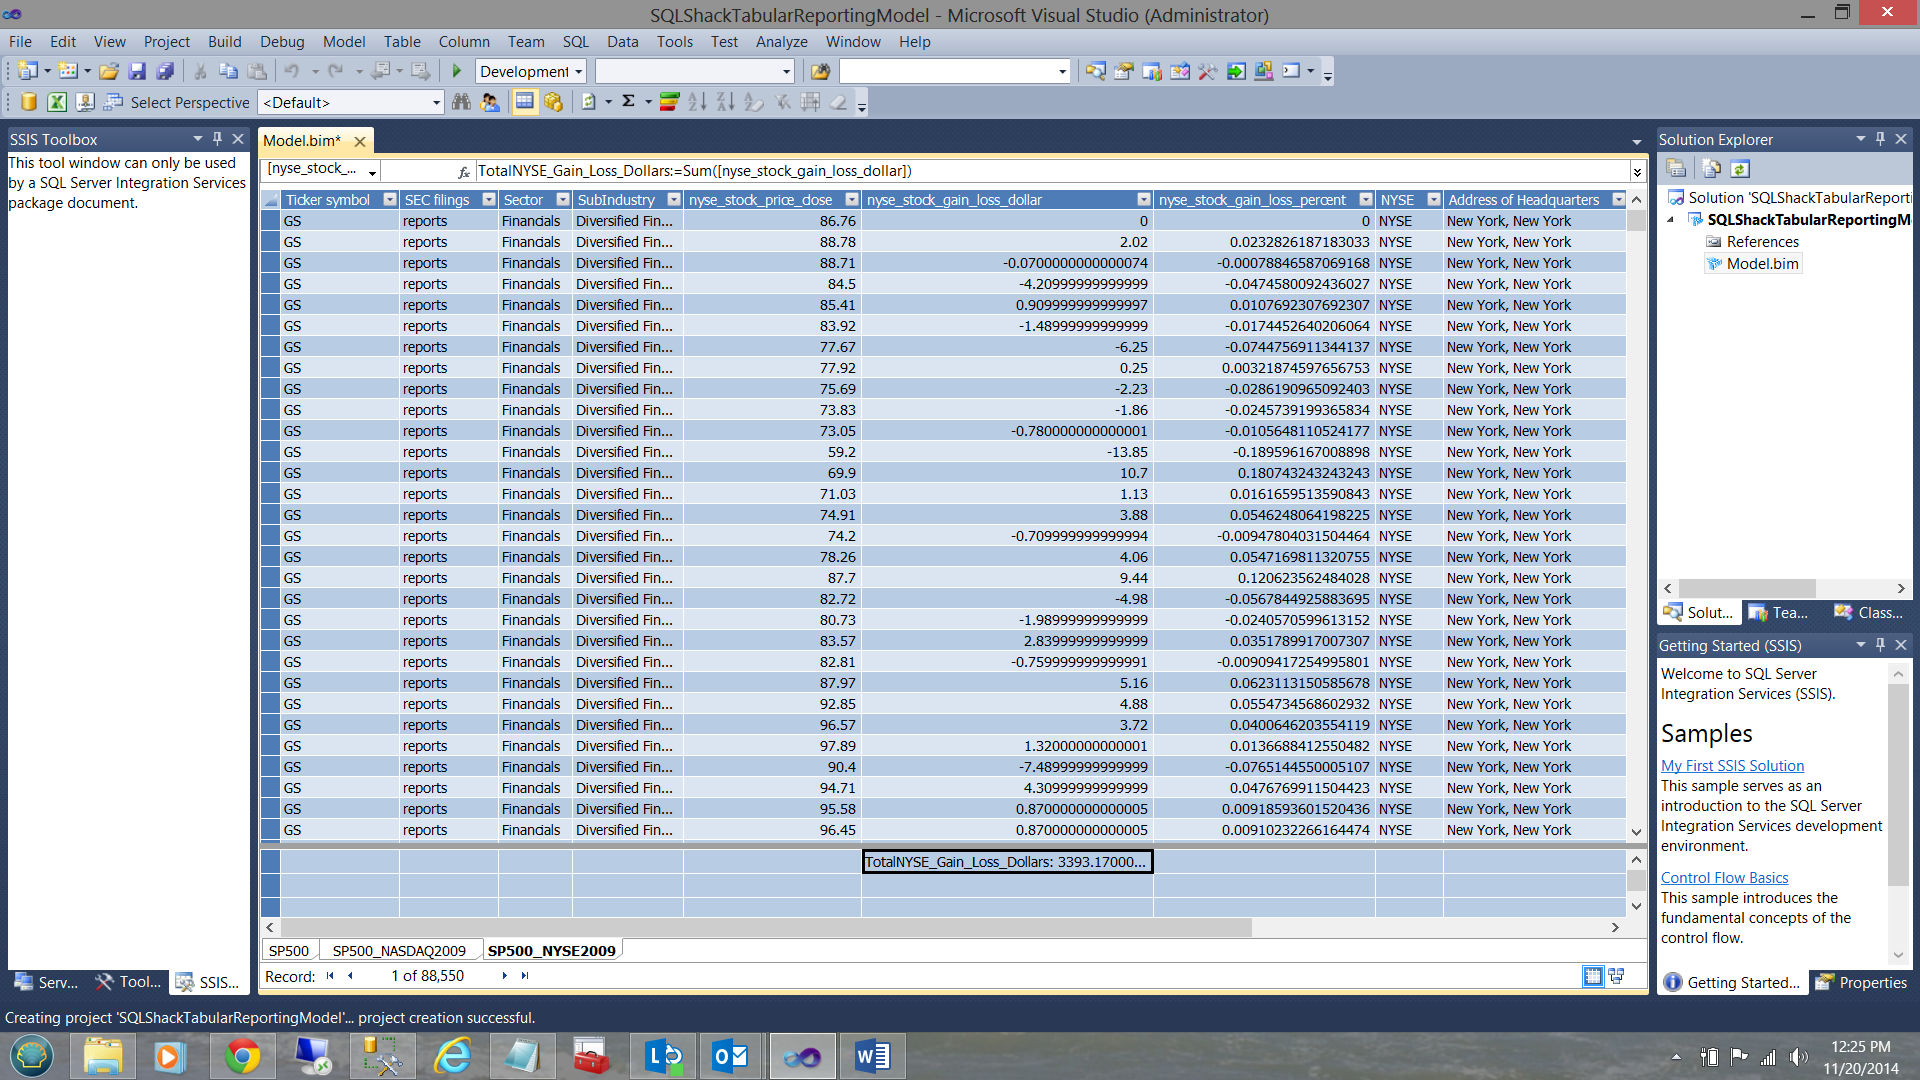
The completed total calculation may be seen below:
完成的总计计算如下所示:
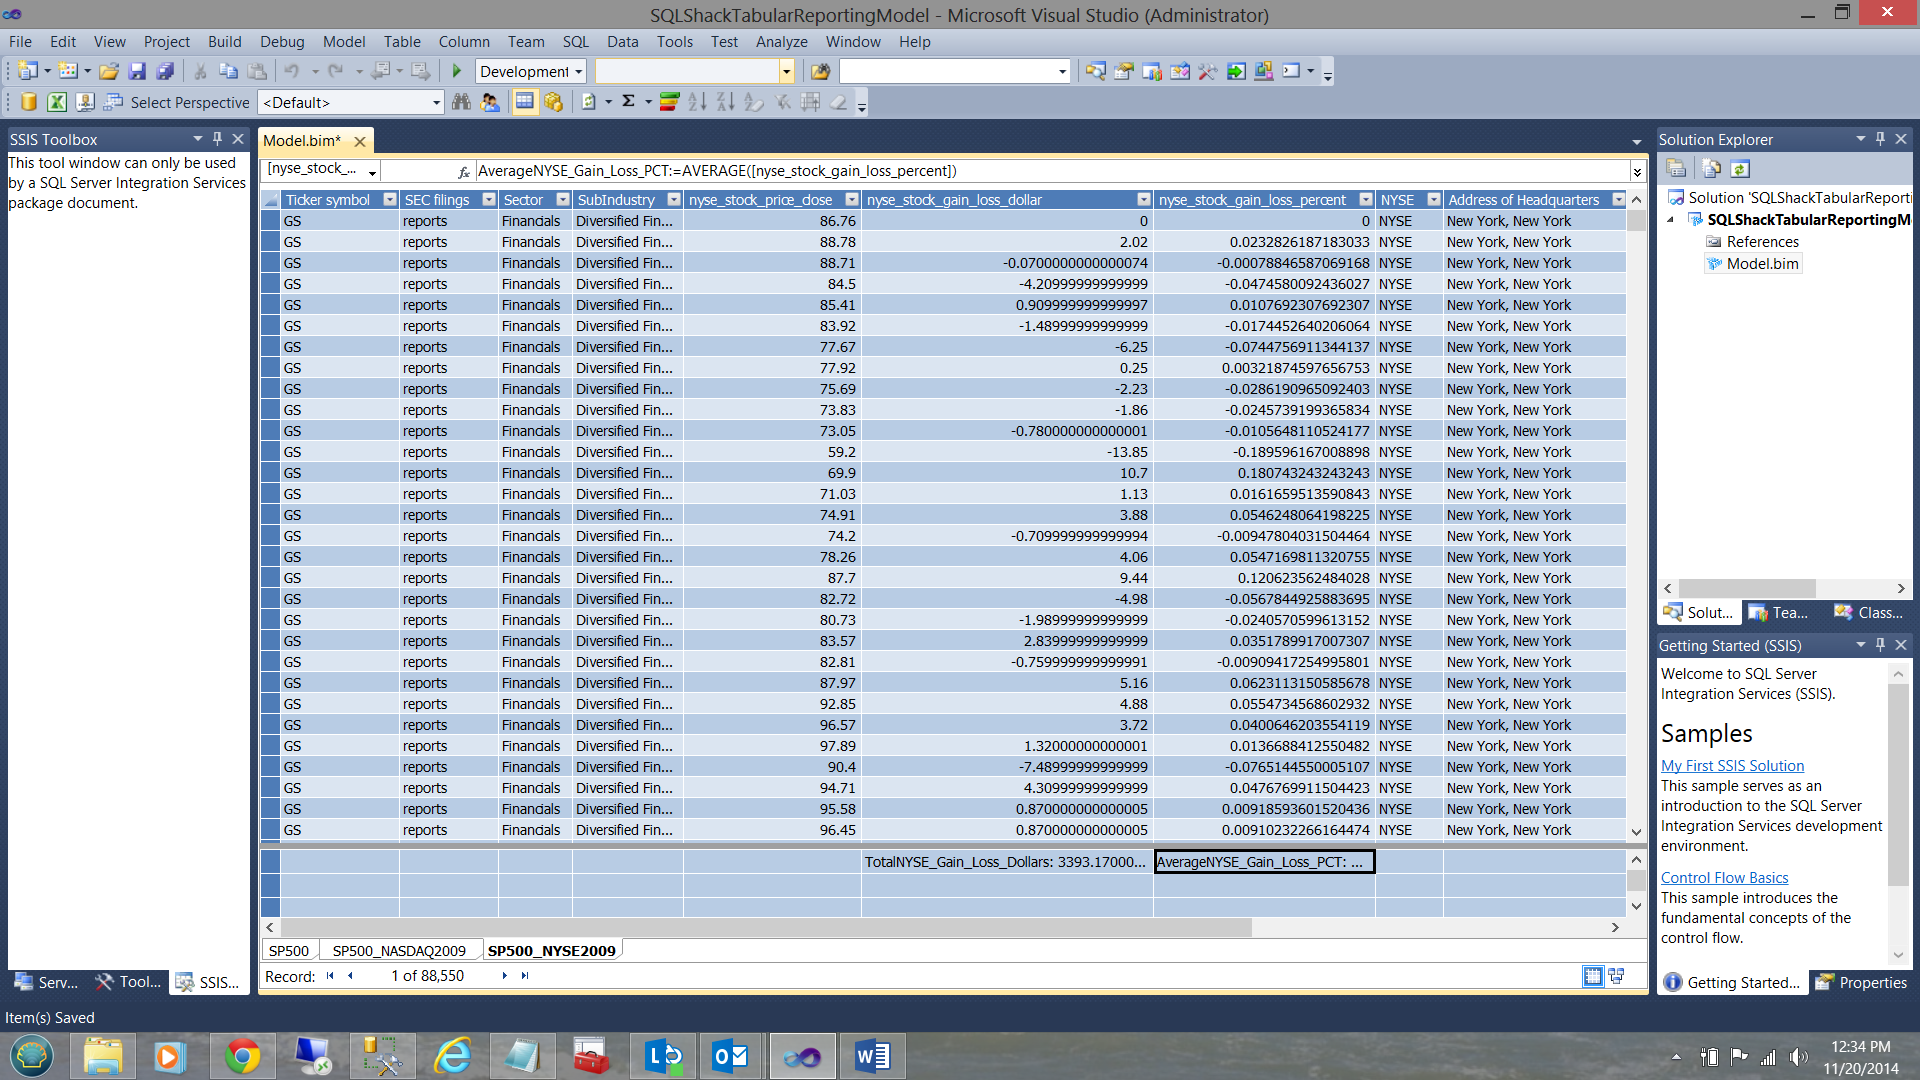
In a similar manner the ‘AVERAGENYSE_Stock_Gain_Loss_Pct ‘field is created (see below).
以类似的方式创建“ AVERAGENYSE_Stock_Gain_Loss_Pct”字段(请参见下文)。
Using the data from the SP500_NASDAQ view we create similar totals and averages (see below).
使用SP500_NASDAQ视图中的数据,我们可以创建相似的总计和平均值(请参见下文)。
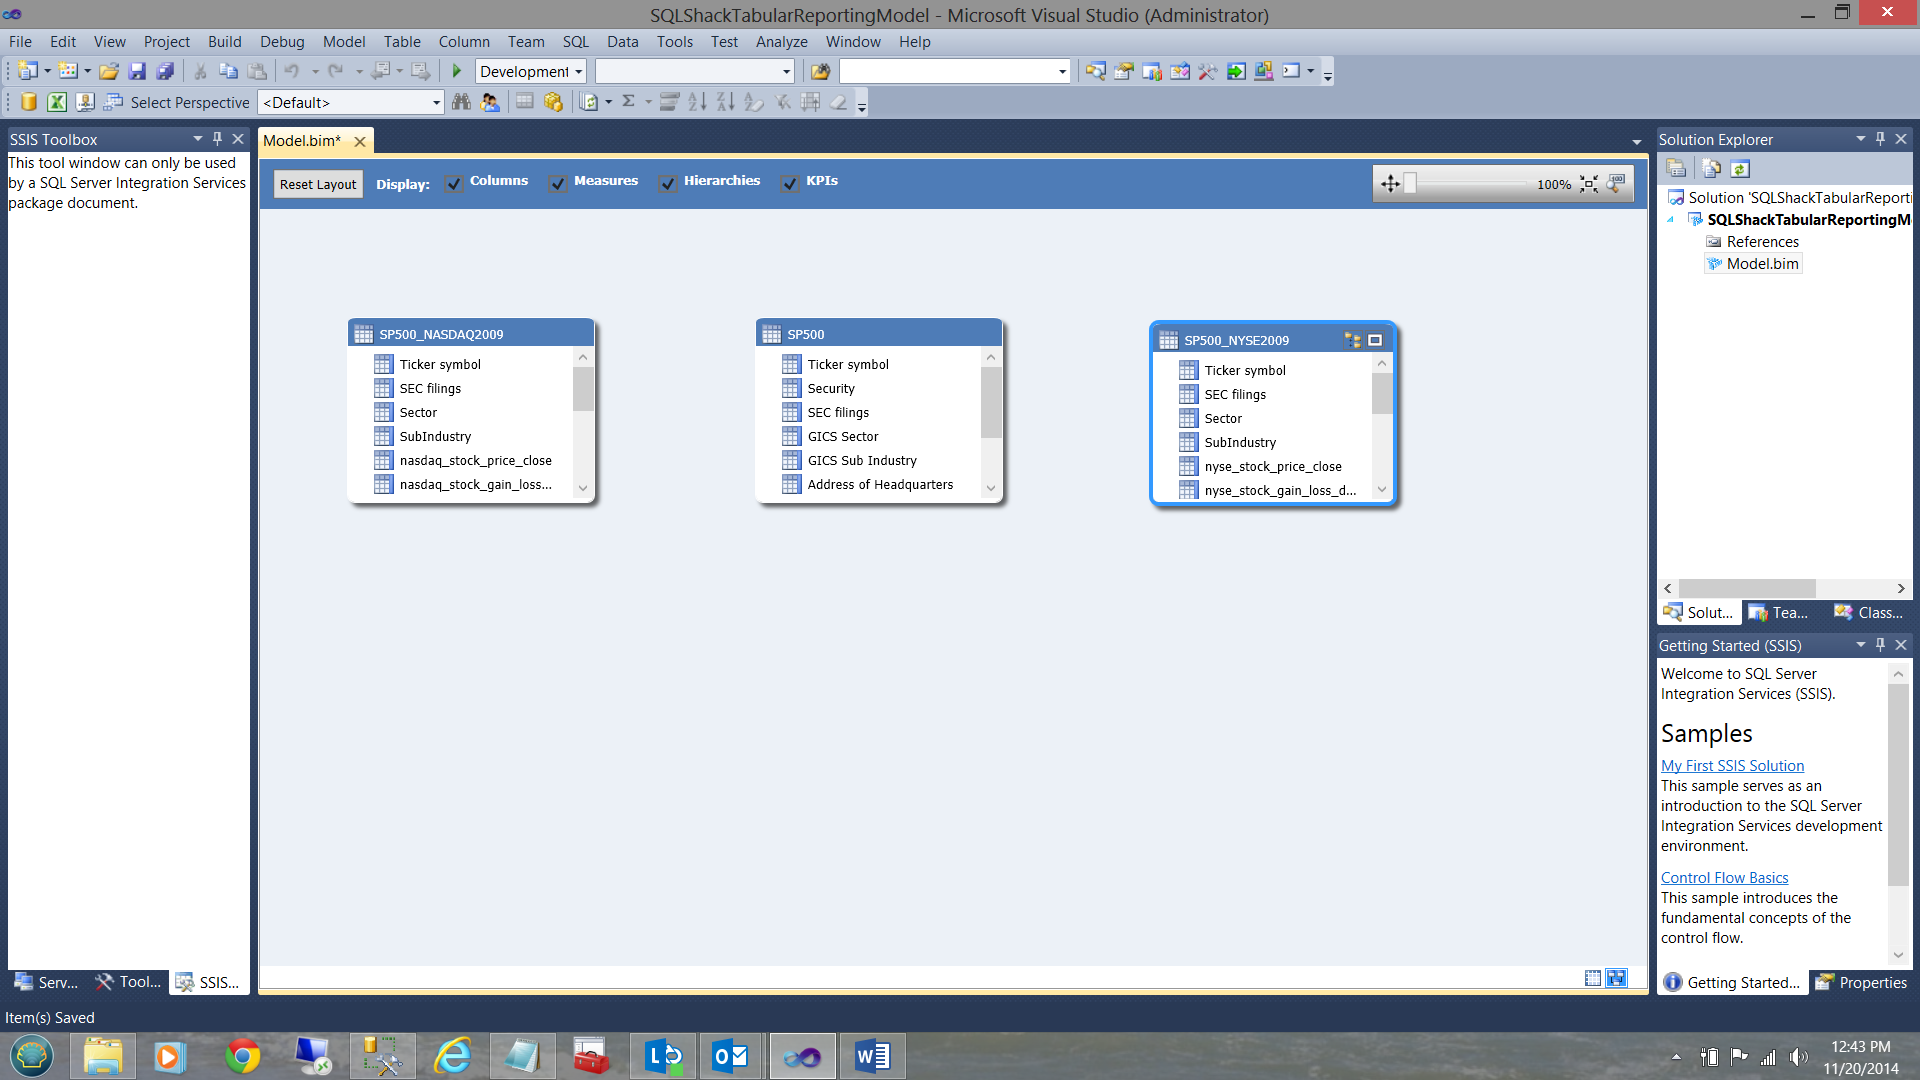
Switching over to the relational view (by clicking the icon of ‘three small square boxes’ on the bottom right hand side of the screen containing the grid), we find our ‘Relational’ view.
切换到关系视图(通过单击包含网格的屏幕右下角的“三个小方框”图标),我们找到了“关系”视图。
在表/视图之间创建关系 (Creating relationships between the table/views)
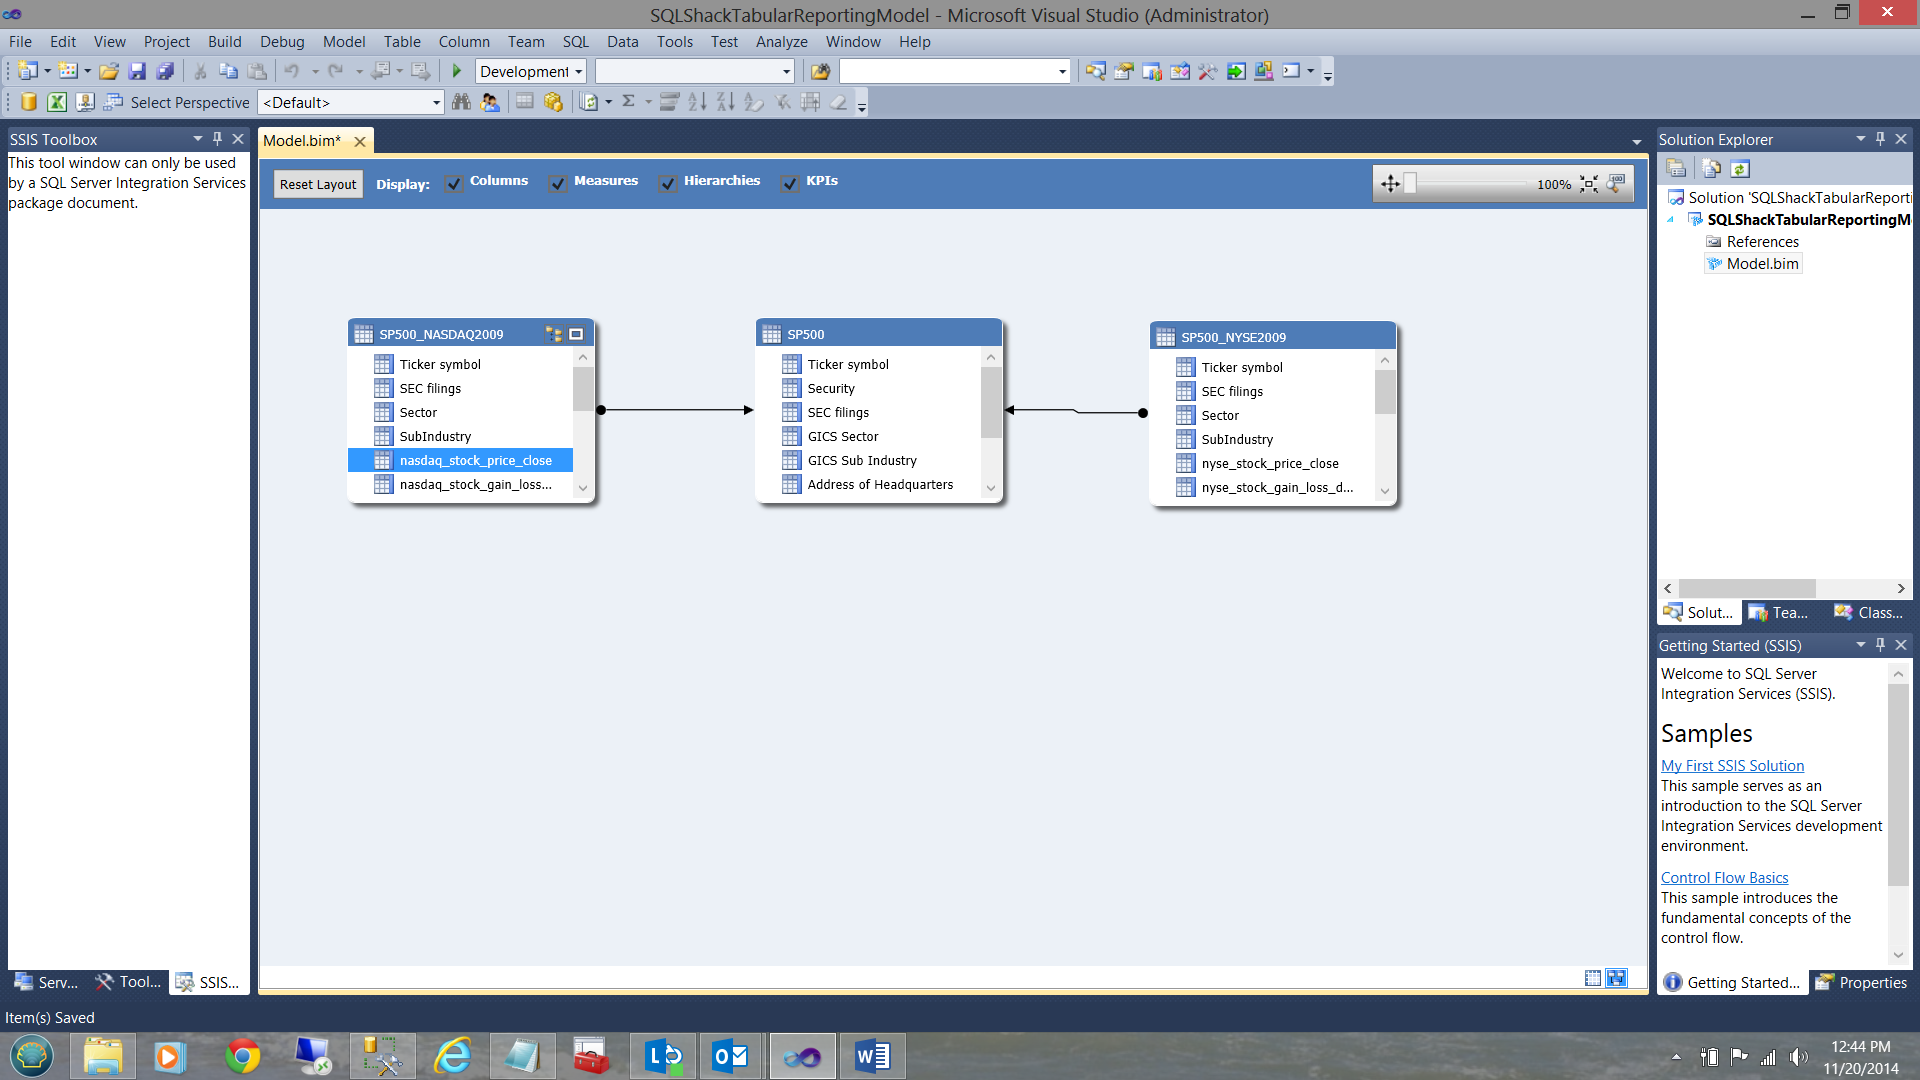
We now ‘join’ the ticker symbol from the SP500 table to the ticker symbol in the SP500 – NYSE2009 view AND link the ticker symbol from the SP500 table to the ticker symbol in the SP500 – NASDAQ view (see below)
现在,我们将SP500表中的股票代号“联接”到SP500 – NYSE2009视图中的股票代号,并将SP500表中的股票代号链接到SP500 – NASDAQ视图中的股票代号(请参见下文)
The reader will note that in each of the tables / views (shown above), that there is a ‘sector’ and ‘sub-industry’ field. Sectors have ‘babies’ called sub-industries. What we need to do is to create a hierarchy on each of the tables / views (shown above) shown above.
读者会注意到,在每个表/视图(如上所示)中,都有一个“部门”和“子行业”字段。 部门有被称为子行业的“婴儿”。 我们需要做的是在上面显示的每个表/视图(如上所示)上创建一个层次结构。
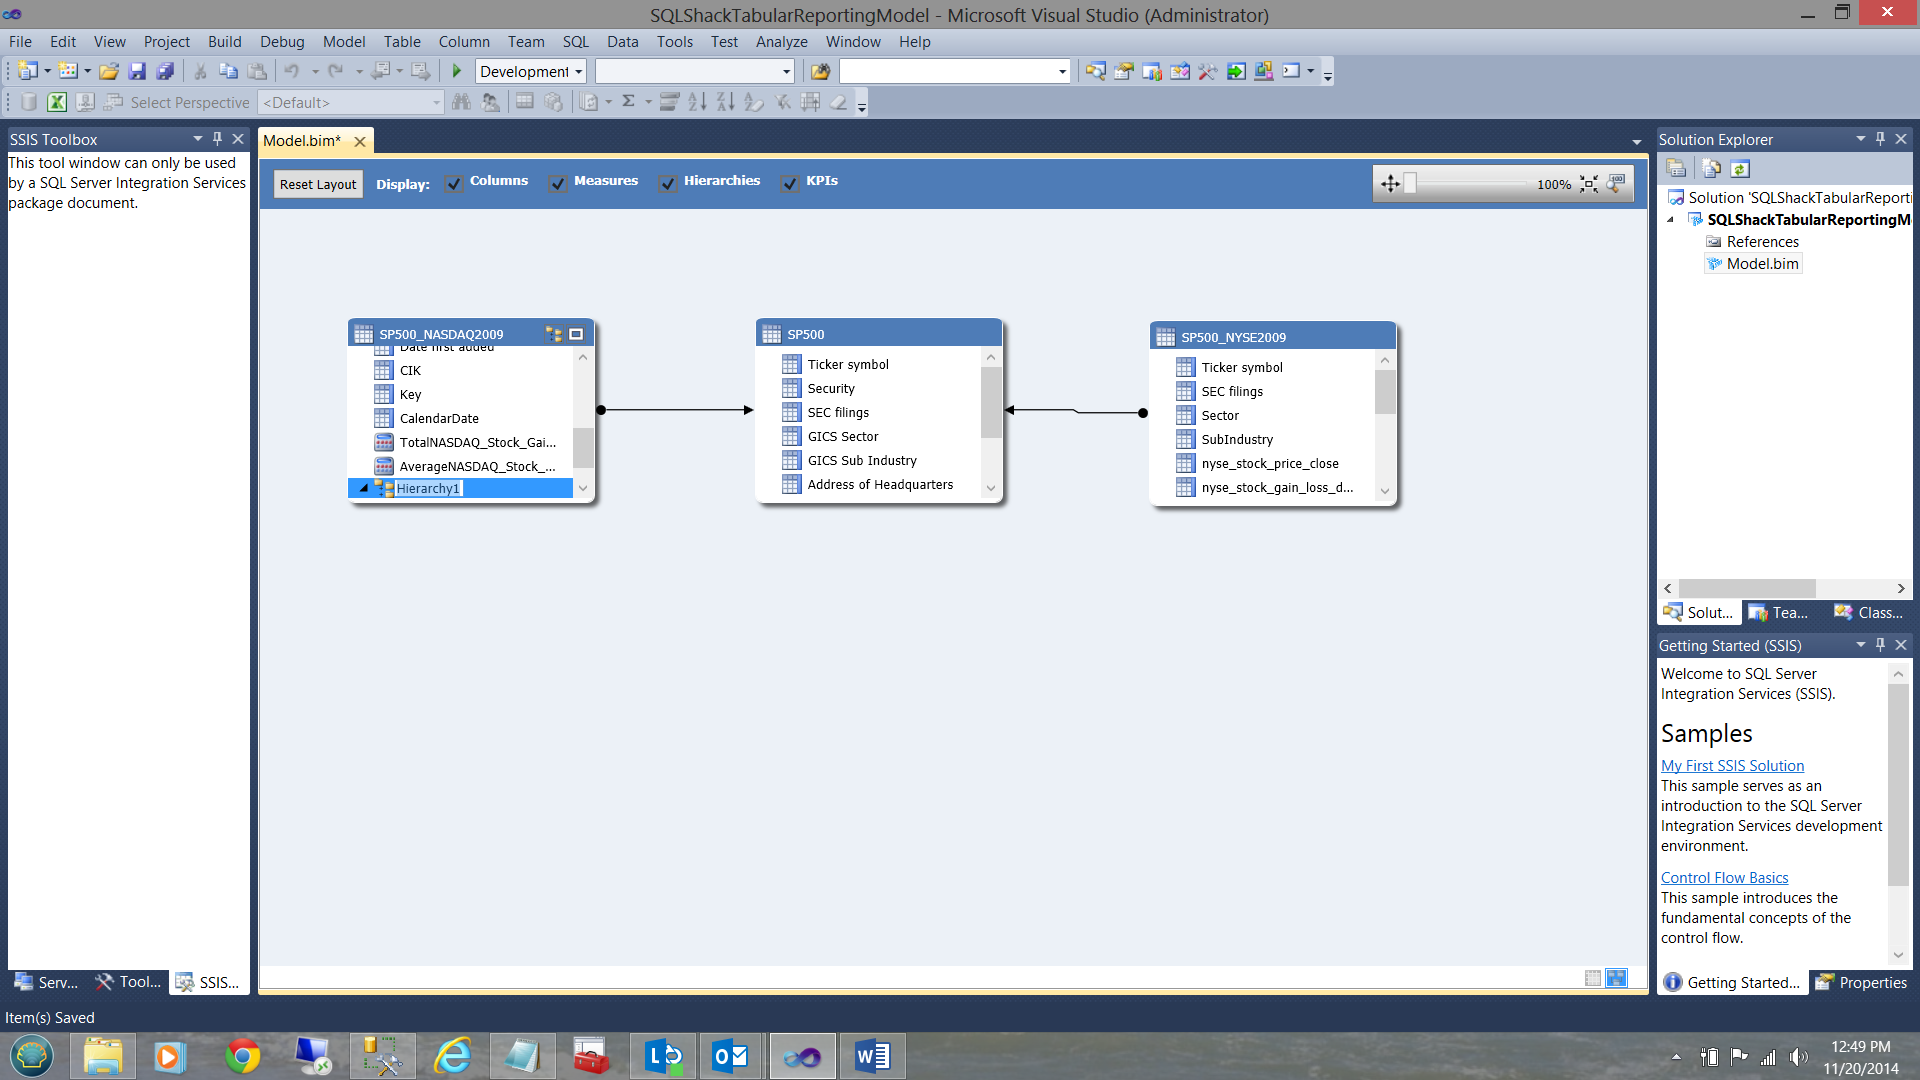
We first right click on the SP500-NASDAQ entity. The context menu appears.
我们首先右键单击SP500-NASDAQ实体。 出现上下文菜单。
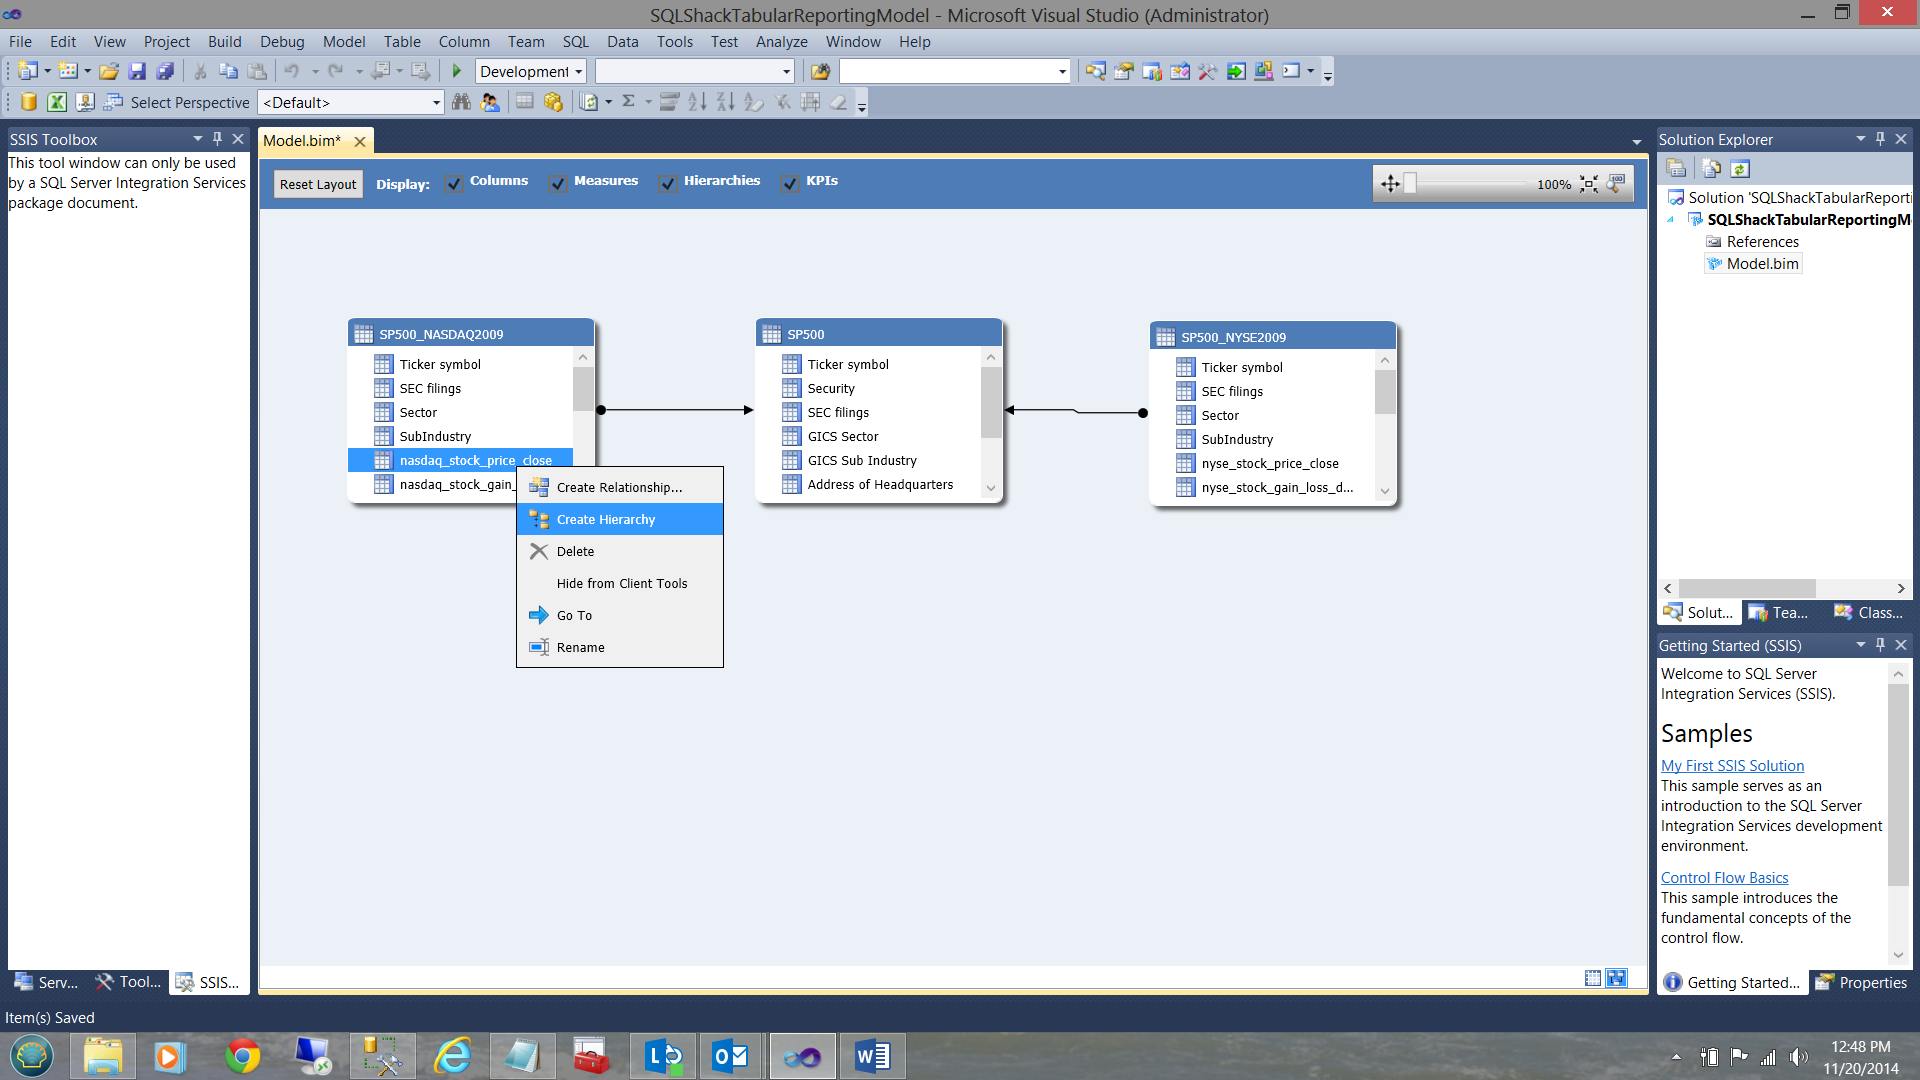
I choose ‘Create Hierarchy’. Note that a ‘hierarchy’ has been established in the screen dump below:
我选择“创建层次结构”。 请注意,下面的屏幕转储中已建立了“层次结构”:
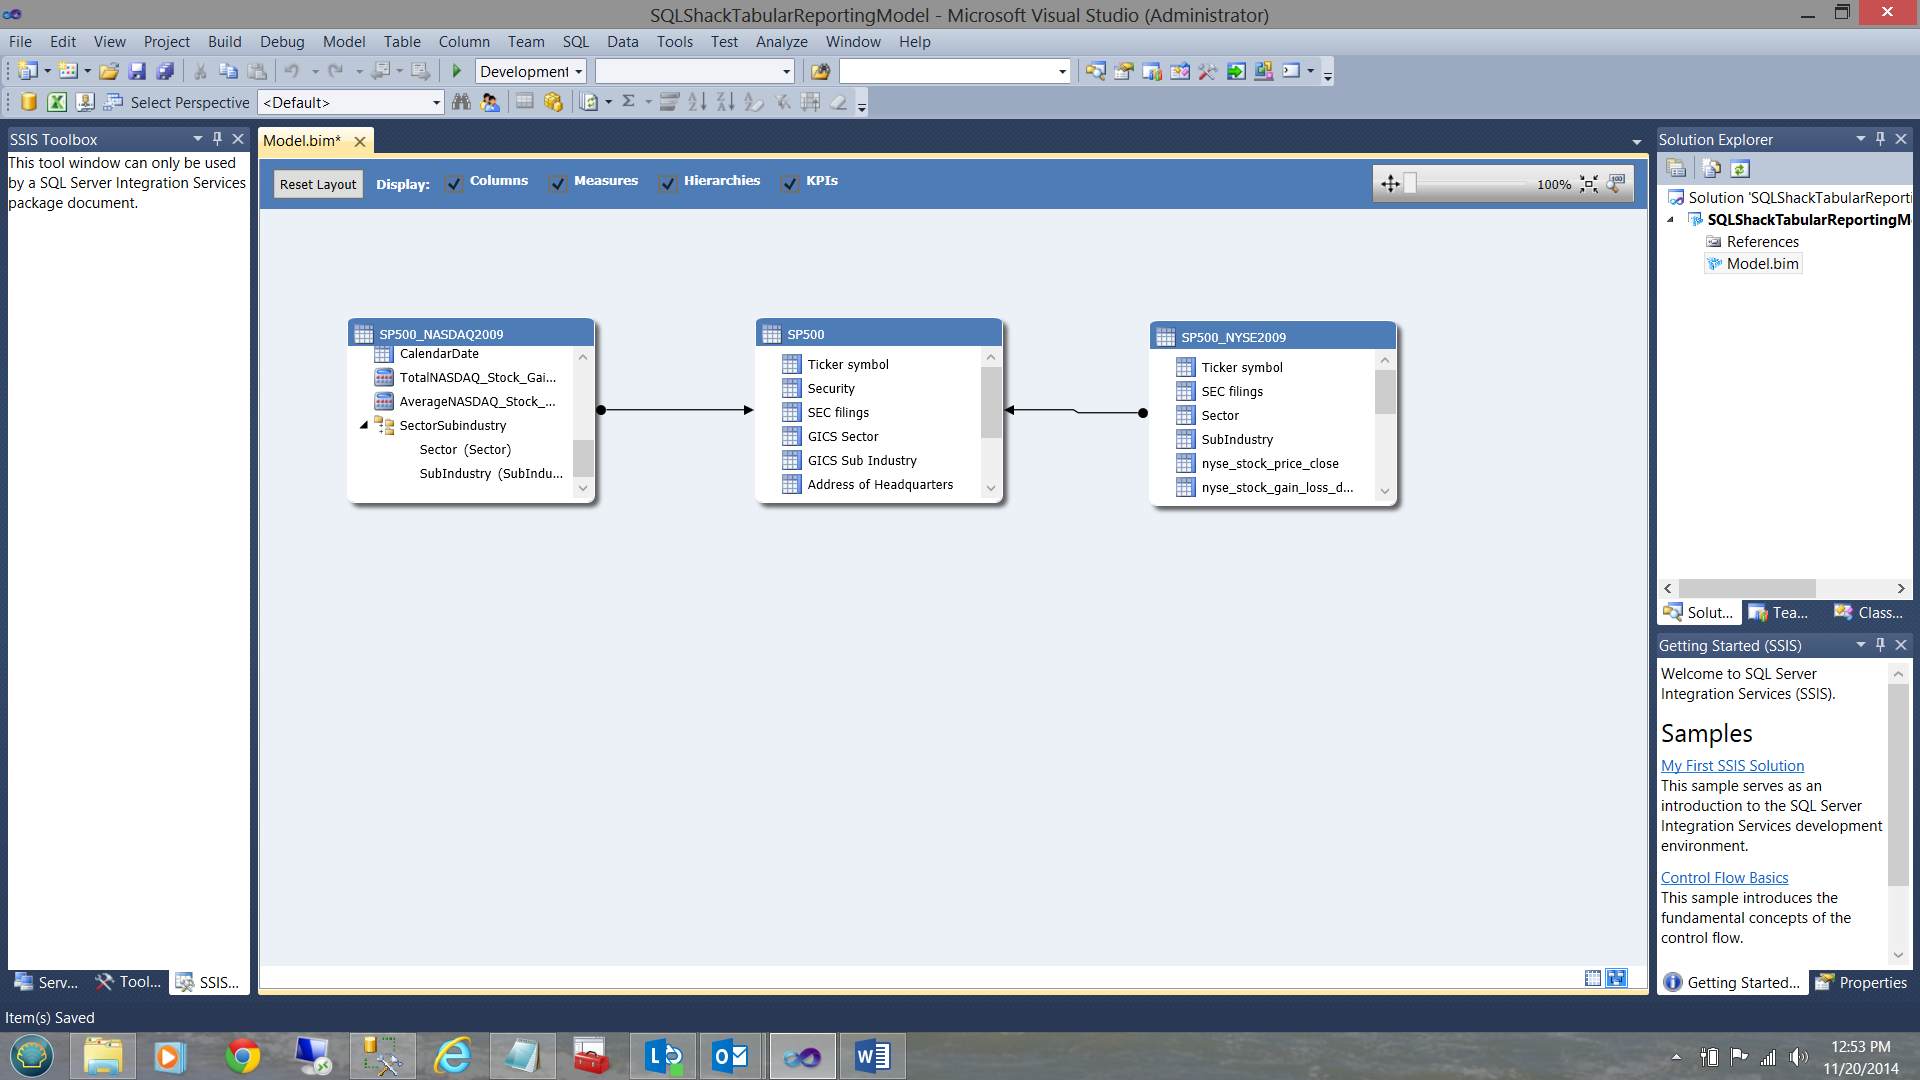
I rename the hierarchy and drag the sector and sub-industry fields into the hierarchy (see below).
我重命名层次结构,然后将行业和子行业字段拖到层次结构中(请参见下文)。
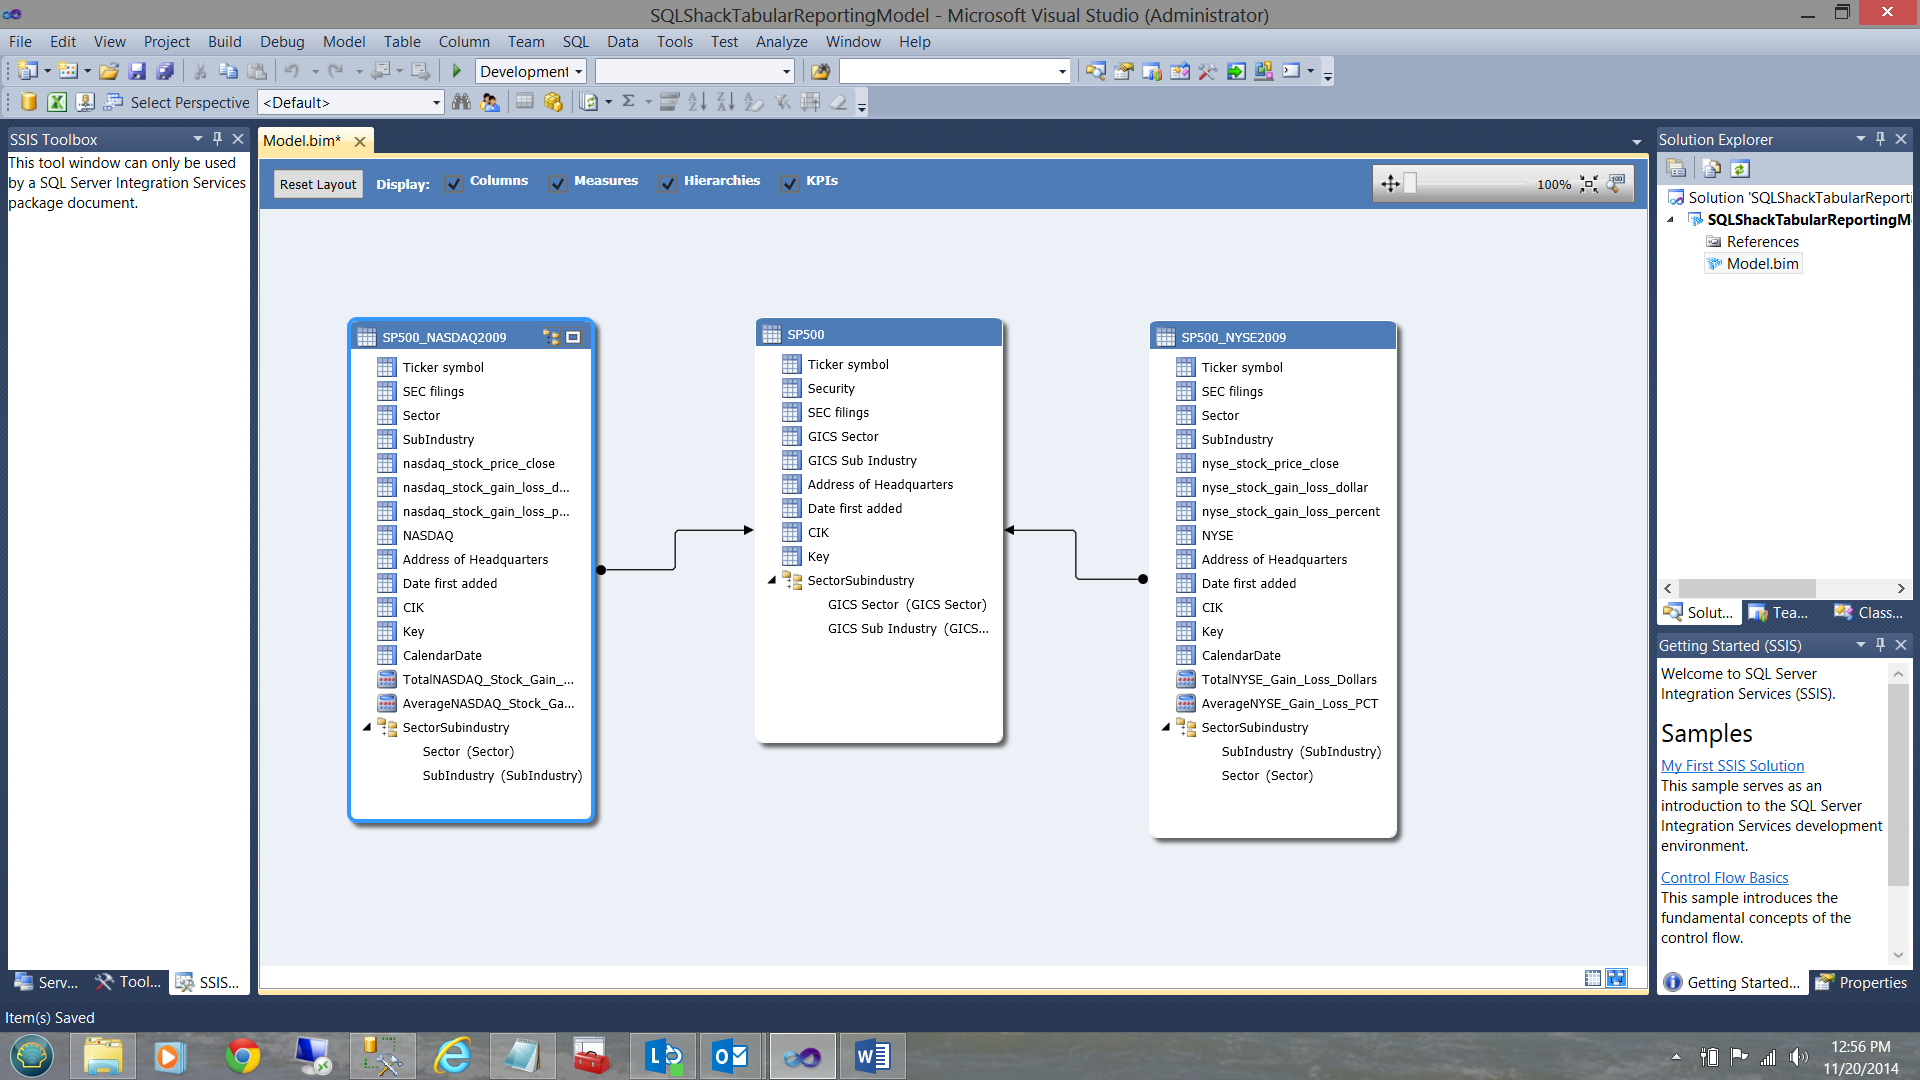
In a similar manner, I create the hierarchy for the SP500 entity and for the SP500-NYSE2009 entity (see below).
以类似的方式,我为SP500实体和SP500-NYSE2009实体(请参见下文)创建层次结构。
We are now ready to deploy our project.
现在,我们准备部署我们的项目。
部署我们的项目 (Deploying our project)
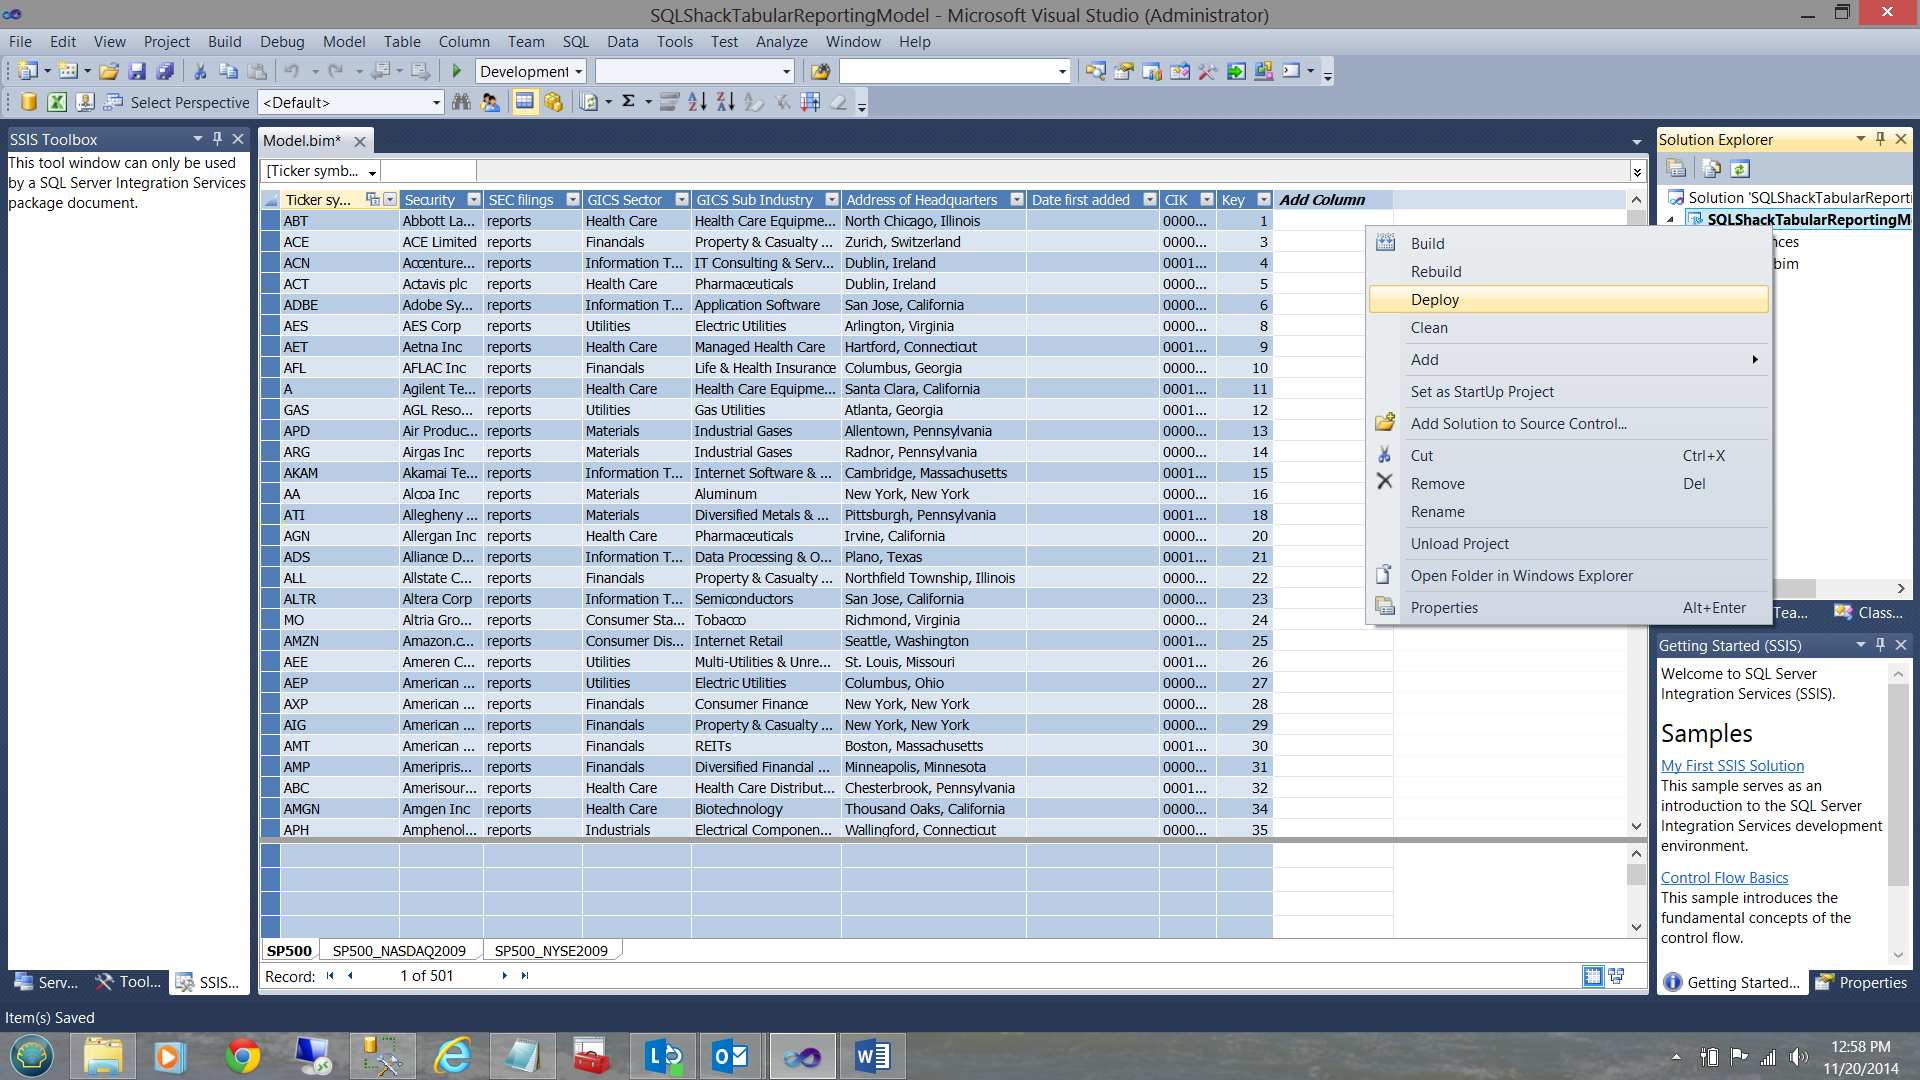
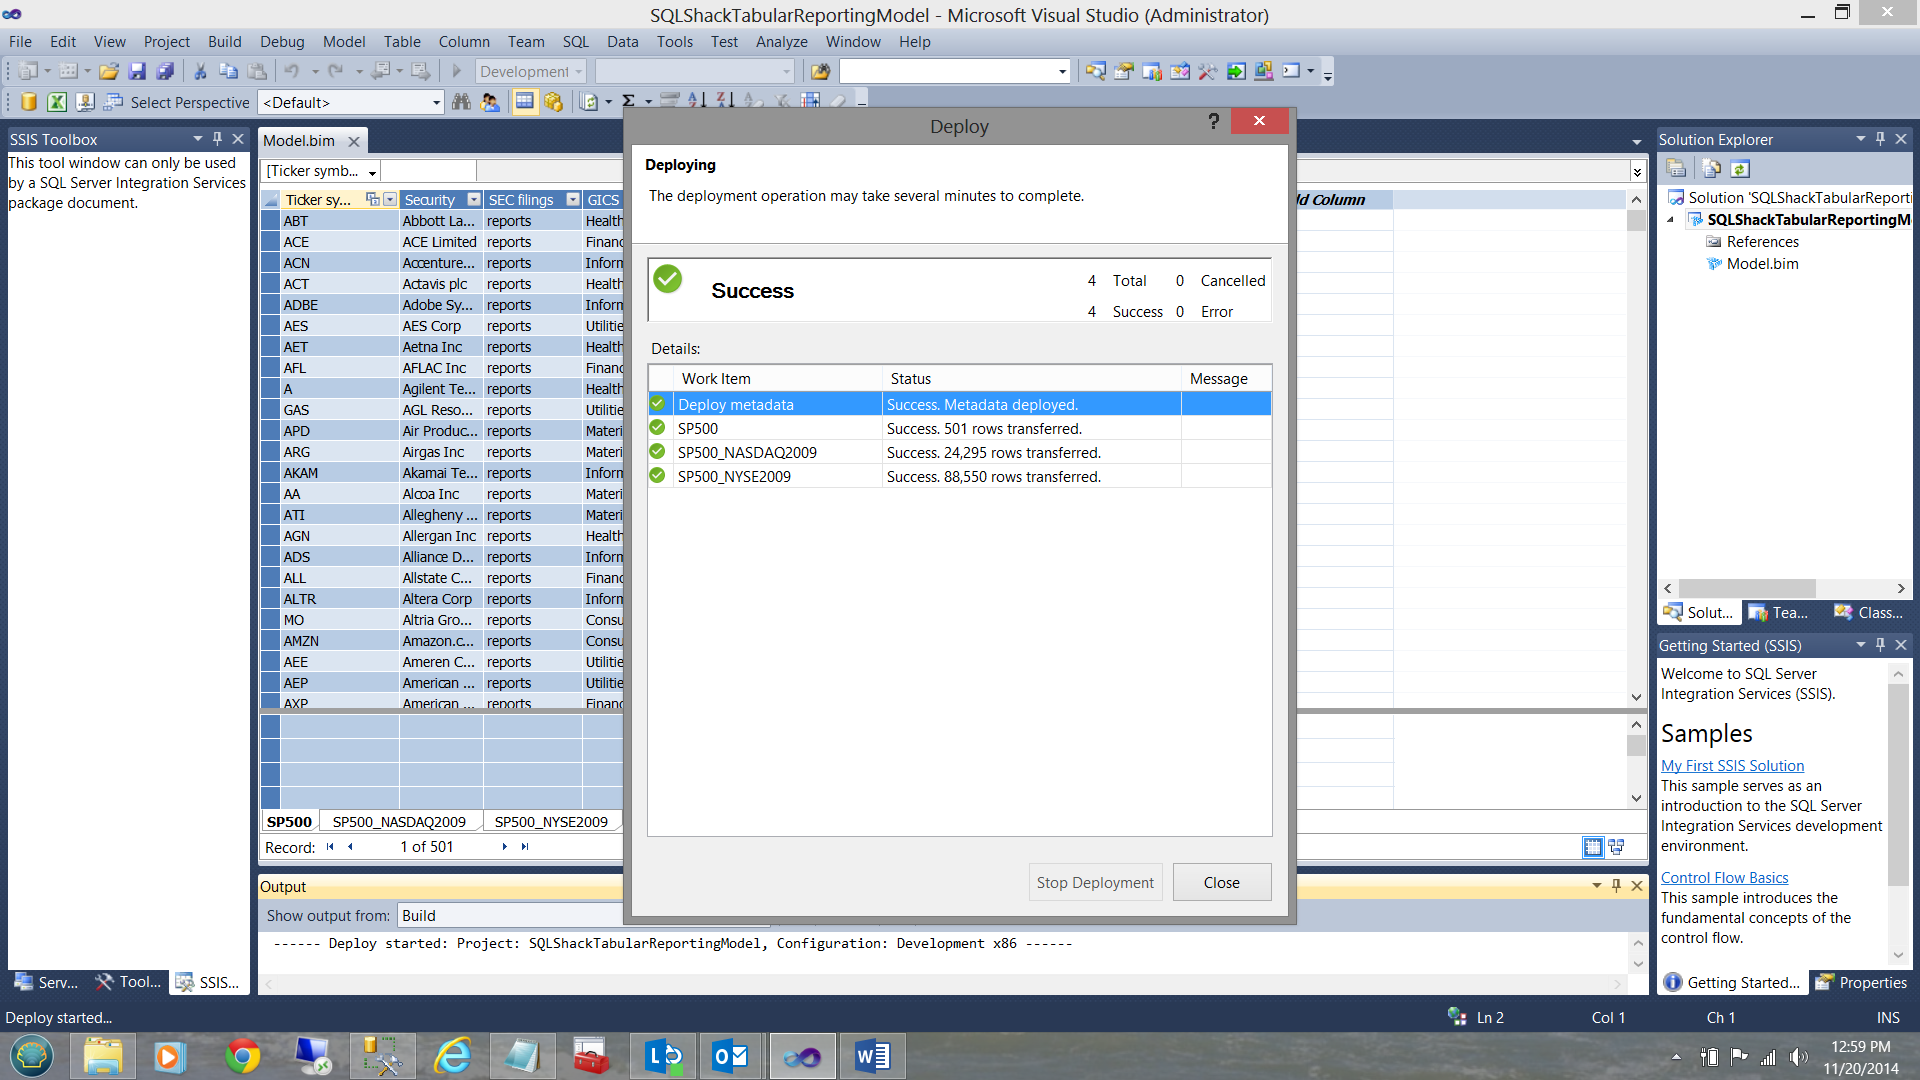
I right click on the ‘SQLShackTabularReportingModel’ and select deploy (see above). Upon successful completion of the deployment, you should receive a screen similar to the one shown below:
我右键单击“ SQLShackTabularReportingModel”,然后选择部署(请参见上文)。 成功完成部署后,您将收到类似于以下所示的屏幕:
Our work here is now complete. Let us see what we have done!
现在我们的工作已经完成。 让我们看看我们做了什么!
同时返回Analysis Services (Meanwhile back in Analysis Services)
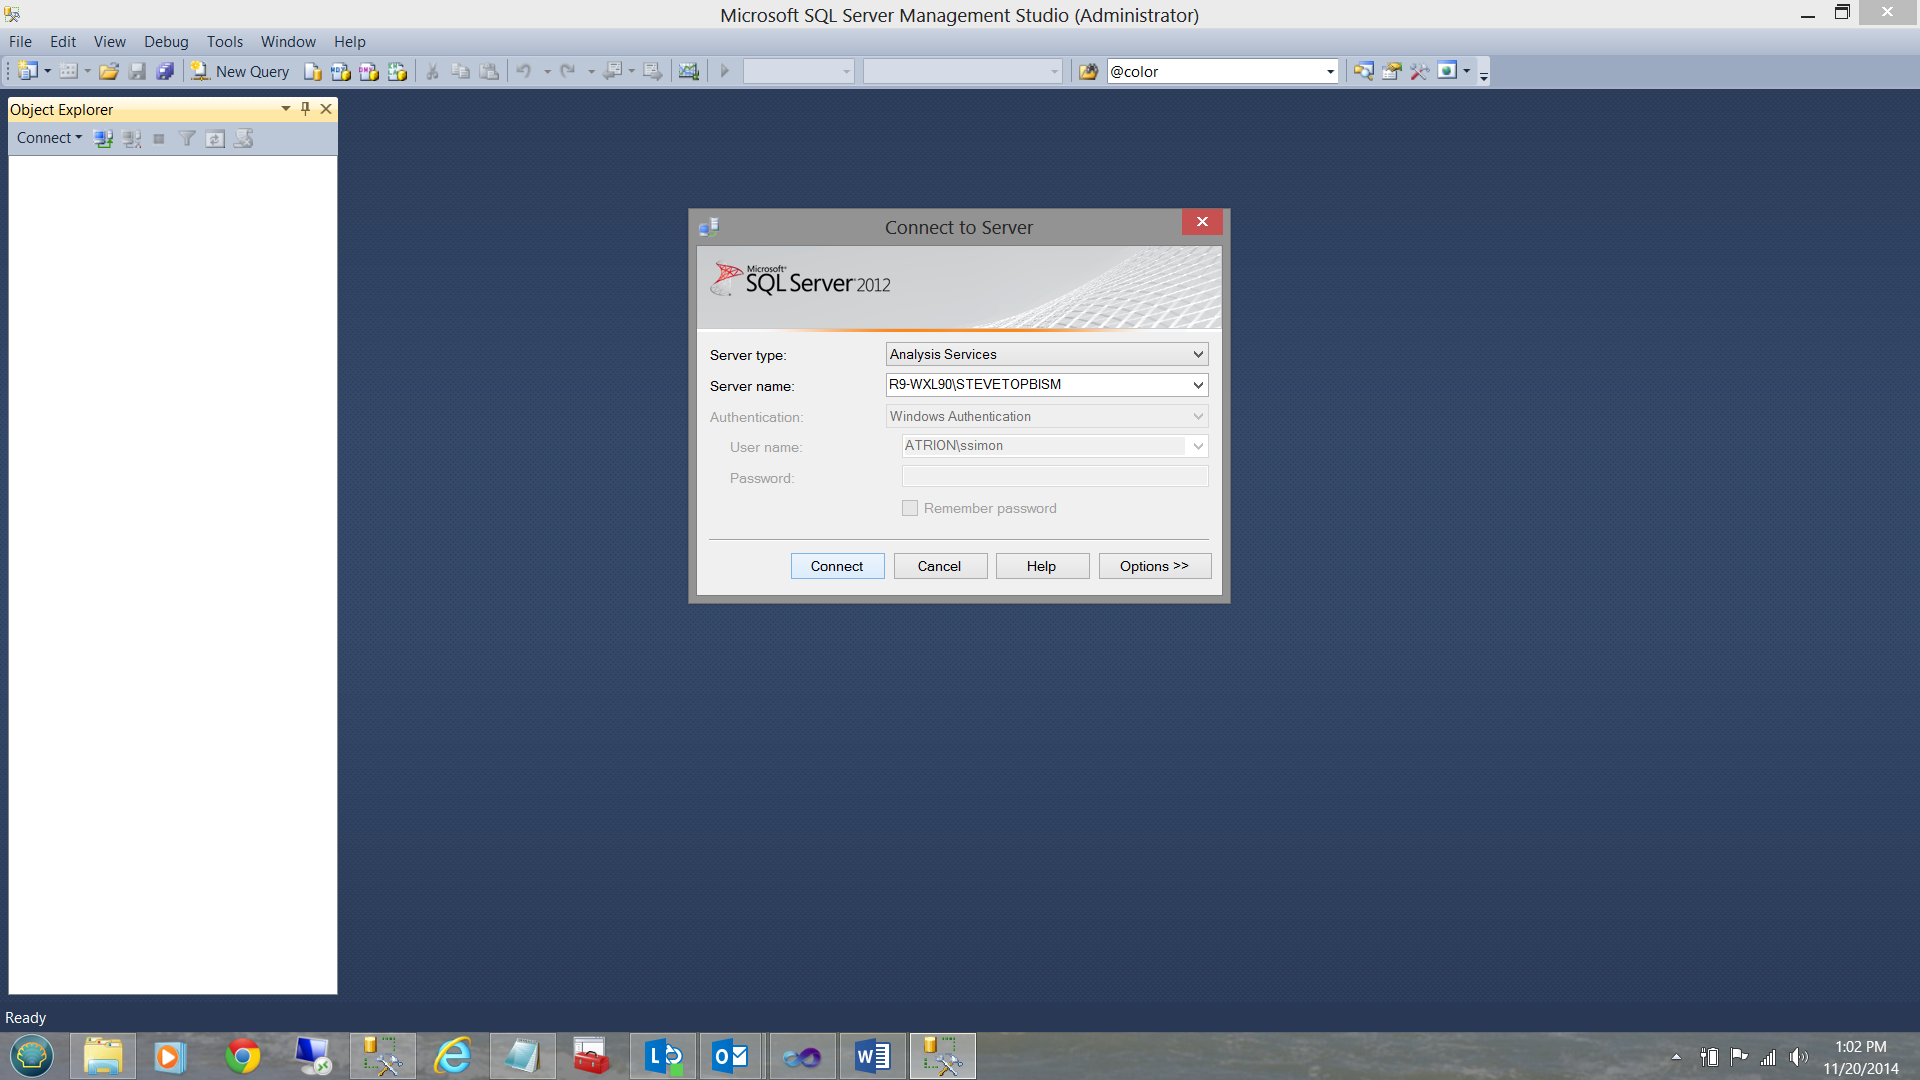
In order to have a quick look at what we have just created, we bring up Analysis Services.
为了快速了解我们刚刚创建的内容,我们启用了Analysis Services。
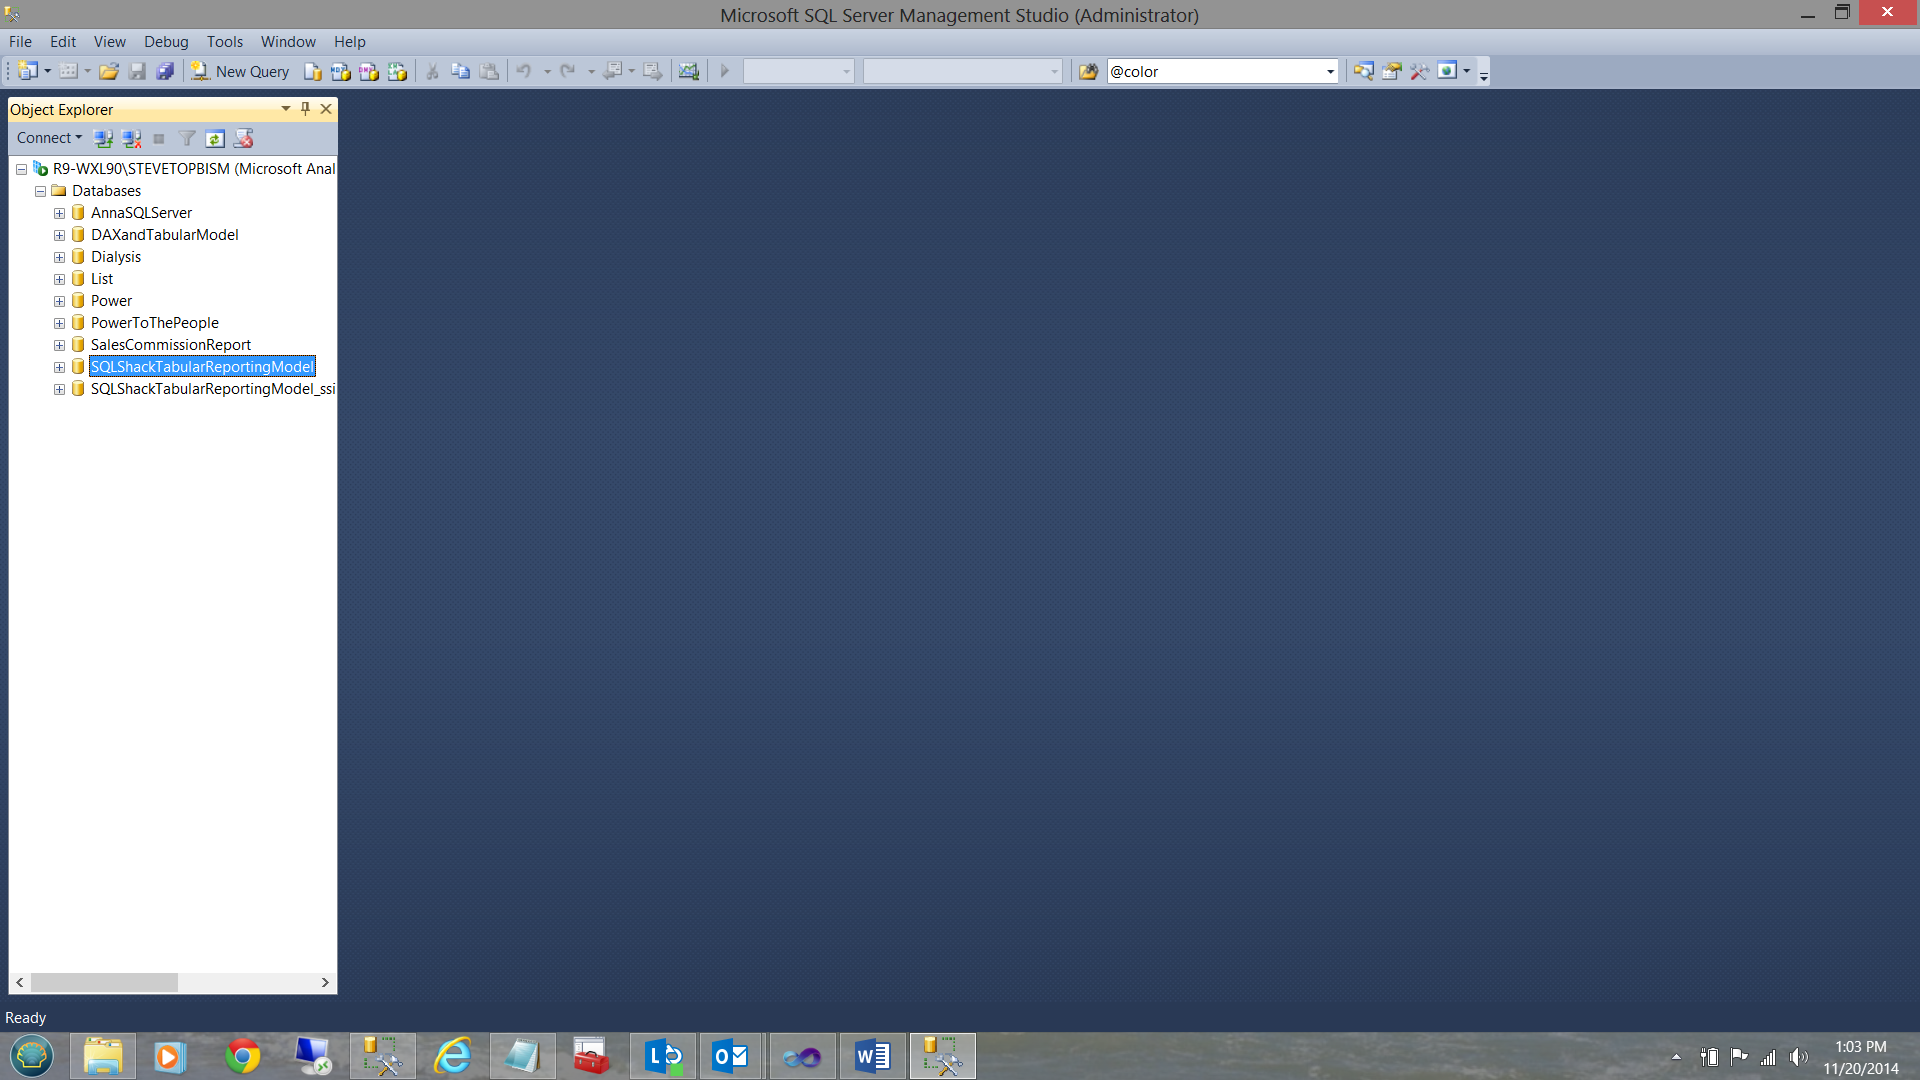
Once in Analysis Services, we can see the database that we just created.
进入Analysis Services后,我们可以看到刚刚创建的数据库。
Now that we know that our deployment was successful, we are now ready to create a few reports!
现在我们知道我们的部署已成功,现在我们准备创建一些报告!
The proof of the pudding is in the eating!
As mentioned within the introduction, our client utilized Excel as a GUI. With this in mind, our reporting today will be via Excel.
如简介中所述,我们的客户使用Excel作为GUI。 考虑到这一点,我们今天的报告将通过Excel。
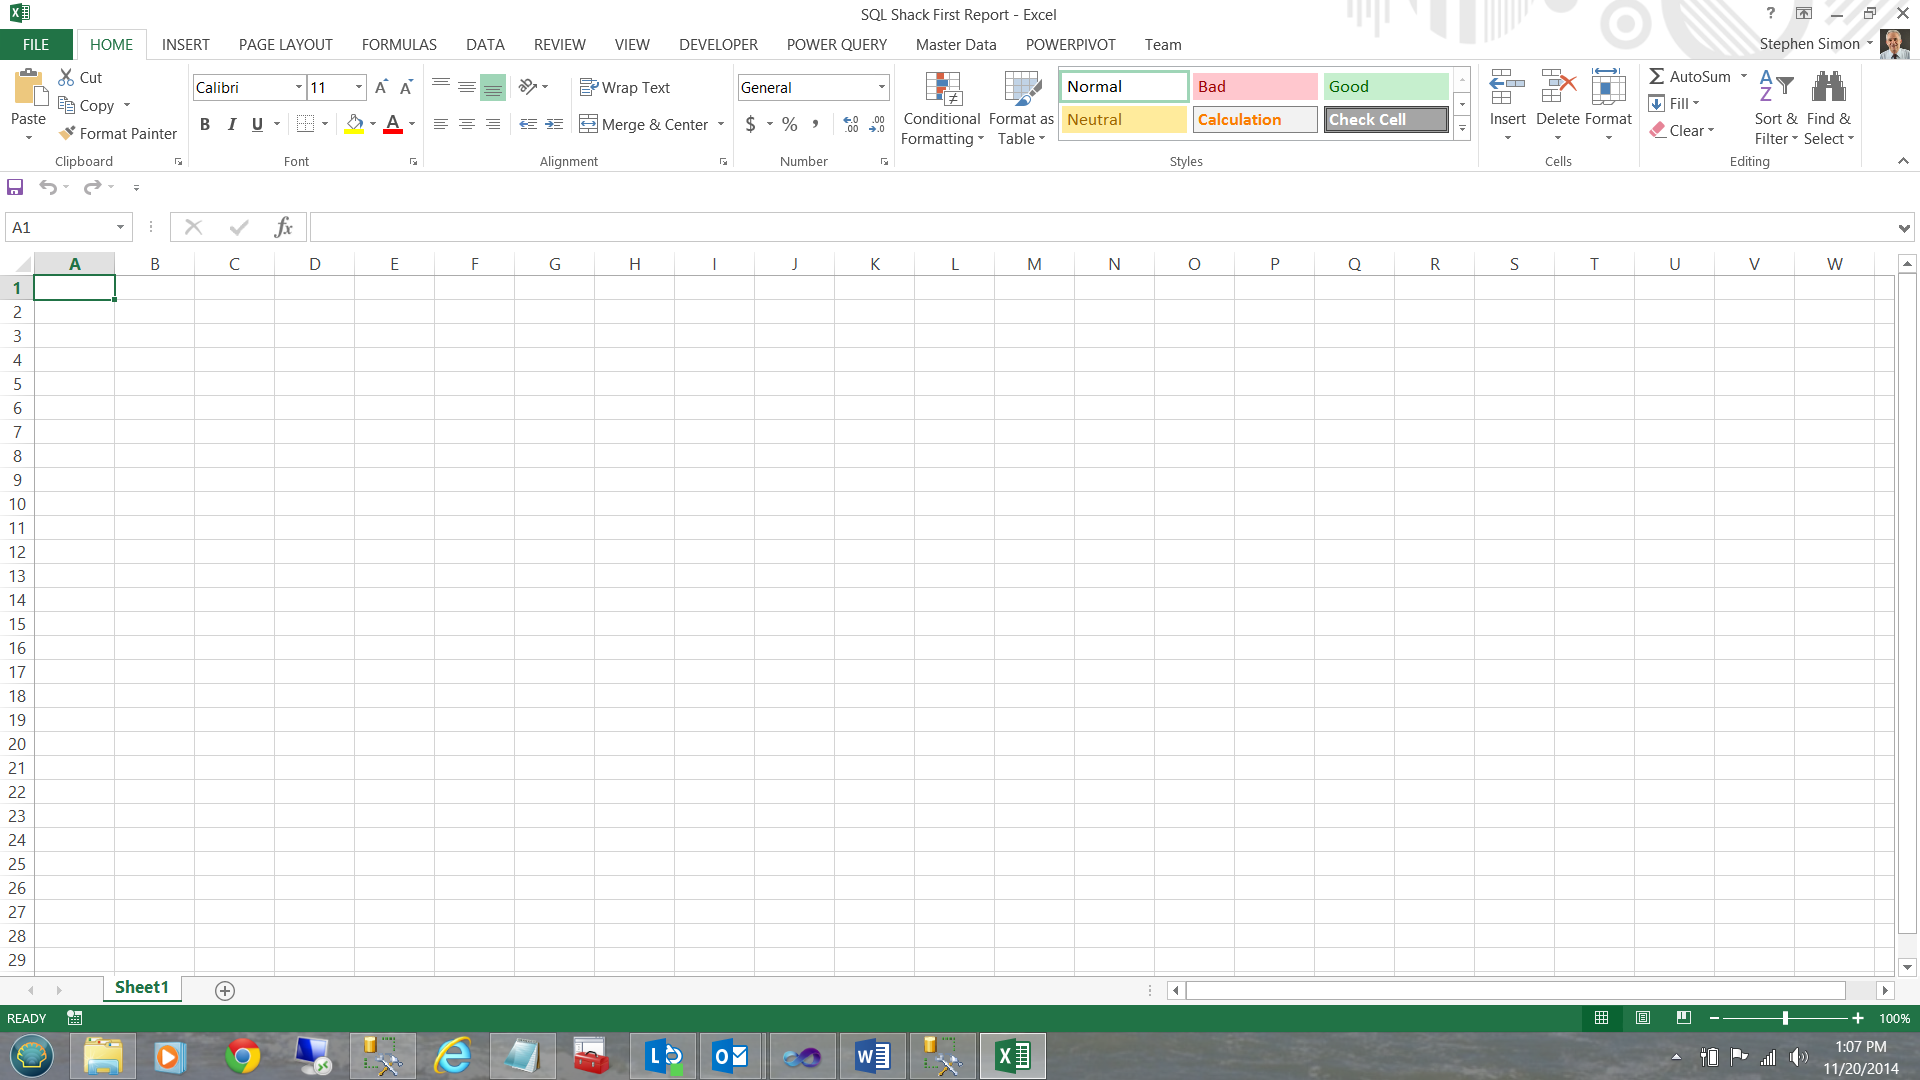
Having opened Excel we begin with a new workbook.
打开Excel后,我们从一个新的工作簿开始。
Our first task is to create a data connection to our newly created tabular model.
我们的首要任务是创建与新创建的表格模型的数据连接。
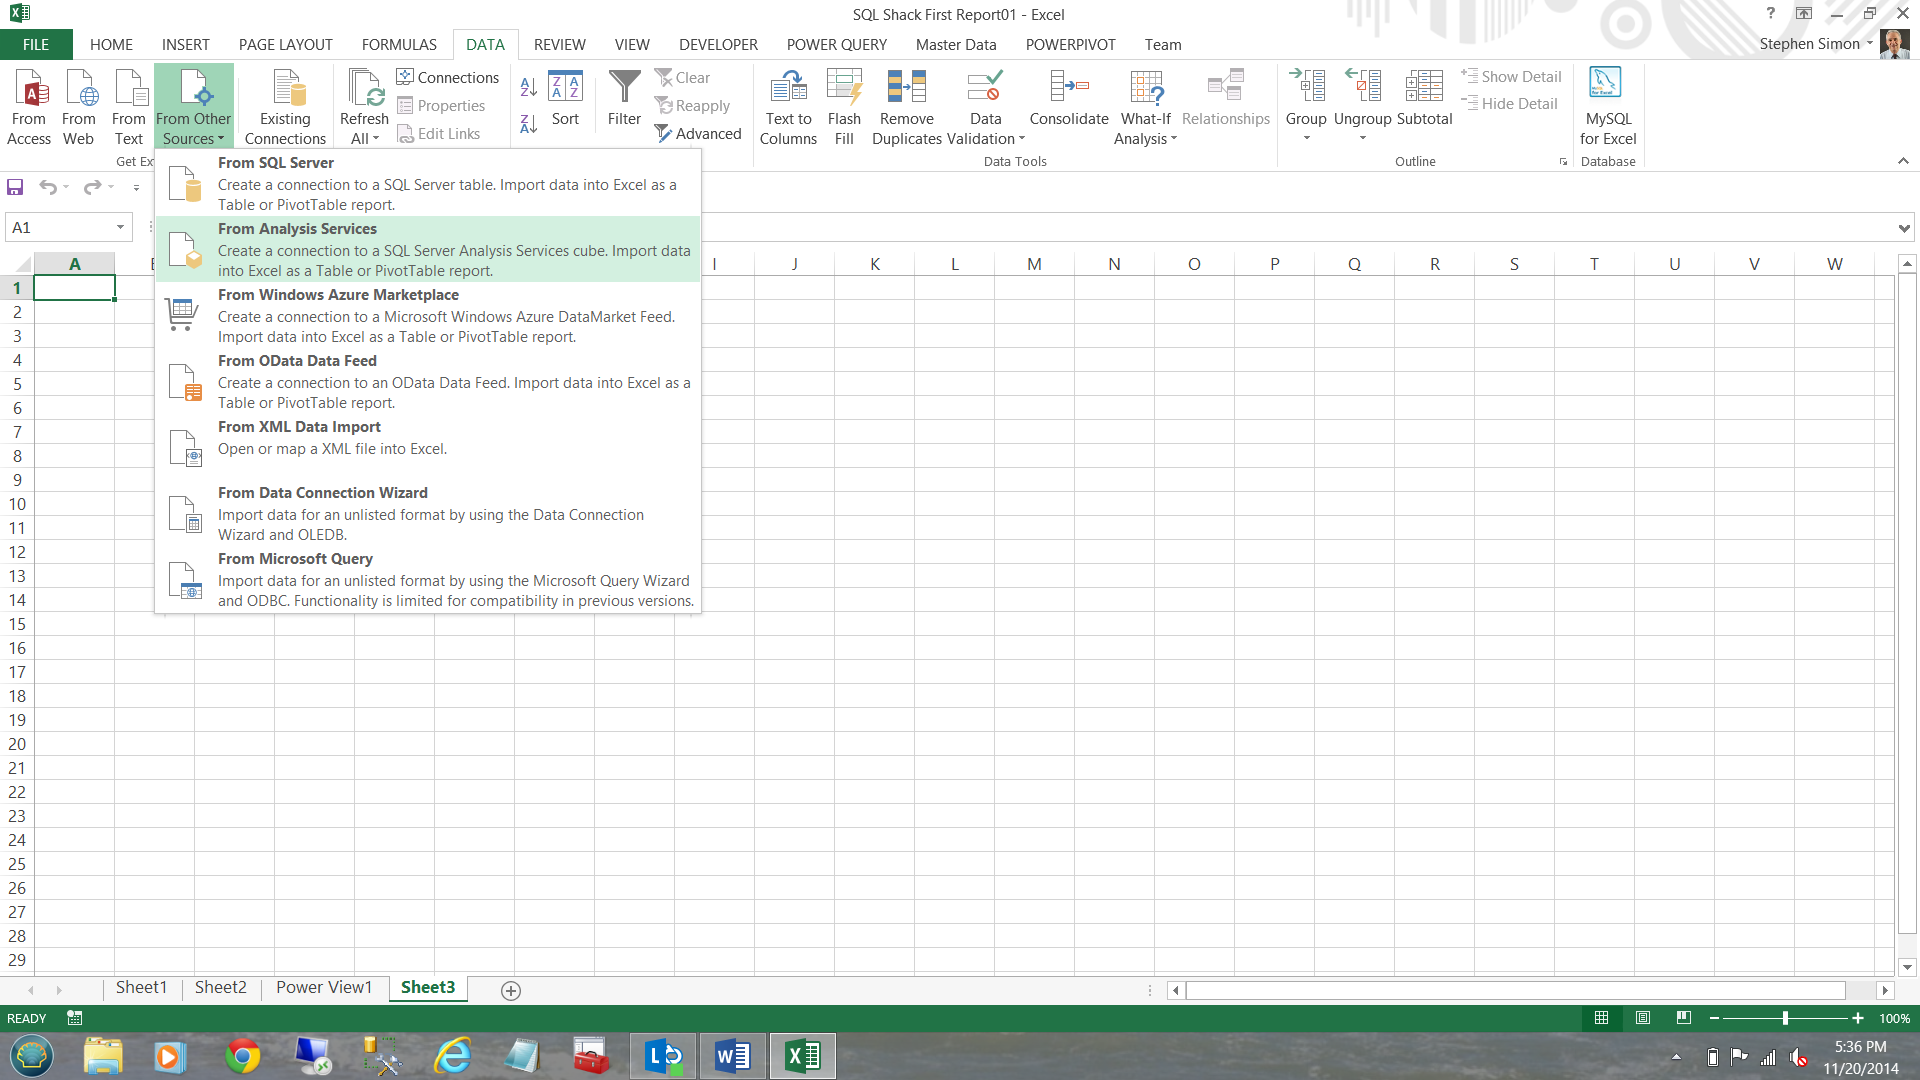
I click on the ‘Data’ tab and select ‘From other sources’ (see below).
我单击“数据”选项卡,然后选择“来自其他来源”(请参见下文)。
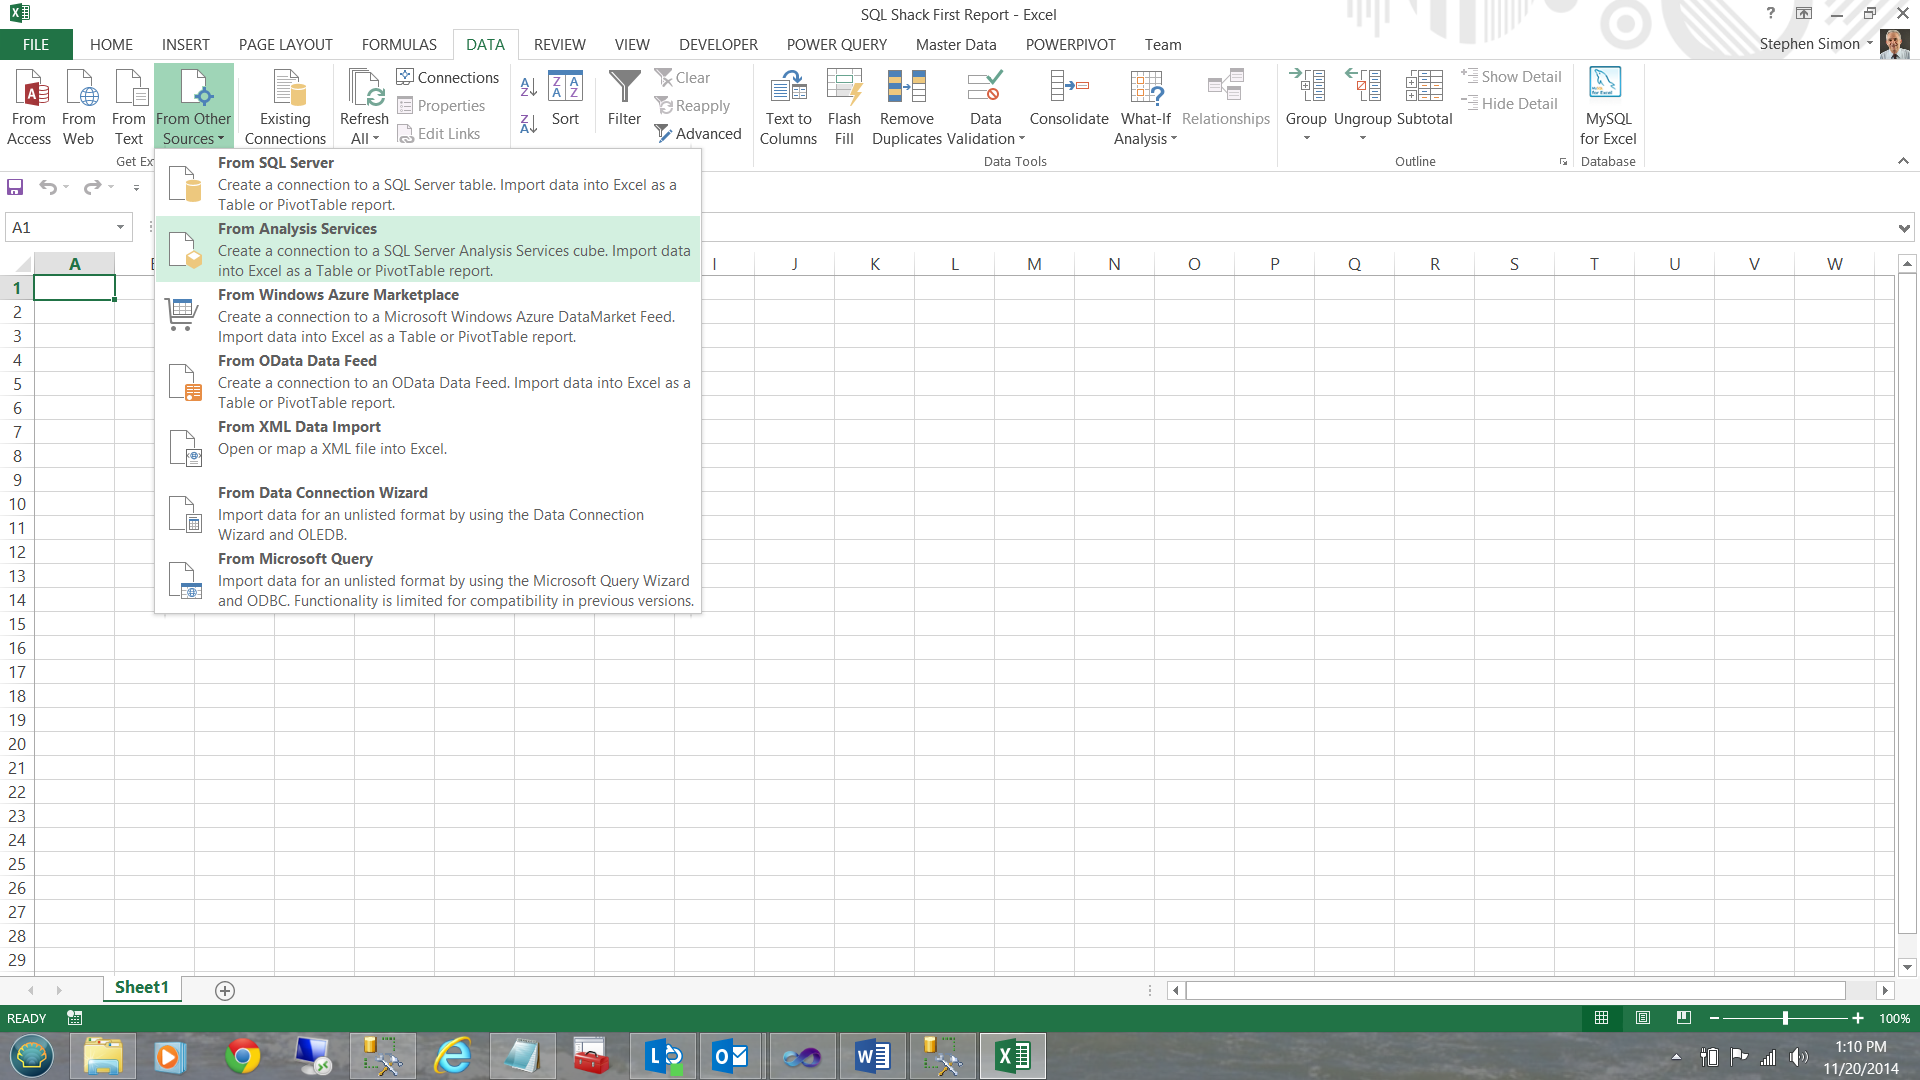
I choose ‘From Analysis Services’
我选择“来自Analysis Services”
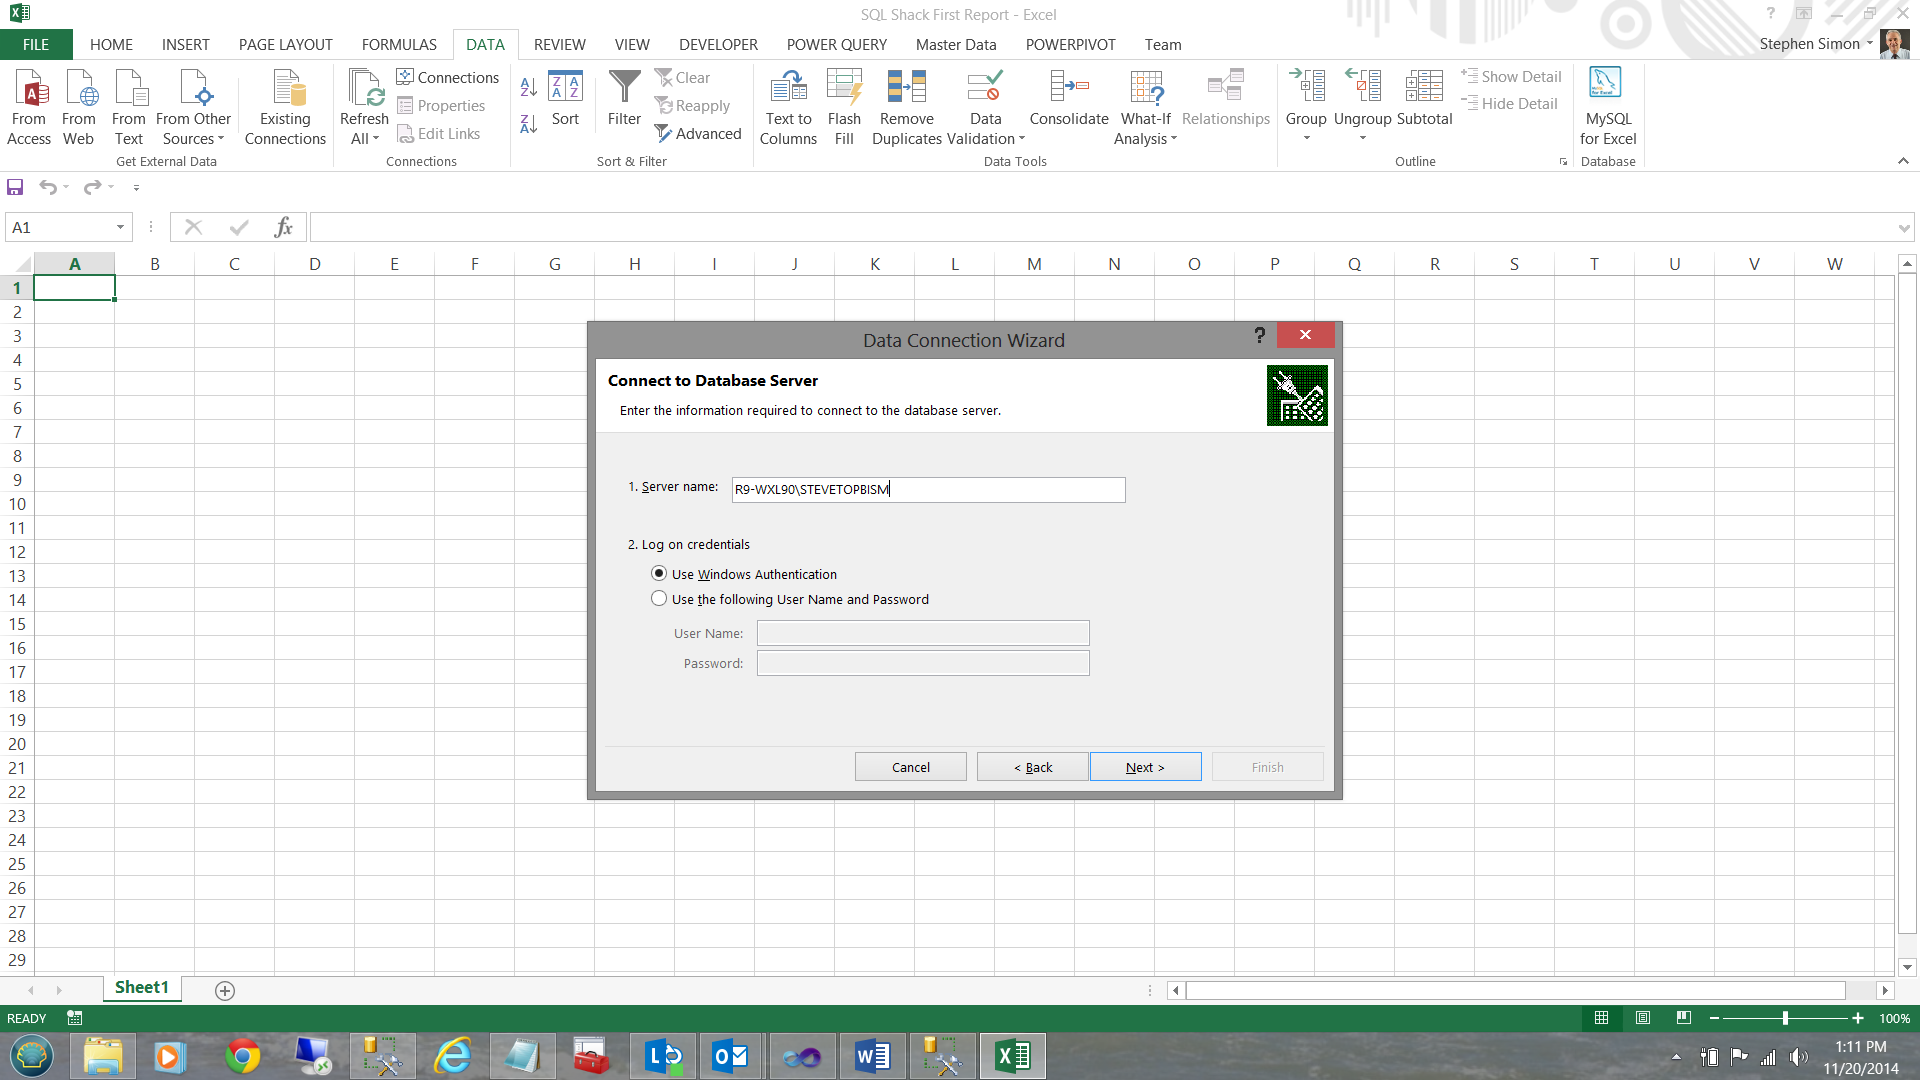
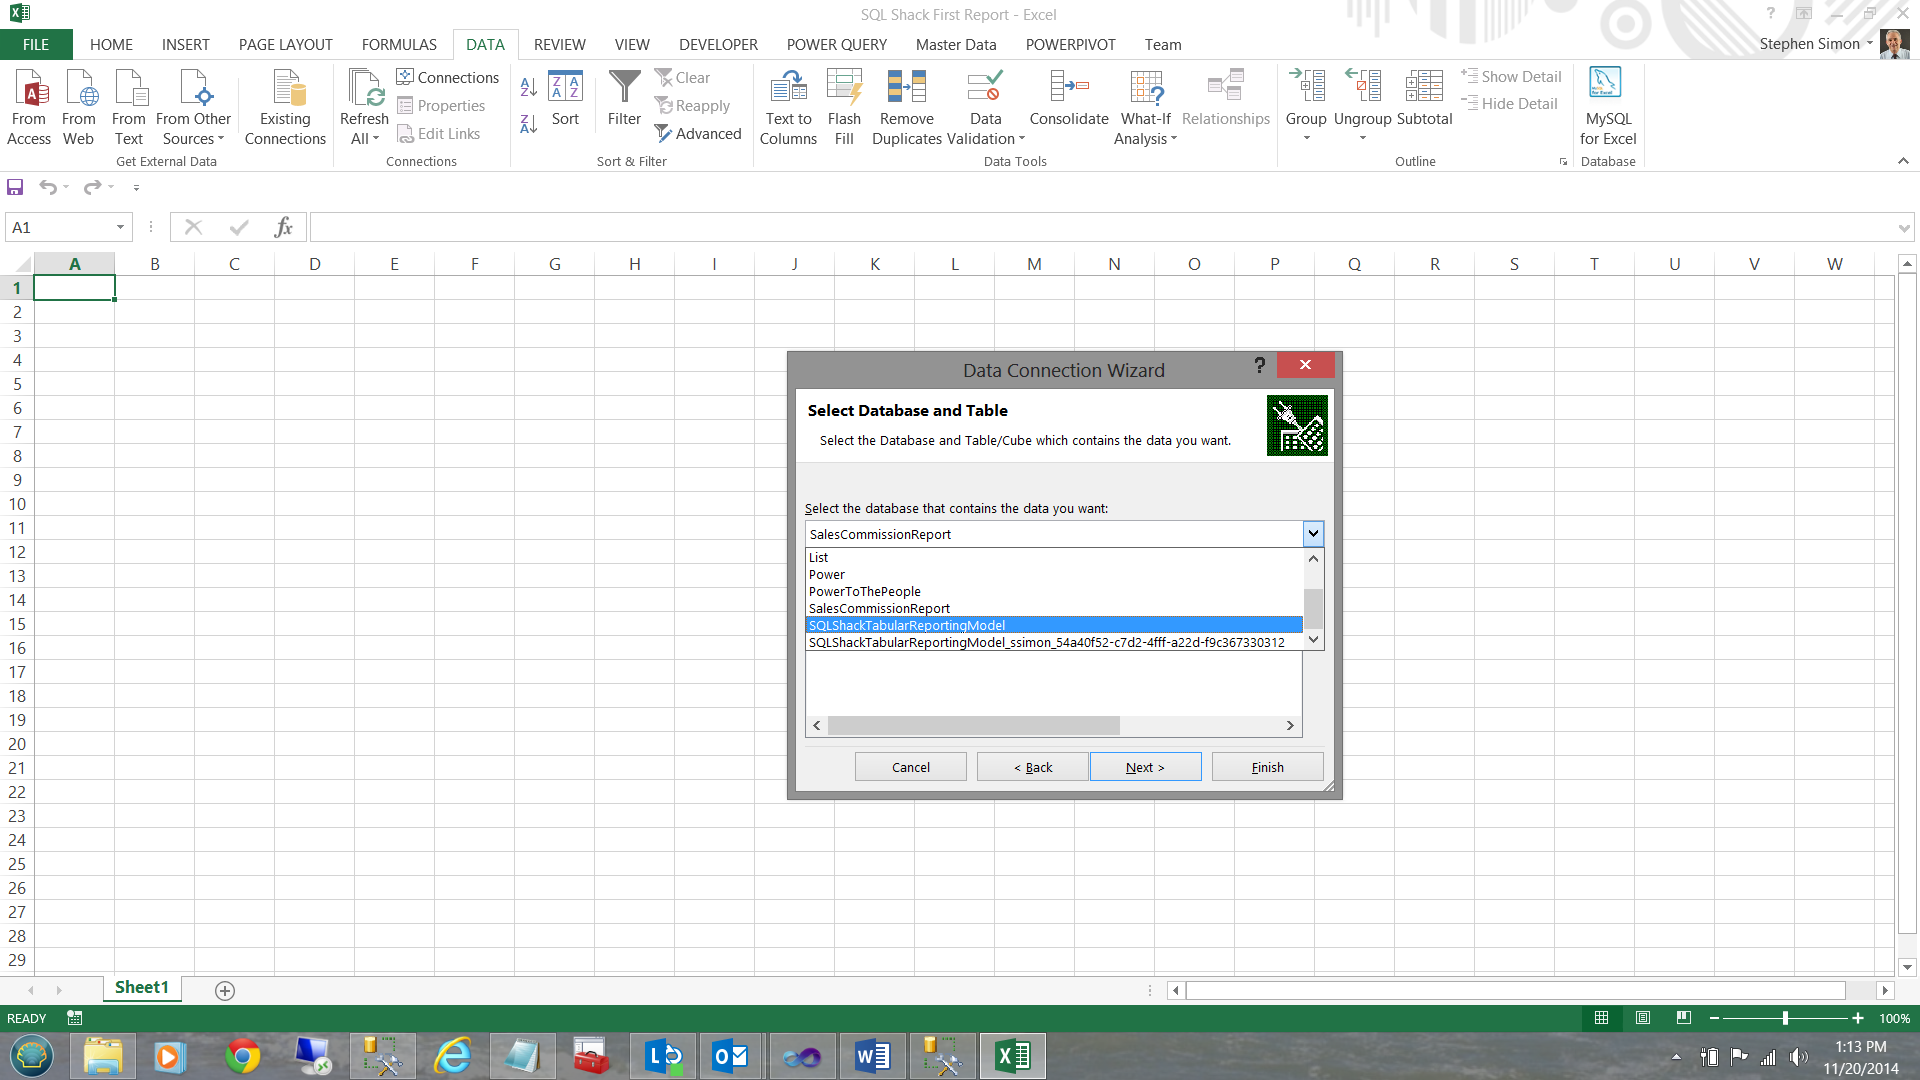
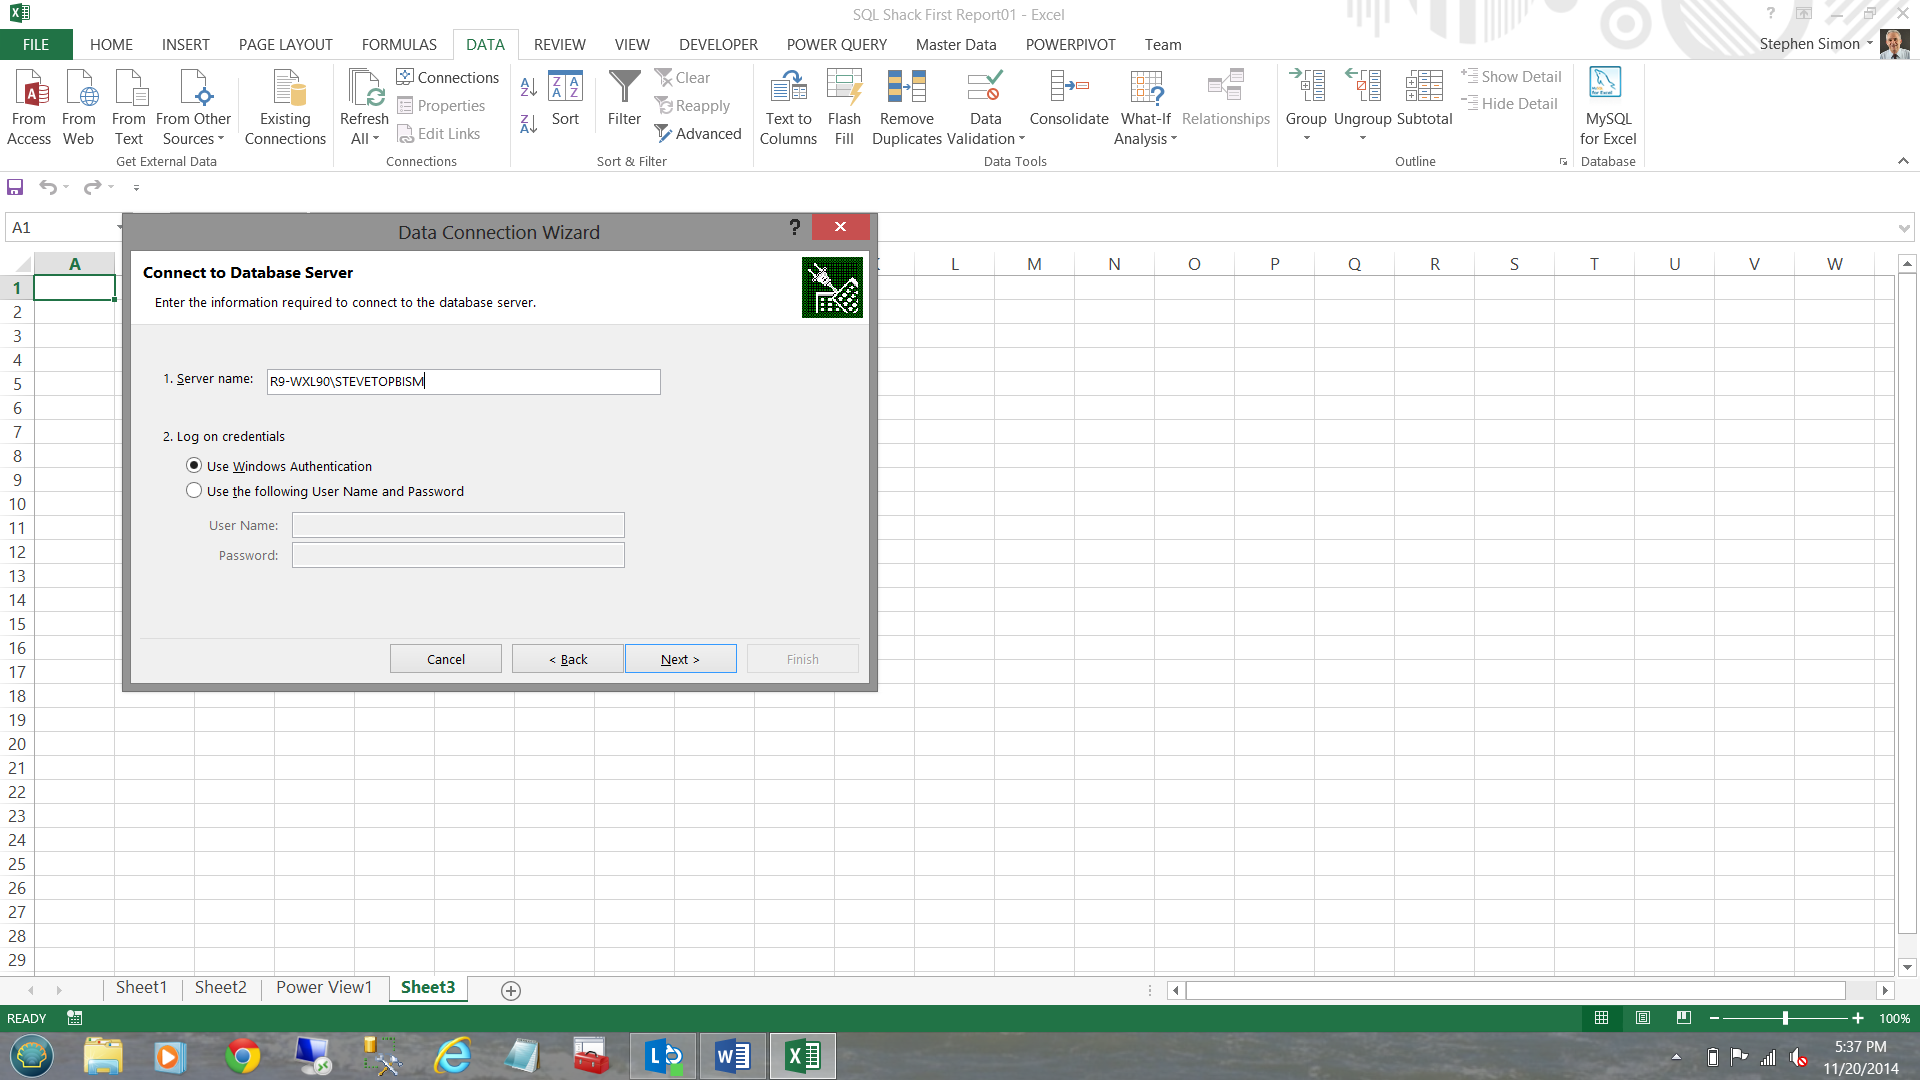
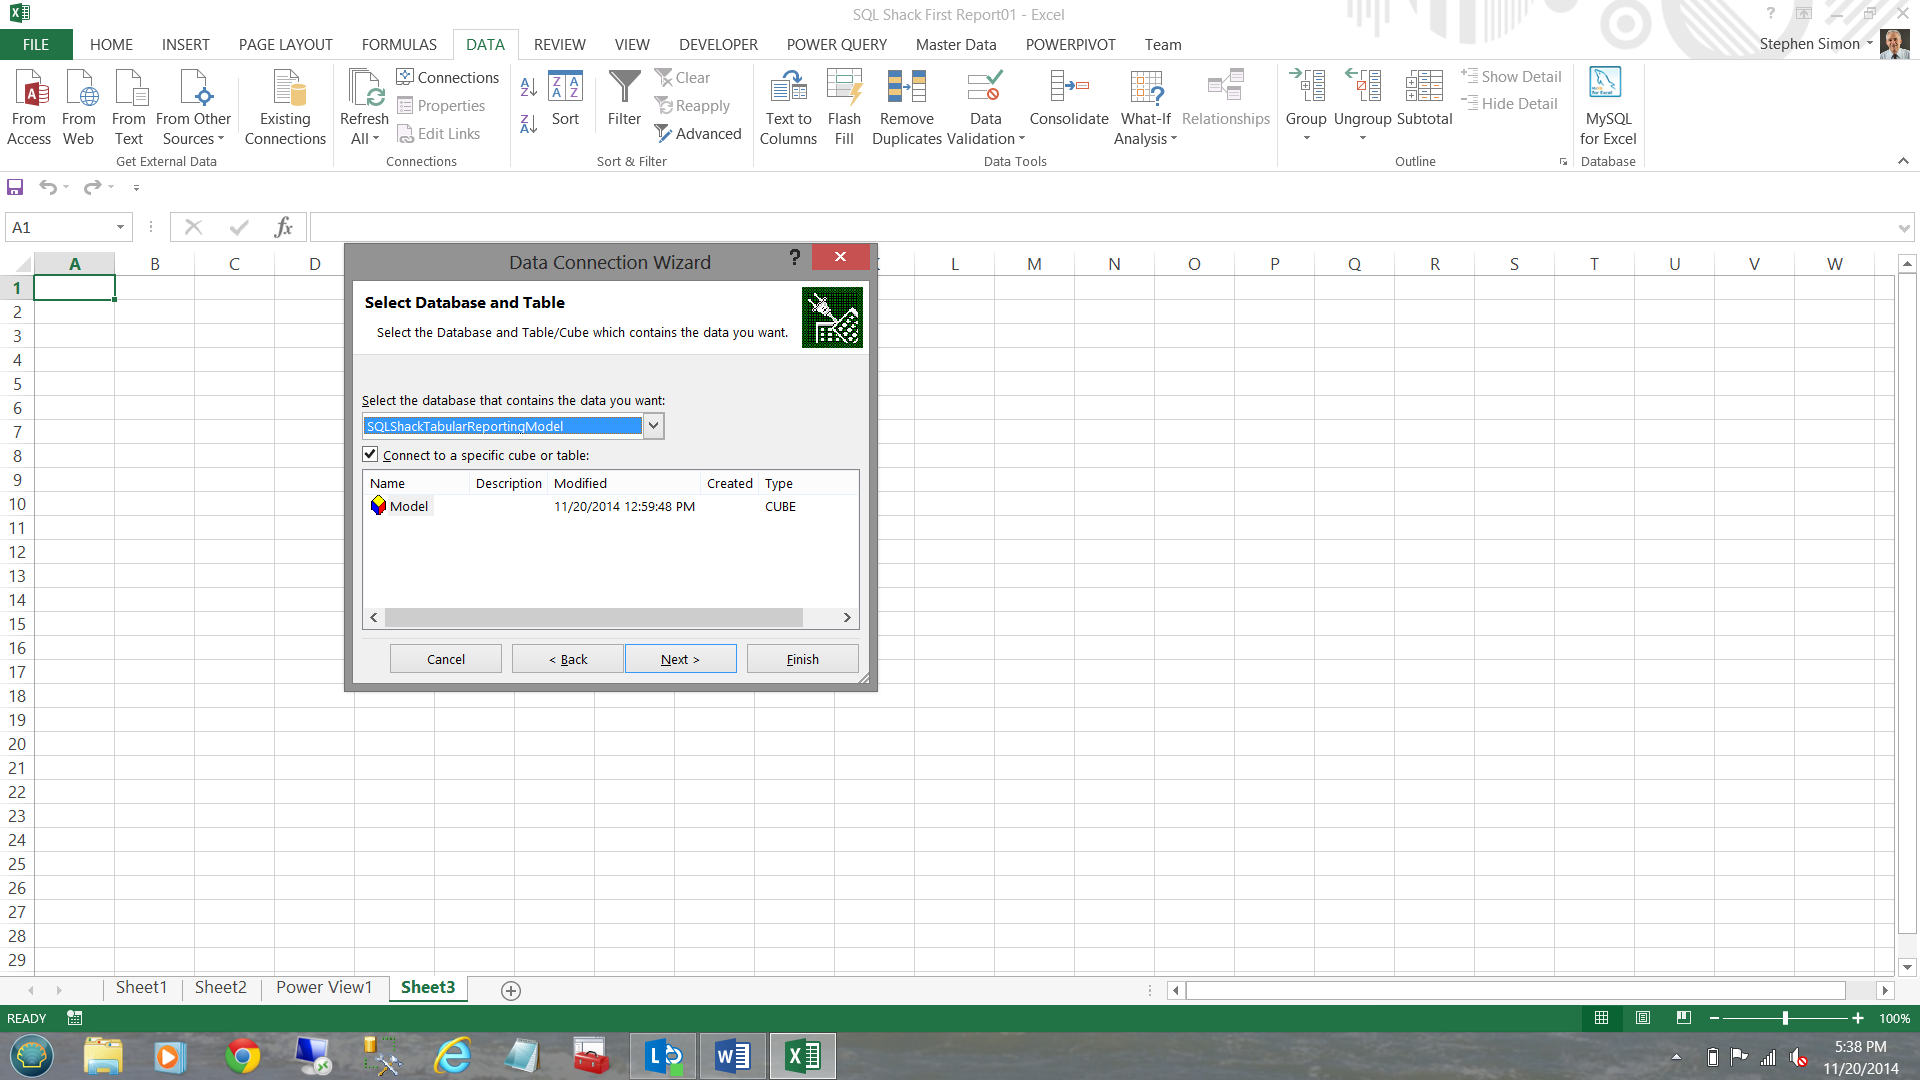
I now let Excel know which server contains the data and I select windows authentication for my credentials (see above). I then click ‘Next’. I shall now select our ‘SQLShackTabularReportingModel’ database (see below).
现在,我让Excel知道哪个服务器包含数据,然后为我的凭据选择Windows身份验证(请参见上文)。 然后,我单击“下一步”。 现在,我将选择“ SQLShackTabularReportingModel”数据库(请参见下文)。
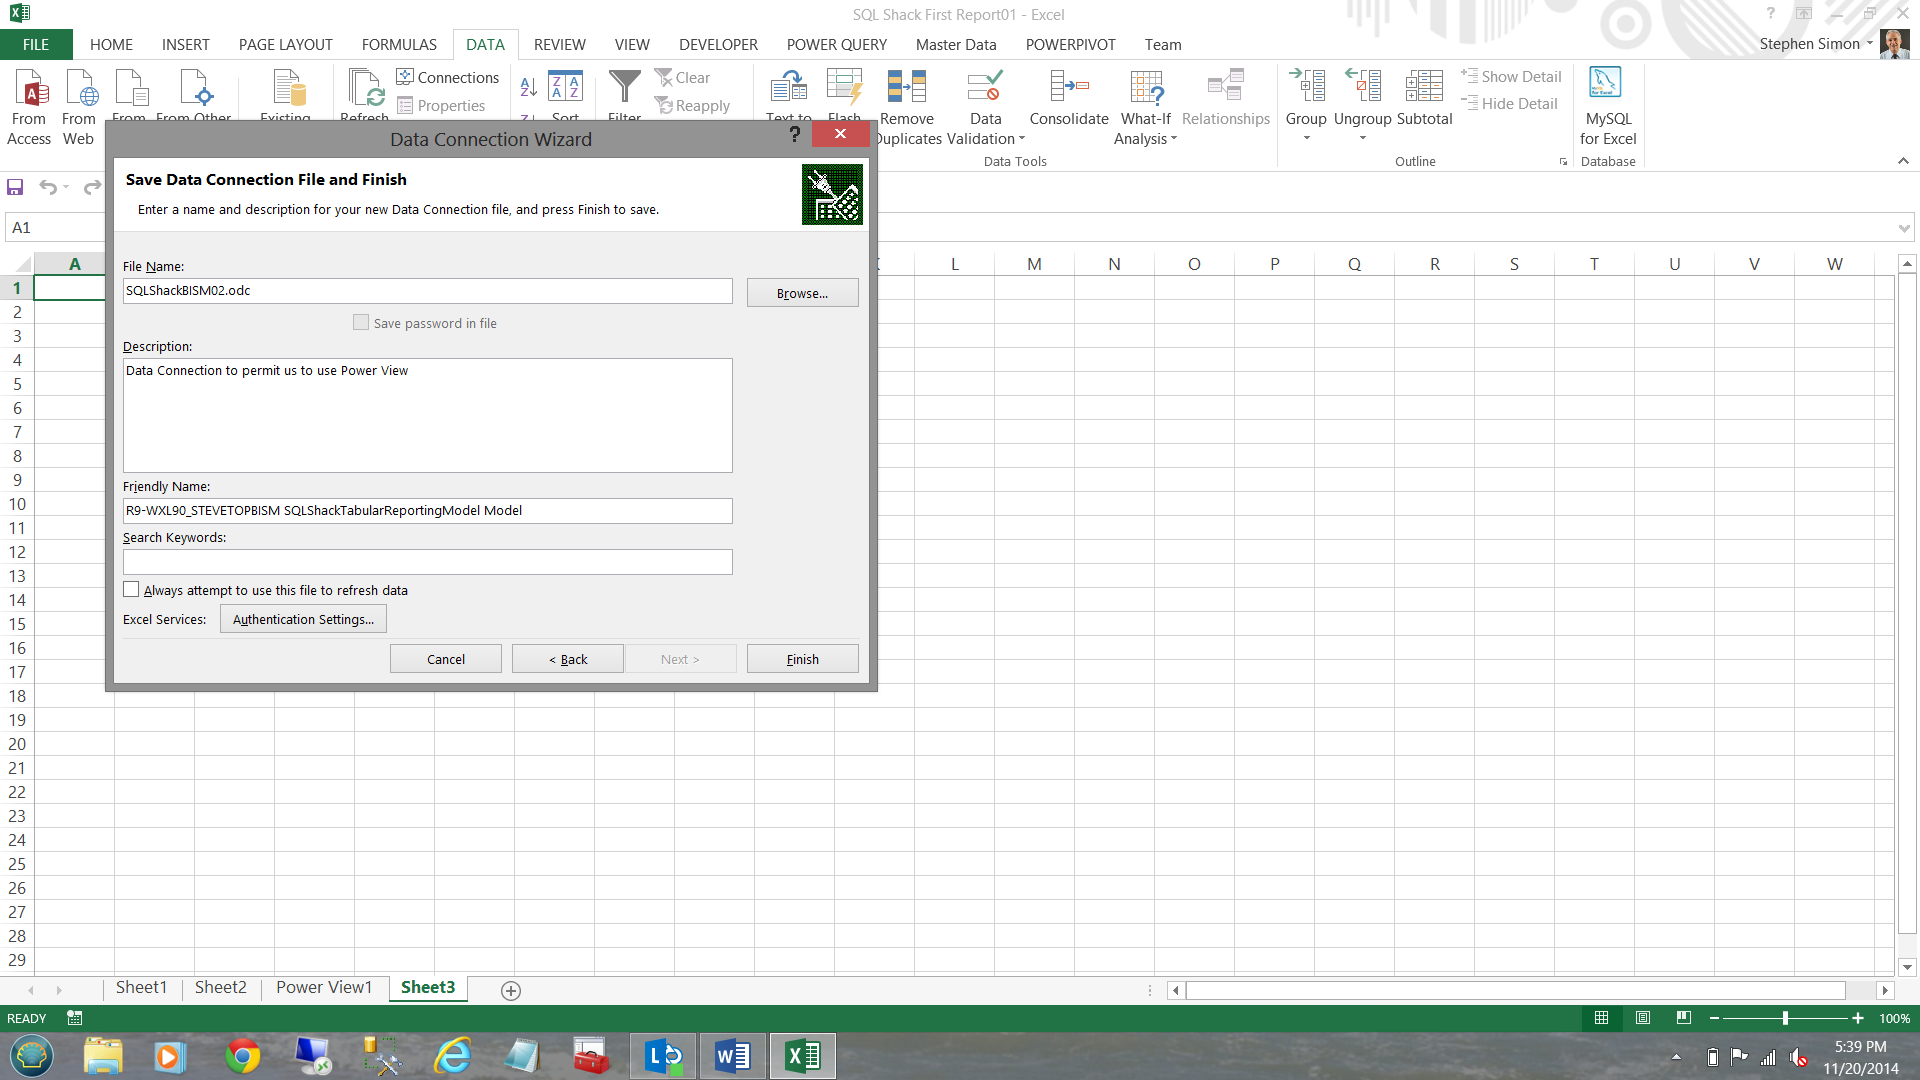
Whilst I have defined which database I wish to use, I must still create a connection from Excel to that database before I can work with the data. This is achieved via a ‘Connection File’.
在定义了我希望使用的数据库的同时,我仍然必须创建从Excel到该数据库的连接,然后才能使用数据。 这是通过“连接文件”实现的。
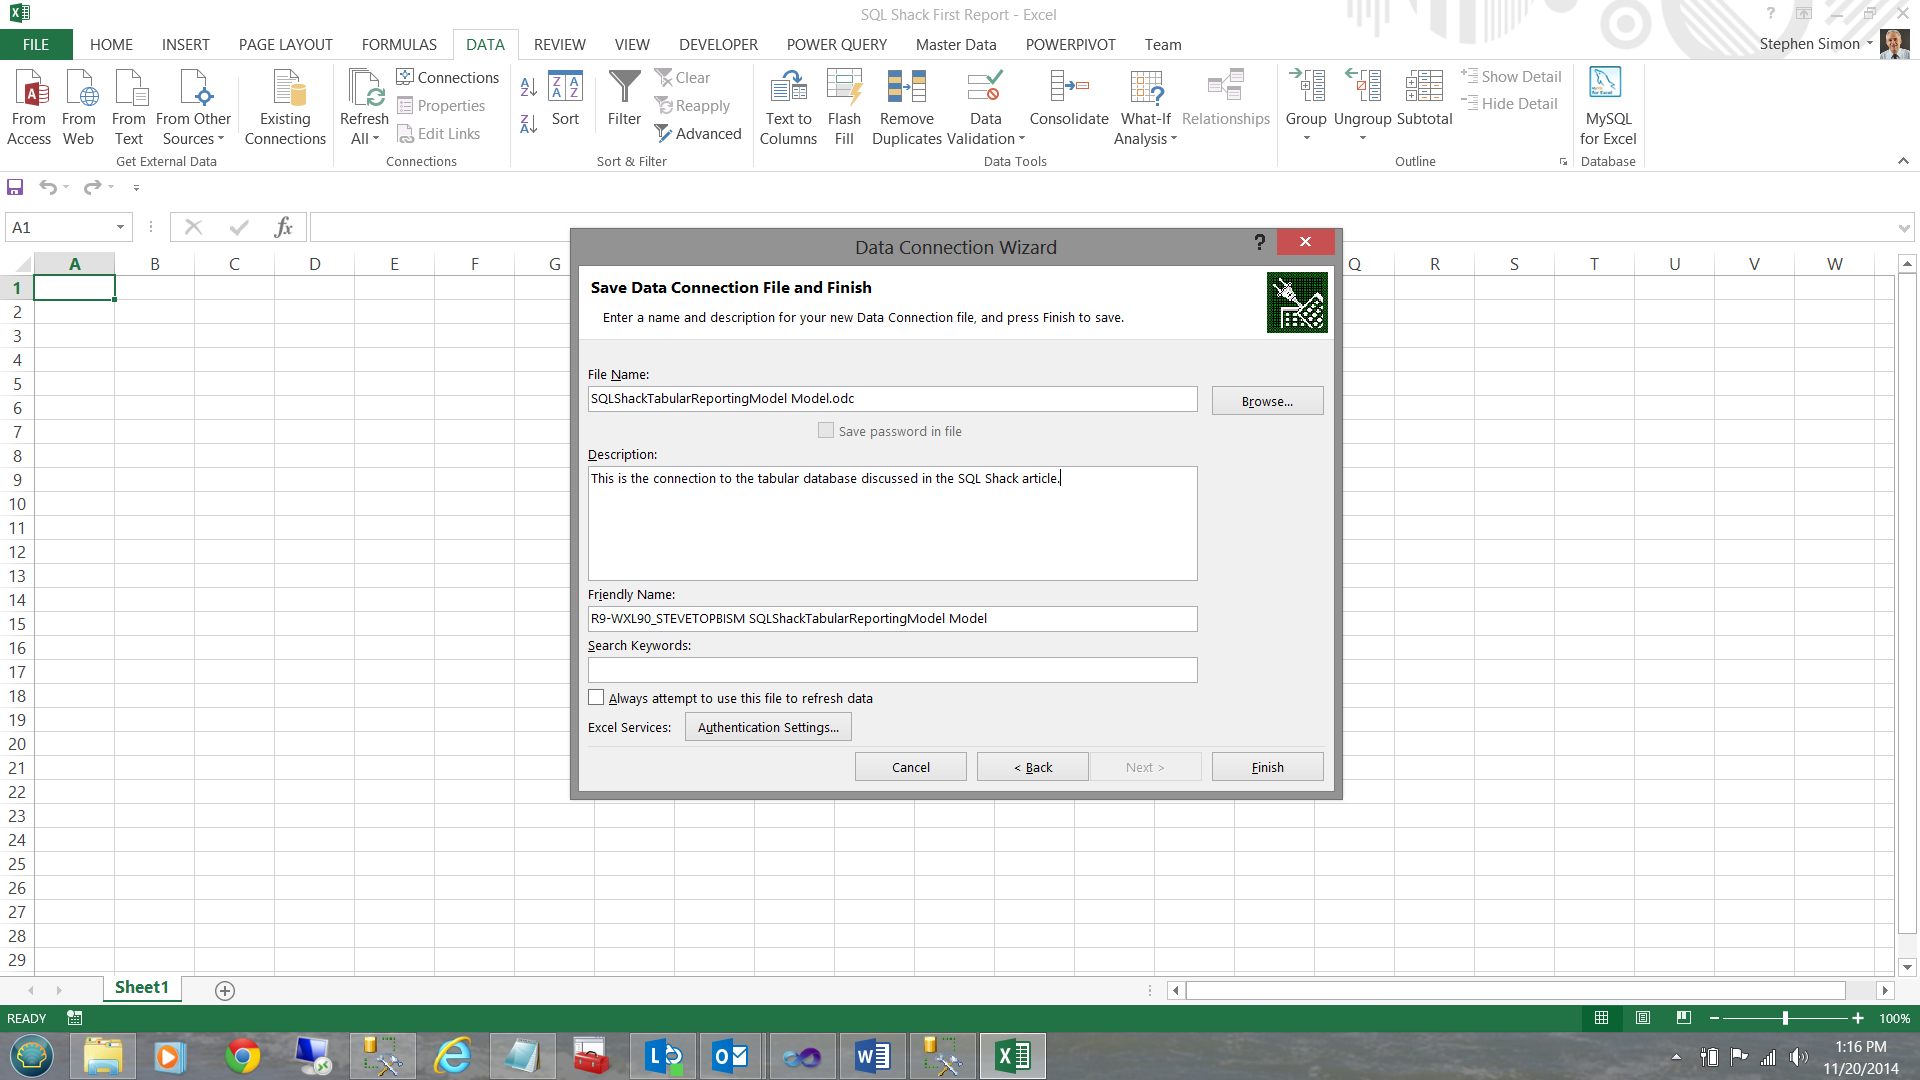
I must now give a name to our connection file. I also give the connection file a meaningful description so that the next time that I am looking for it, it will be come immediately apparent that this is the connection for which I am looking.
现在,我必须给我们的连接文件起一个名字。 我还为连接文件提供了有意义的描述,以便下次我要查找该文件时,可以很明显地看出这是我正在寻找的连接。
I click ‘Finish’.
我点击“完成”。
This done, Excel wishes to know if I would like to a PivotTable report. I click OK (see below).
完成此操作后,Excel希望知道我是否想要数据透视表报表。 我单击确定(见下文)。
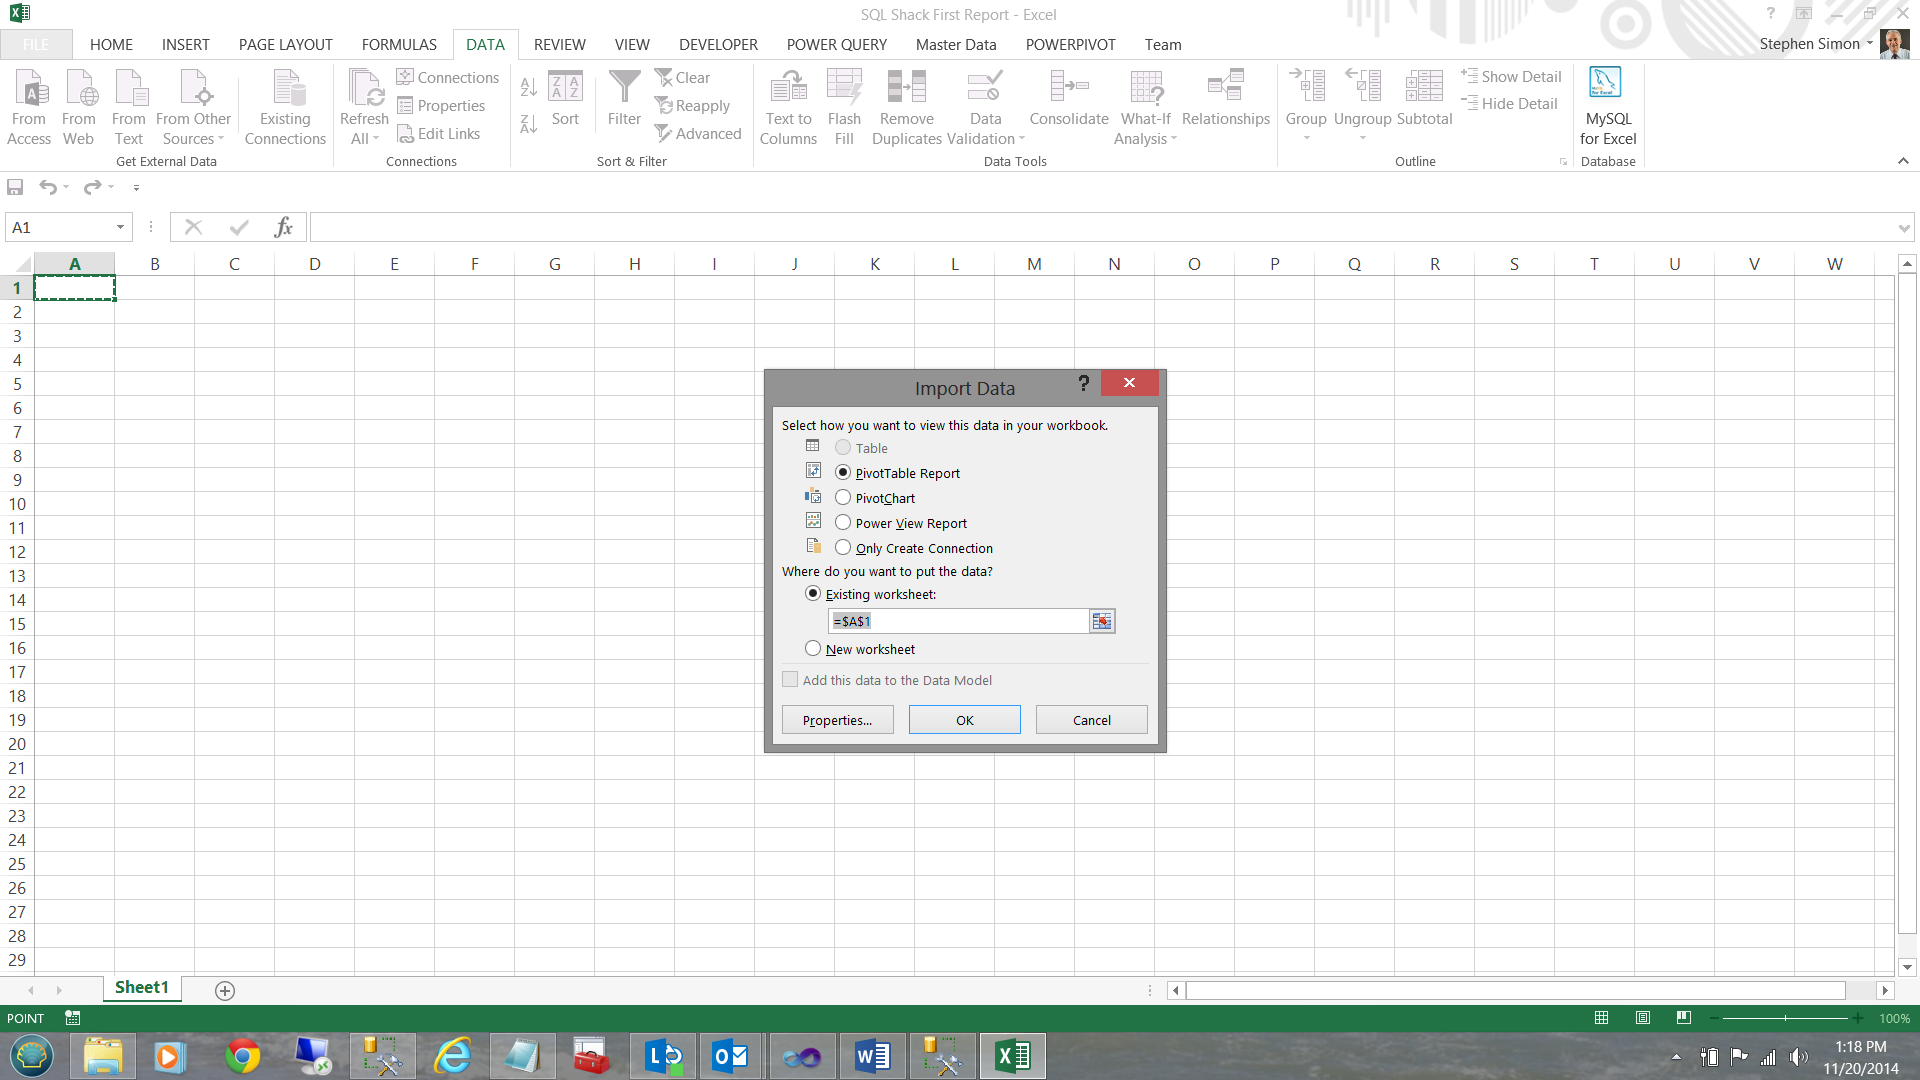
Having clicked OK, we find ourselves within a ‘PivotTable Report’, with the cells marked ‘Pivot Table1’ being where all of the ‘magic’ occurs.
单击“确定”后,我们发现自己位于“数据透视表报表”中,标记为“数据透视表1”的单元格是所有“魔术”发生的位置。
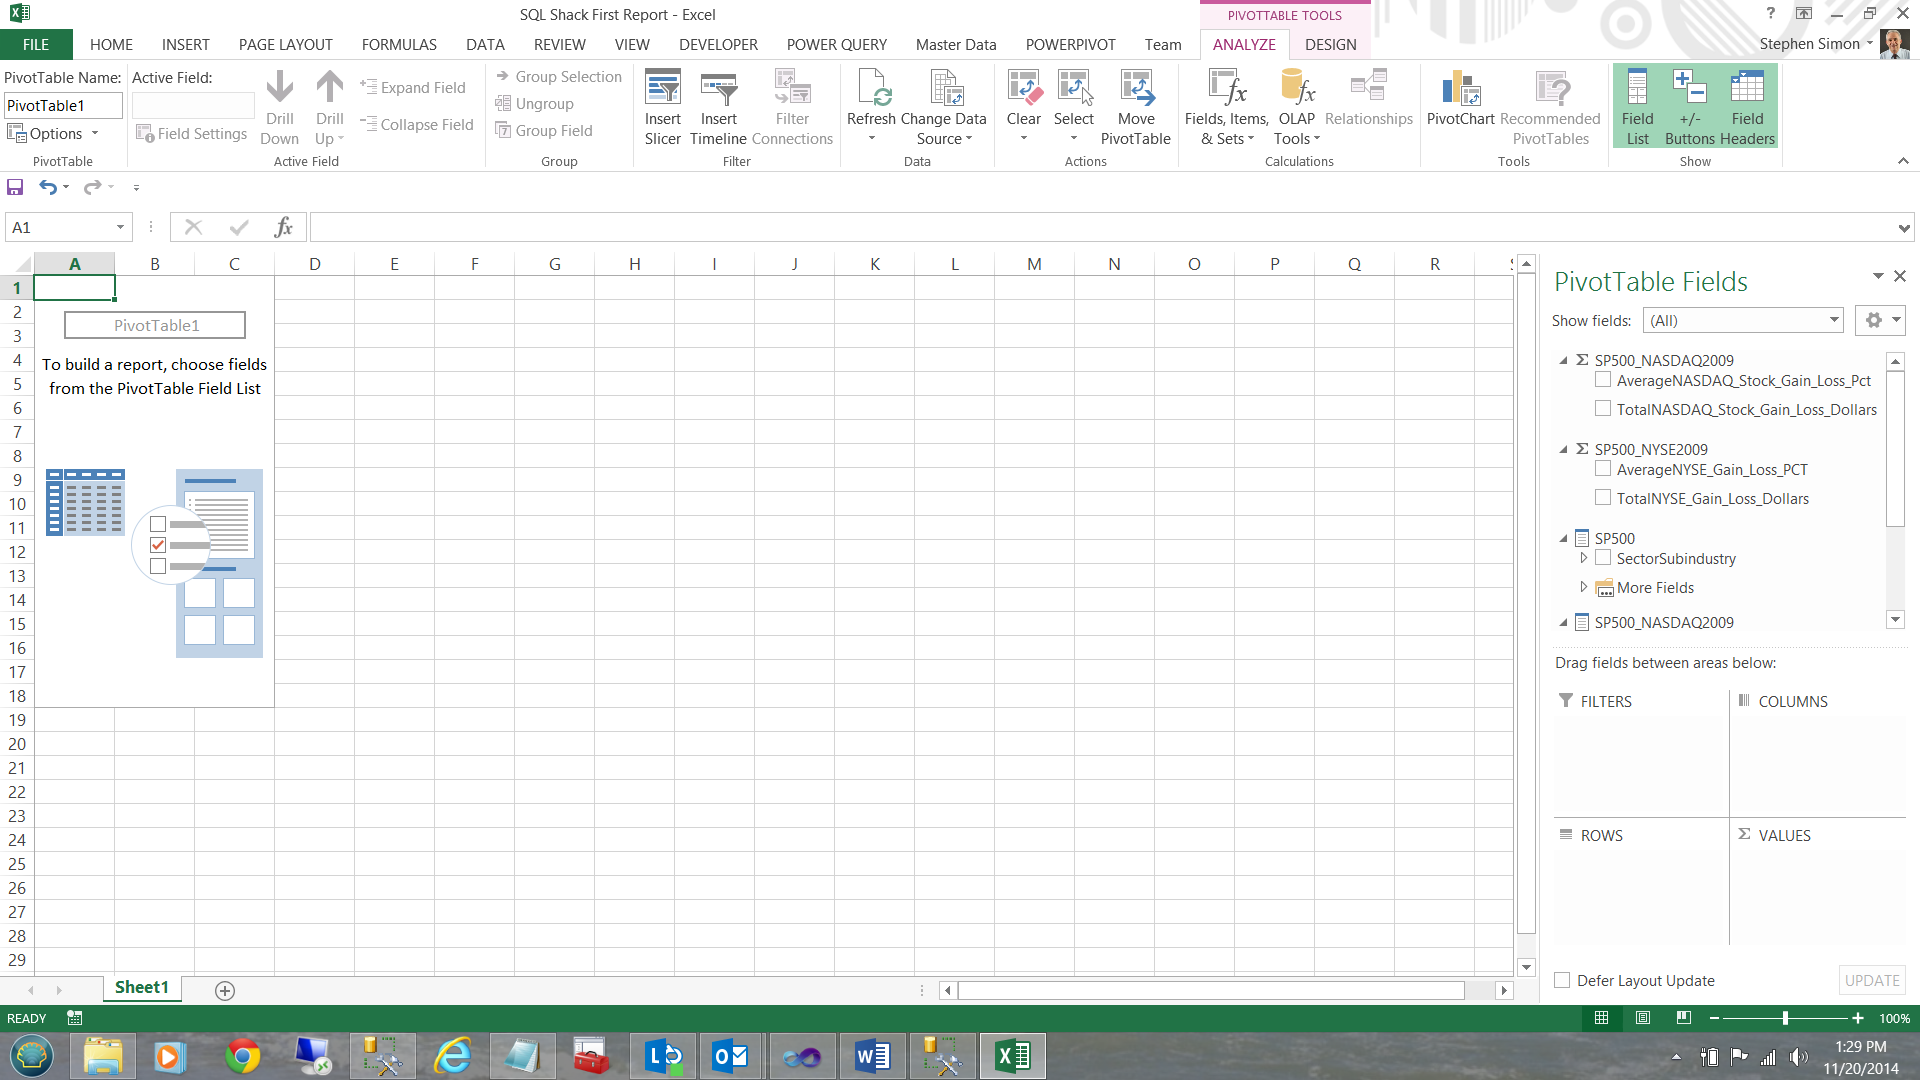
After examining the ‘PivotTable Fields’, note that the summary fields (which we created in the BISM model) are visible in the center right of your screen.
在检查了“数据透视表字段”之后,请注意摘要字段(我们在BISM模型中创建的字段)在屏幕的中心右侧可见。
These summary fields are denoted by the Greek letter Sigma Σ
这些摘要字段由希腊字母SigmaΣ表示
Selecting the SP500_NASDAQ summations, our screen immediately changes (see below).
选择SP500_NASDAQ总和,我们的屏幕立即更改(请参阅下文)。
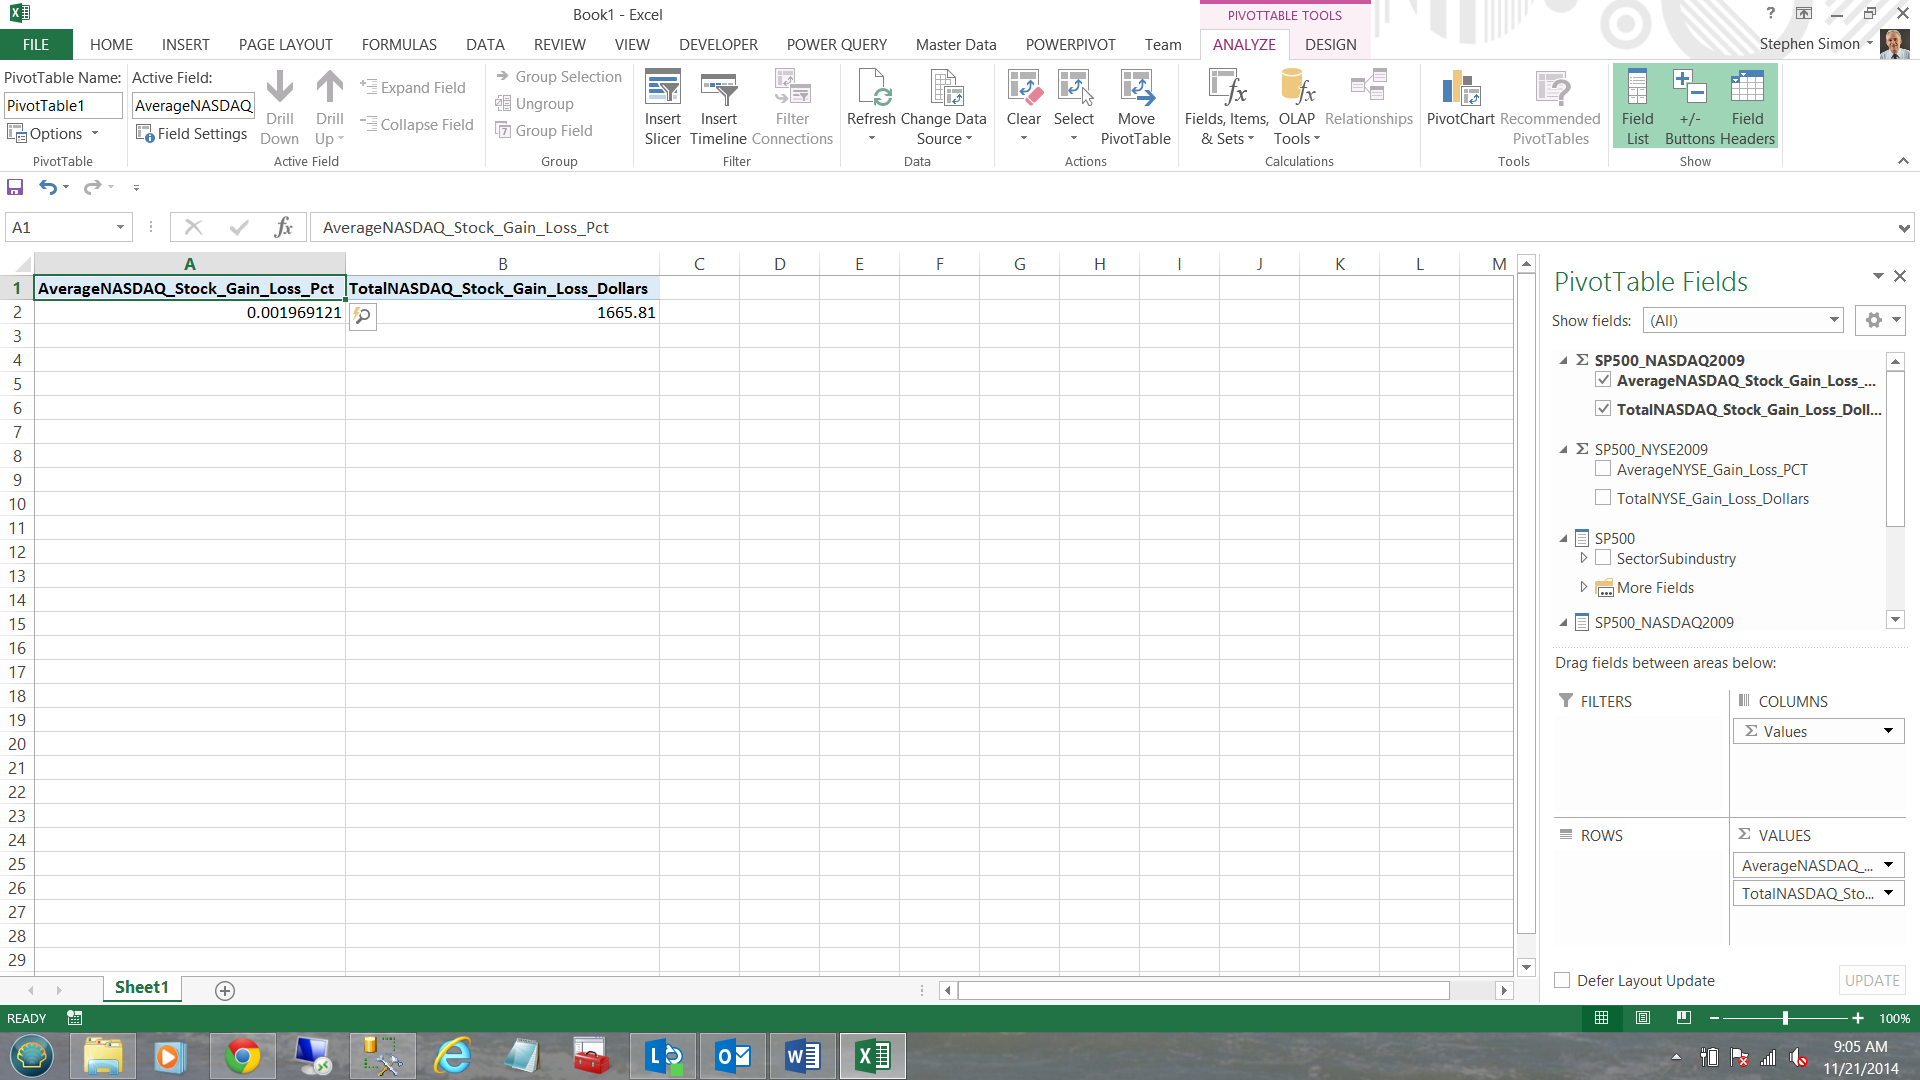
Note that this is a summation of all records within the entity. What we really want to do is to look at the data in a more granular manner fashion; therefore I now ‘check’ the ‘SectorSubindustry’ hierarchy which is then brought onto our work surface. We now have a clear view of the data 🙂 (see below).
请注意,这是实体内所有记录的总和。 我们真正想做的是以更细化的方式查看数据。 因此,我现在“检查”“ SectorSubindustry”层次结构,然后将其带入我们的工作界面。 现在,我们可以清楚地看到数据🙂(见下文)。
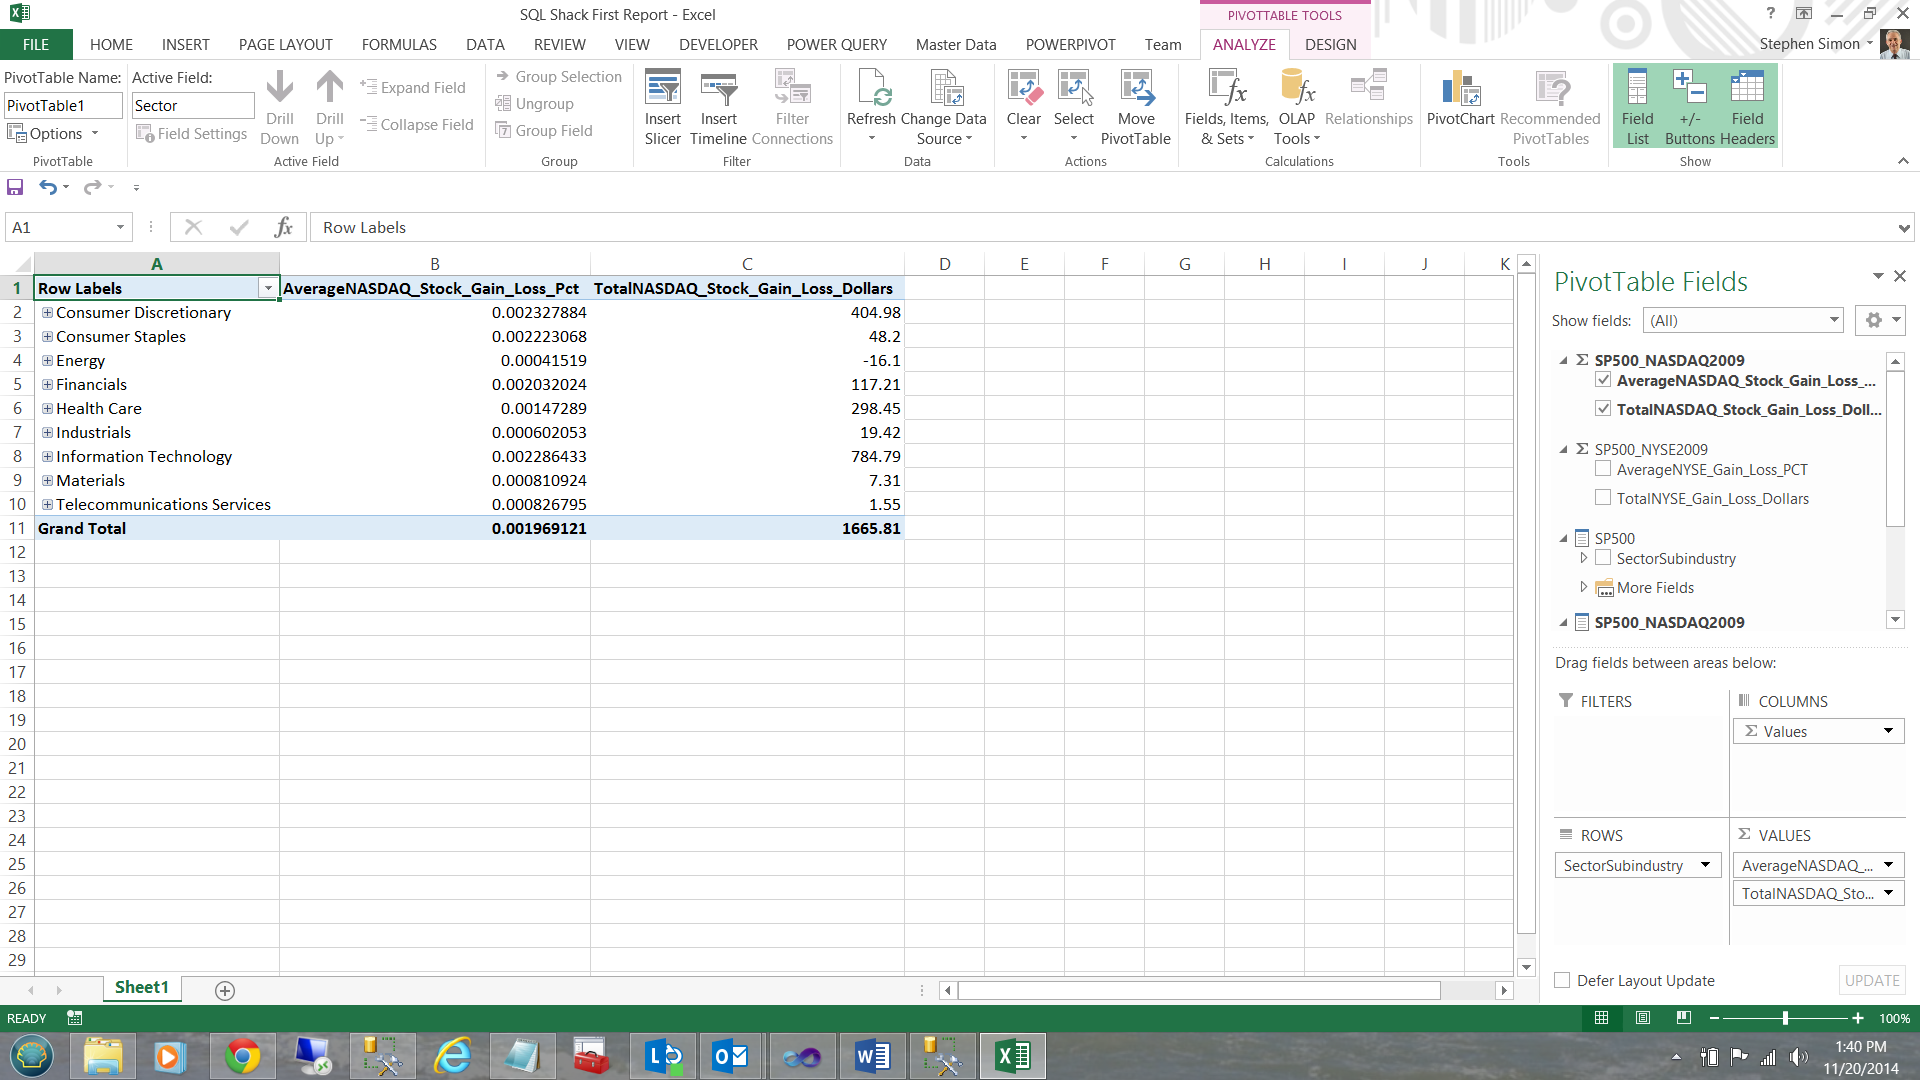
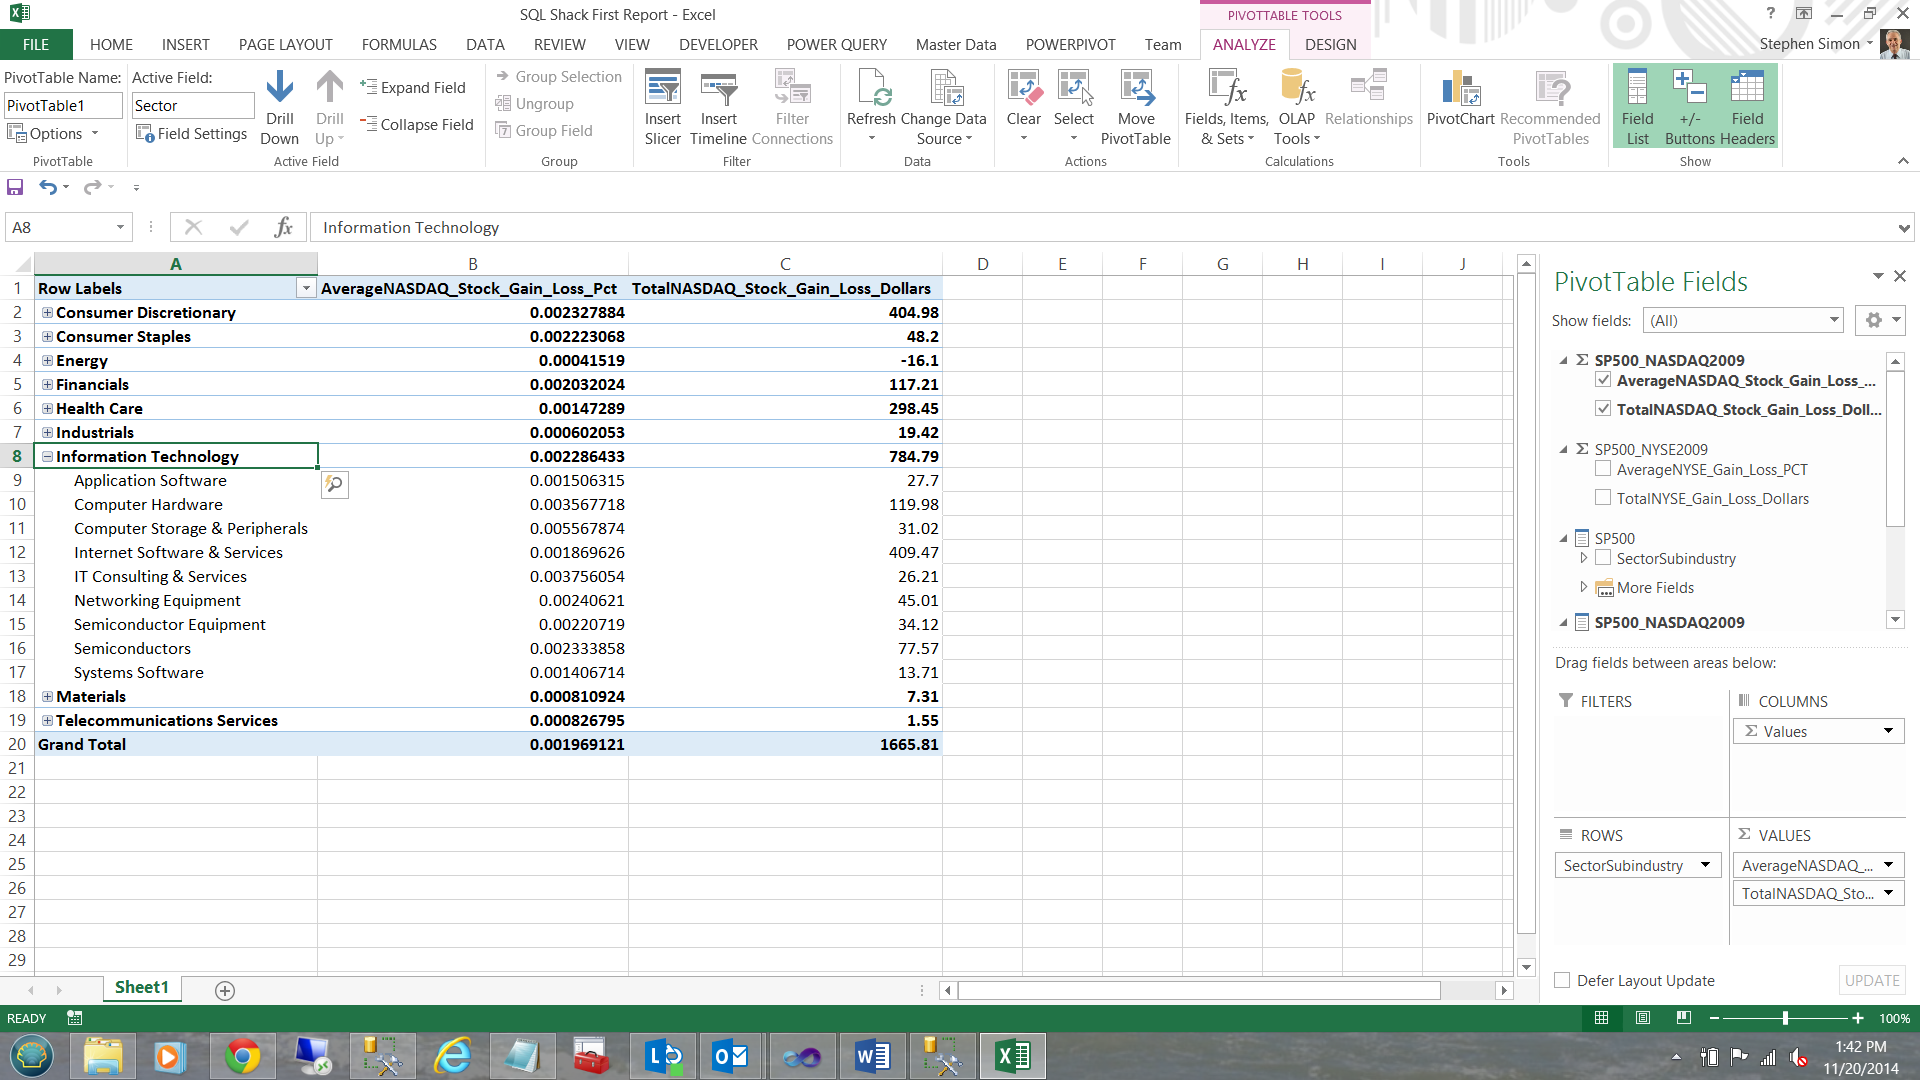
Drilling through… we now find that ‘Information Technology’ has a slew of sub-industries. I click on the + sign next to ‘Information Technology’.
钻研……我们现在发现“信息技术”有很多子行业。 我单击“信息技术”旁边的+号。
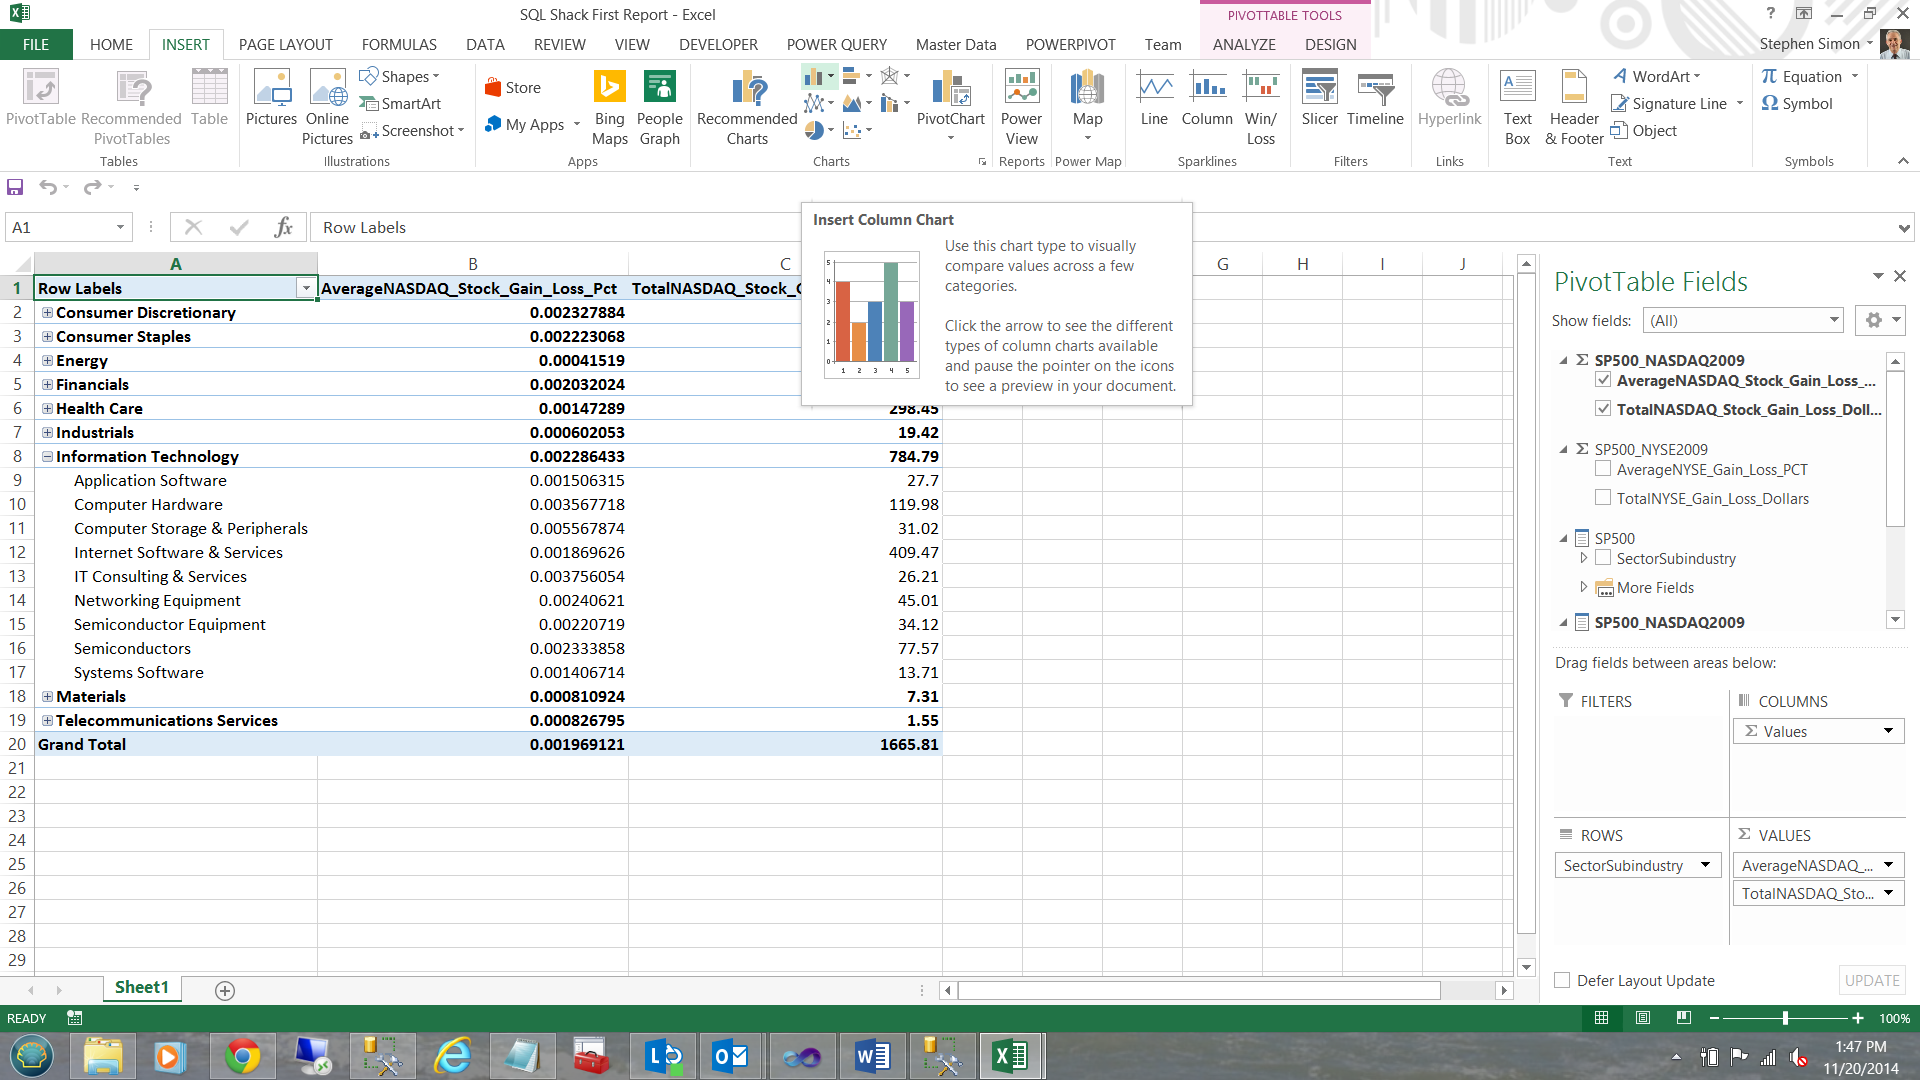
Last, but not least, let us add a chart to our PivotTable Report. Placing my cursor in one of the cells in column A, I click ‘Insert’ and choose ‘Chart’ and then ‘Insert Column Chart’ (see below).
最后但并非最不重要的一点,让我们将图表添加到数据透视表报表中。 将光标放在A列中的一个单元格中,单击“插入”,然后选择“图表”,然后选择“插入柱形图”(见下文)。
Without any further interaction, a chart is created based upon the data that we have.
无需任何进一步的交互,便会根据我们拥有的数据创建一个图表。
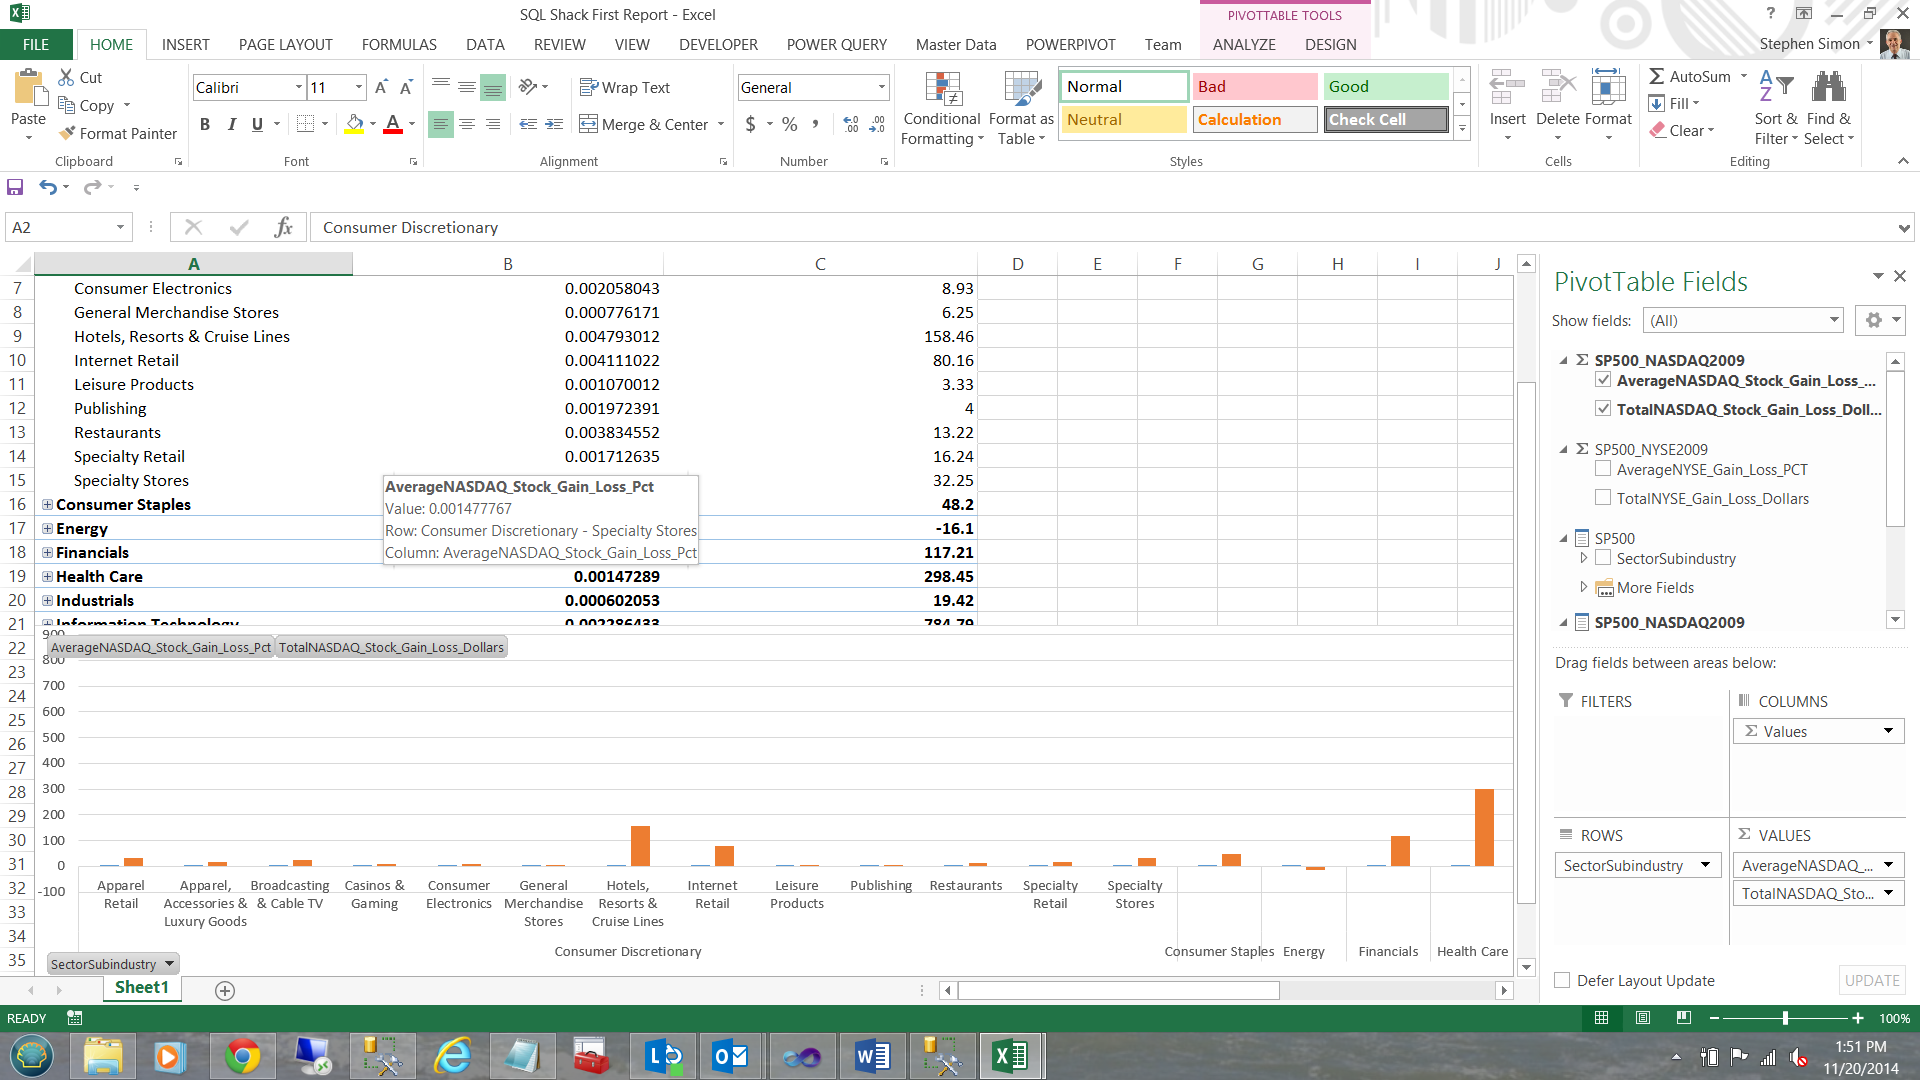
The astute reader will note that our chart is showing the sub industry data BECAUSE we have the ‘Consumer Discretionary’ tab exploded. Closing ‘Consumer Discretionary’ causes the chart to show sector related values (see below).
精明的读者会注意到我们的图表显示的是子行业数据,因为我们展开了“非必需消费品”标签。 关闭“ Consumer Discretionary”,使图表显示与行业相关的值(请参见下文)。
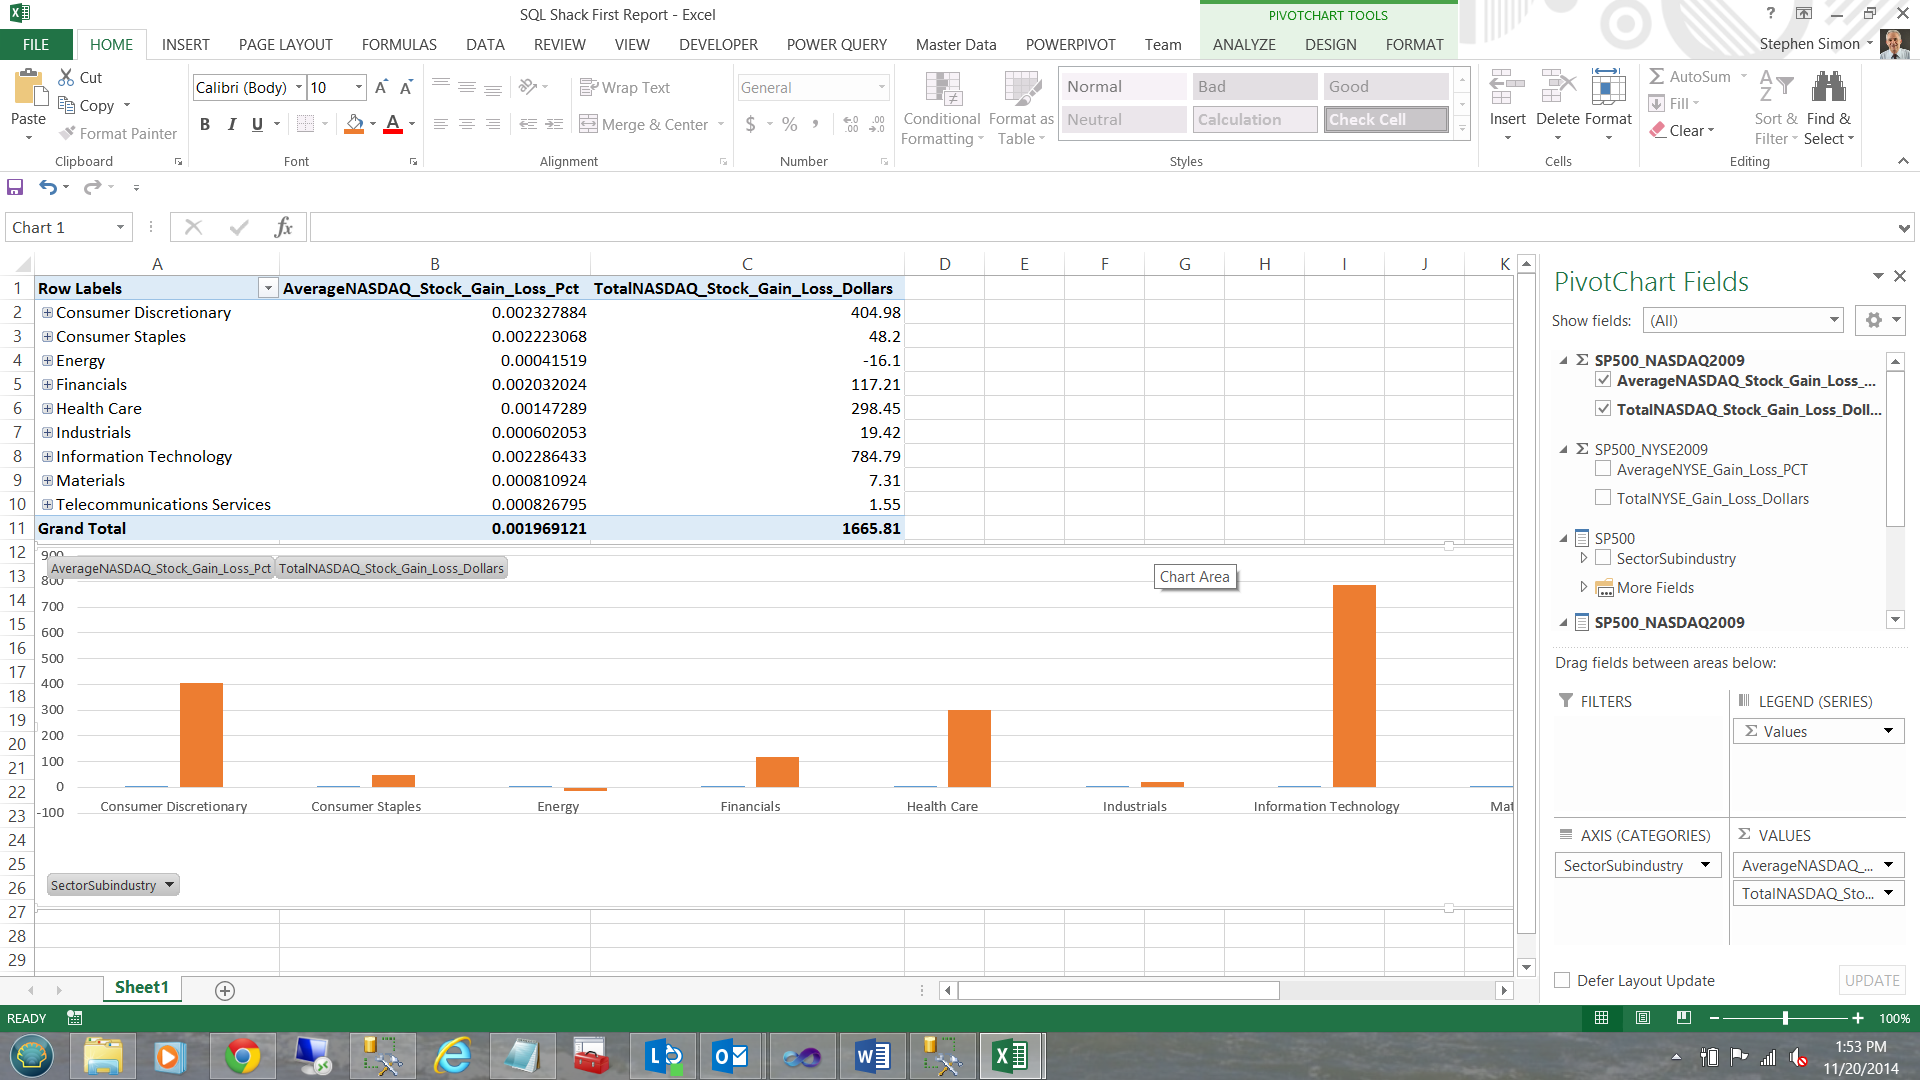
Now, how cool is this!!!
现在,这有多酷!
继续: (Moving on:)
In a similar fashion we could create a SP500 – NYSE Pivot Report.
我们可以用类似的方式创建一个SP500 – NYSE数据透视报告。
这次通过Power View创建第二个报告 (Creating our second report, this time via Power View)
Power View is similar to Power Pivot except that it permits more ‘bangers and whistles’ to be added to the report. In the world of ‘Vanilla’ this is ‘Strawberry’.
Power View与Power Pivot相似,不同之处在于Power View允许在报表中添加更多的“砰砰声”。 在“香草”世界中,这就是“草莓”。
To create our first Power View Report, we open up a new sheet within our workbook.
要创建我们的第一个Power View报告,我们在工作簿中打开一个新表。
Once again we choose Data, ‘From Other Source’ and then ‘From Analysis Services’.
我们再次选择“数据”,“来自其他来源”,然后“来自Analysis Services”。
We now tell Excel where the data is located (see above) and click next.
现在,我们告诉Excel数据位于何处(见上文),然后单击“下一步”。
Once again, I select our SQLShackTabularReportingModel (see above) and click next.
再次选择我SQLShackTabularReportingModel(请参见上文),然后单击“下一步”。
I name our second connection differently to avoid conflicts should I wish to use the first connection again. I then click ‘Finish’.
我希望对第二个连接使用不同的名称,以避免在我希望再次使用第一个连接时发生冲突。 然后单击“完成”。
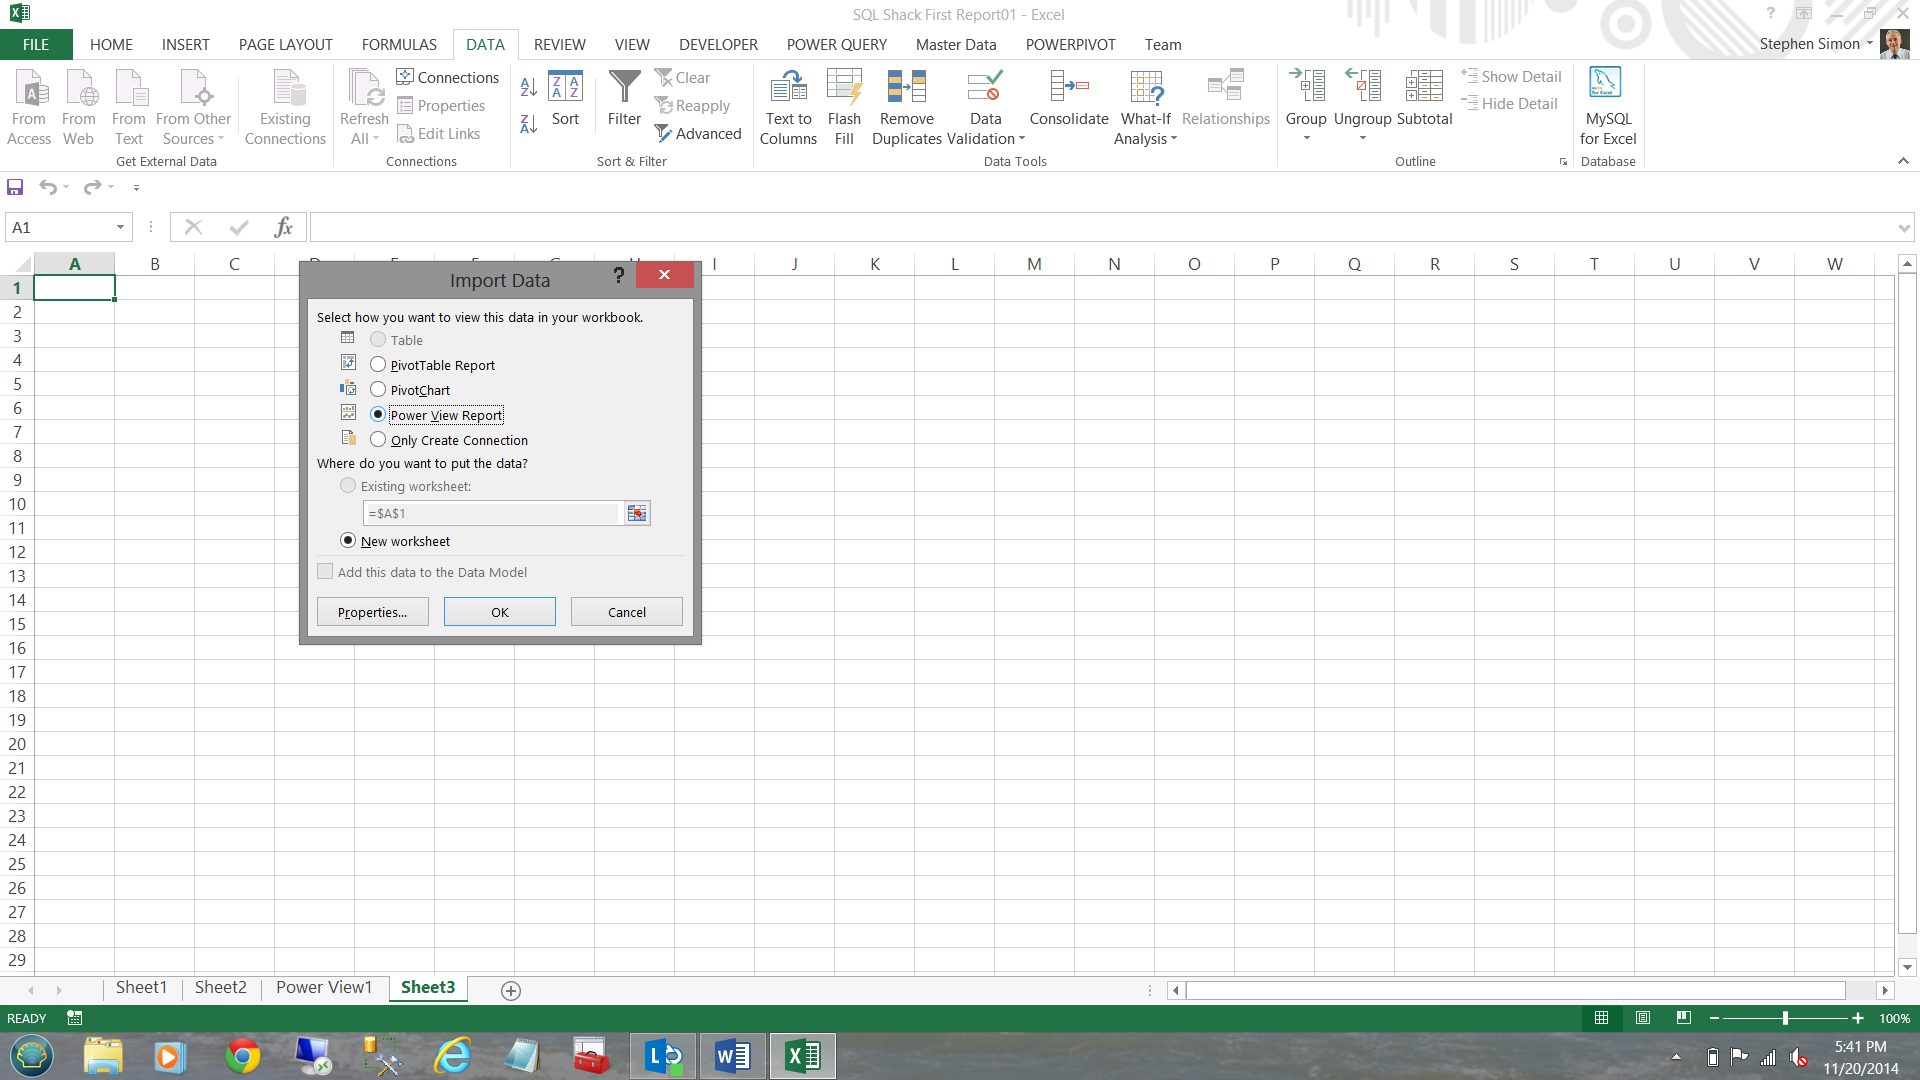
The reader will note that the same ‘Import Data’ dialogue box appears HOWEVER this time I choose create ‘Power View Report’ (see below).
读者会注意到,这次我选择创建“ Power View报表”,出现了相同的“导入数据”对话框(见下文)。
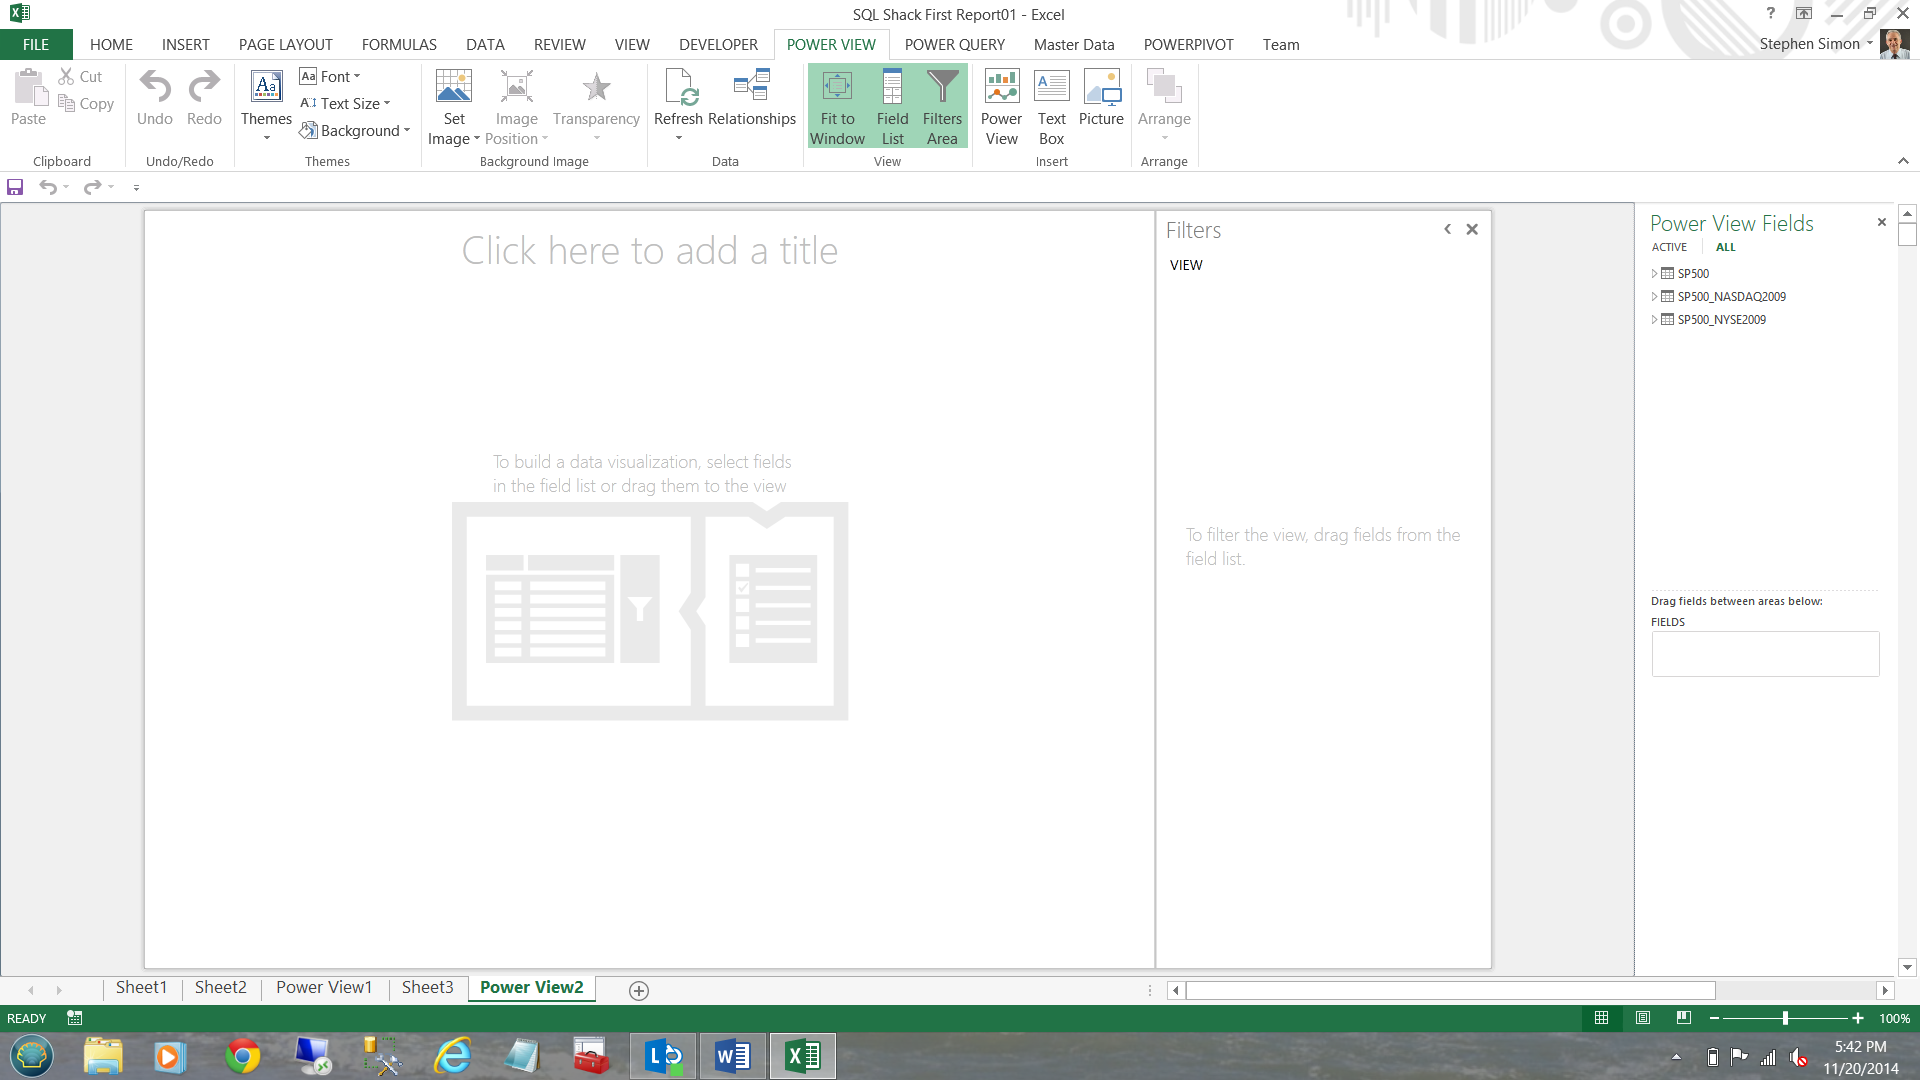
We are now taken to our ‘Power View Design’ screen. Note that the data entities from our SQL Server BISM project are waiting for us, on the right hand side of the screen.
现在,我们进入“ Power View设计”屏幕。 请注意,屏幕右侧SQL Server BISM项目中的数据实体正在等待我们。
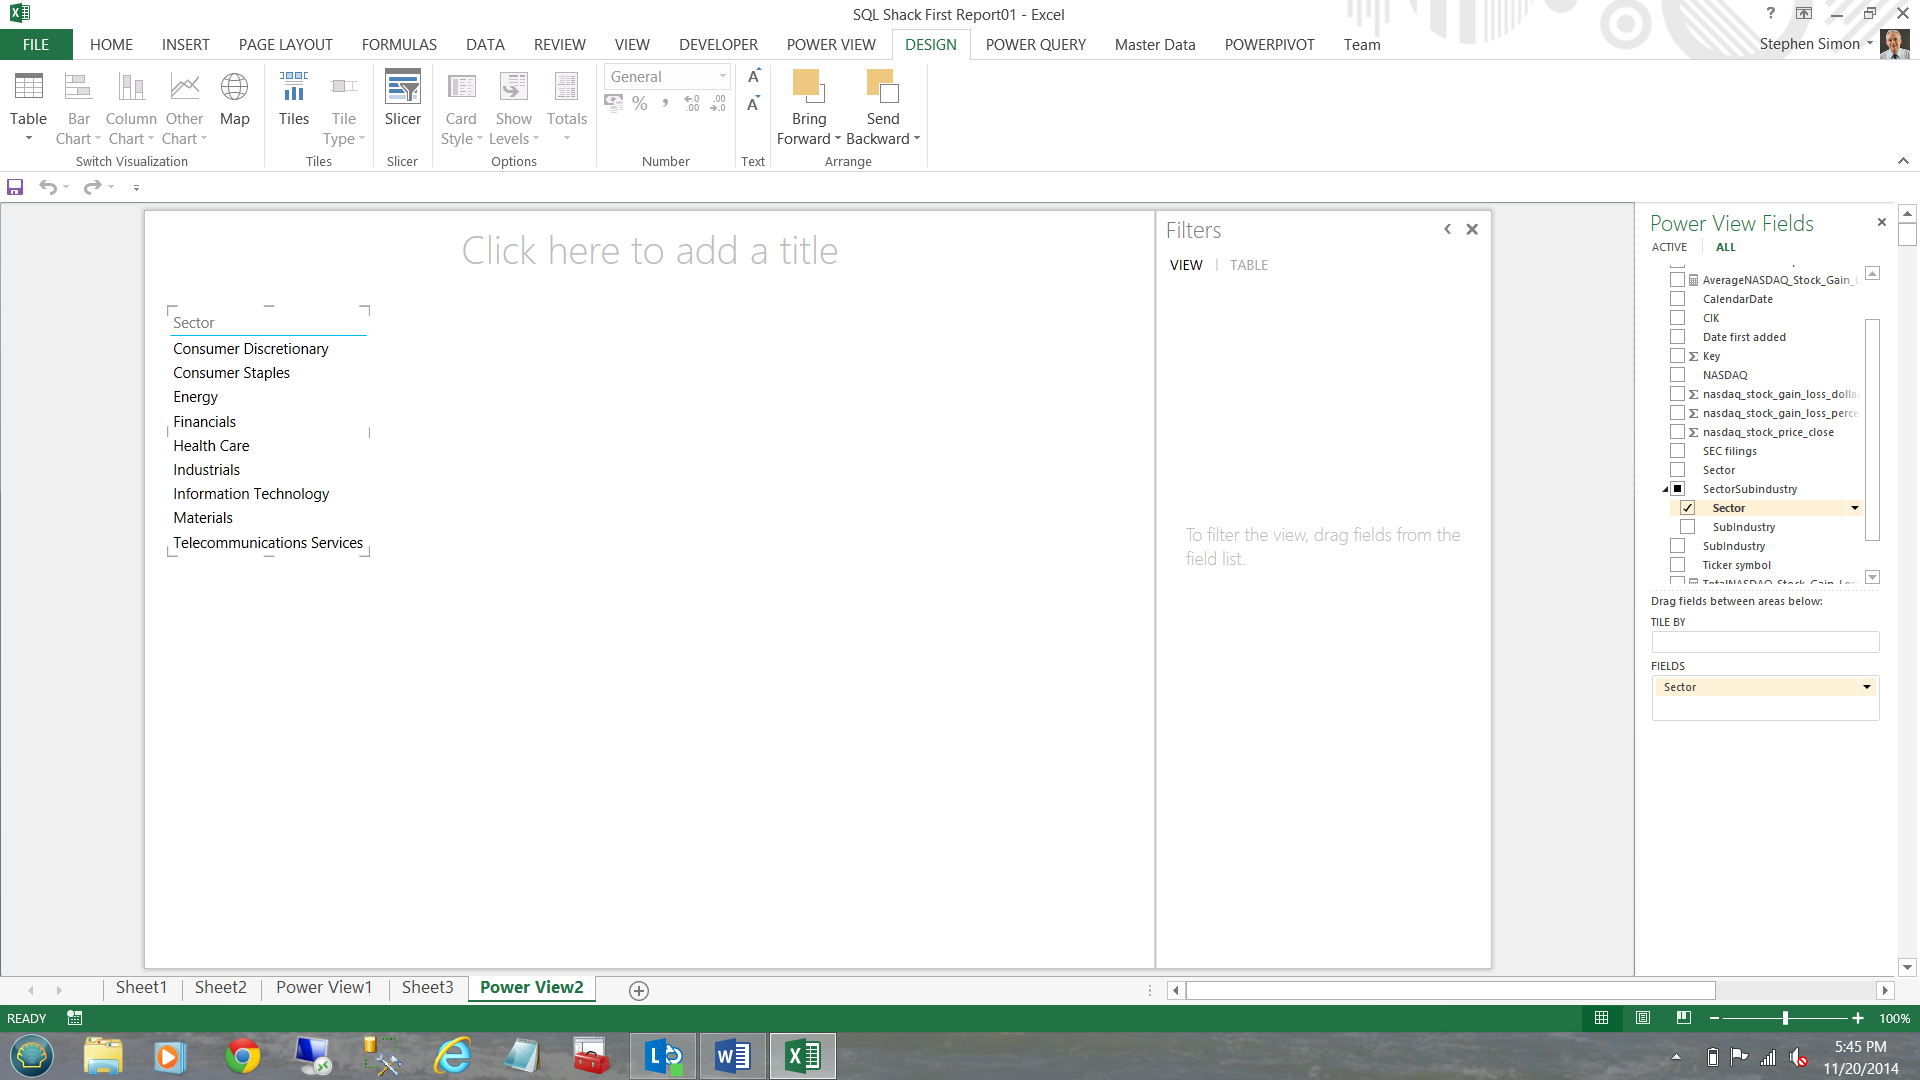
Opening the SP500 – NASDAQ entity, I add the sector from the dimension fields (see below).
打开SP500 – NASDAQ实体,从维度字段中添加扇区(请参见下文)。
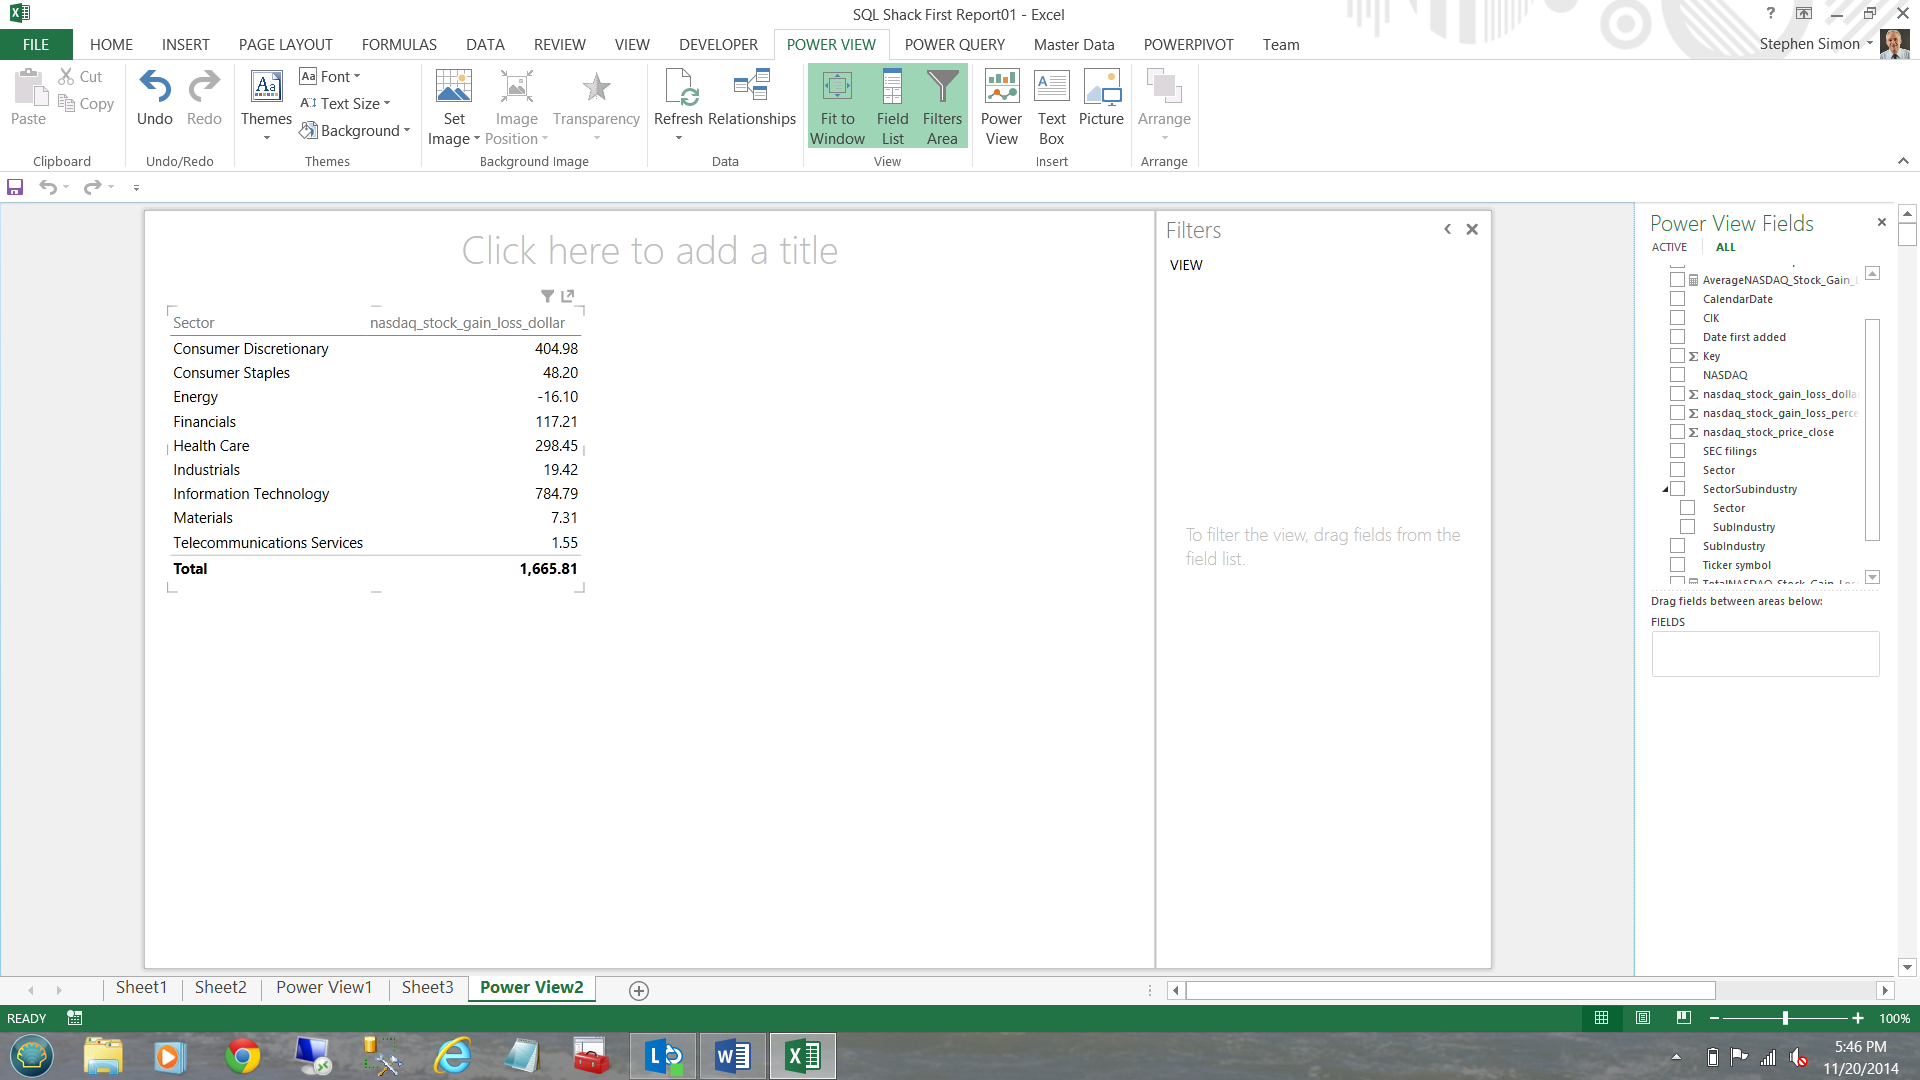
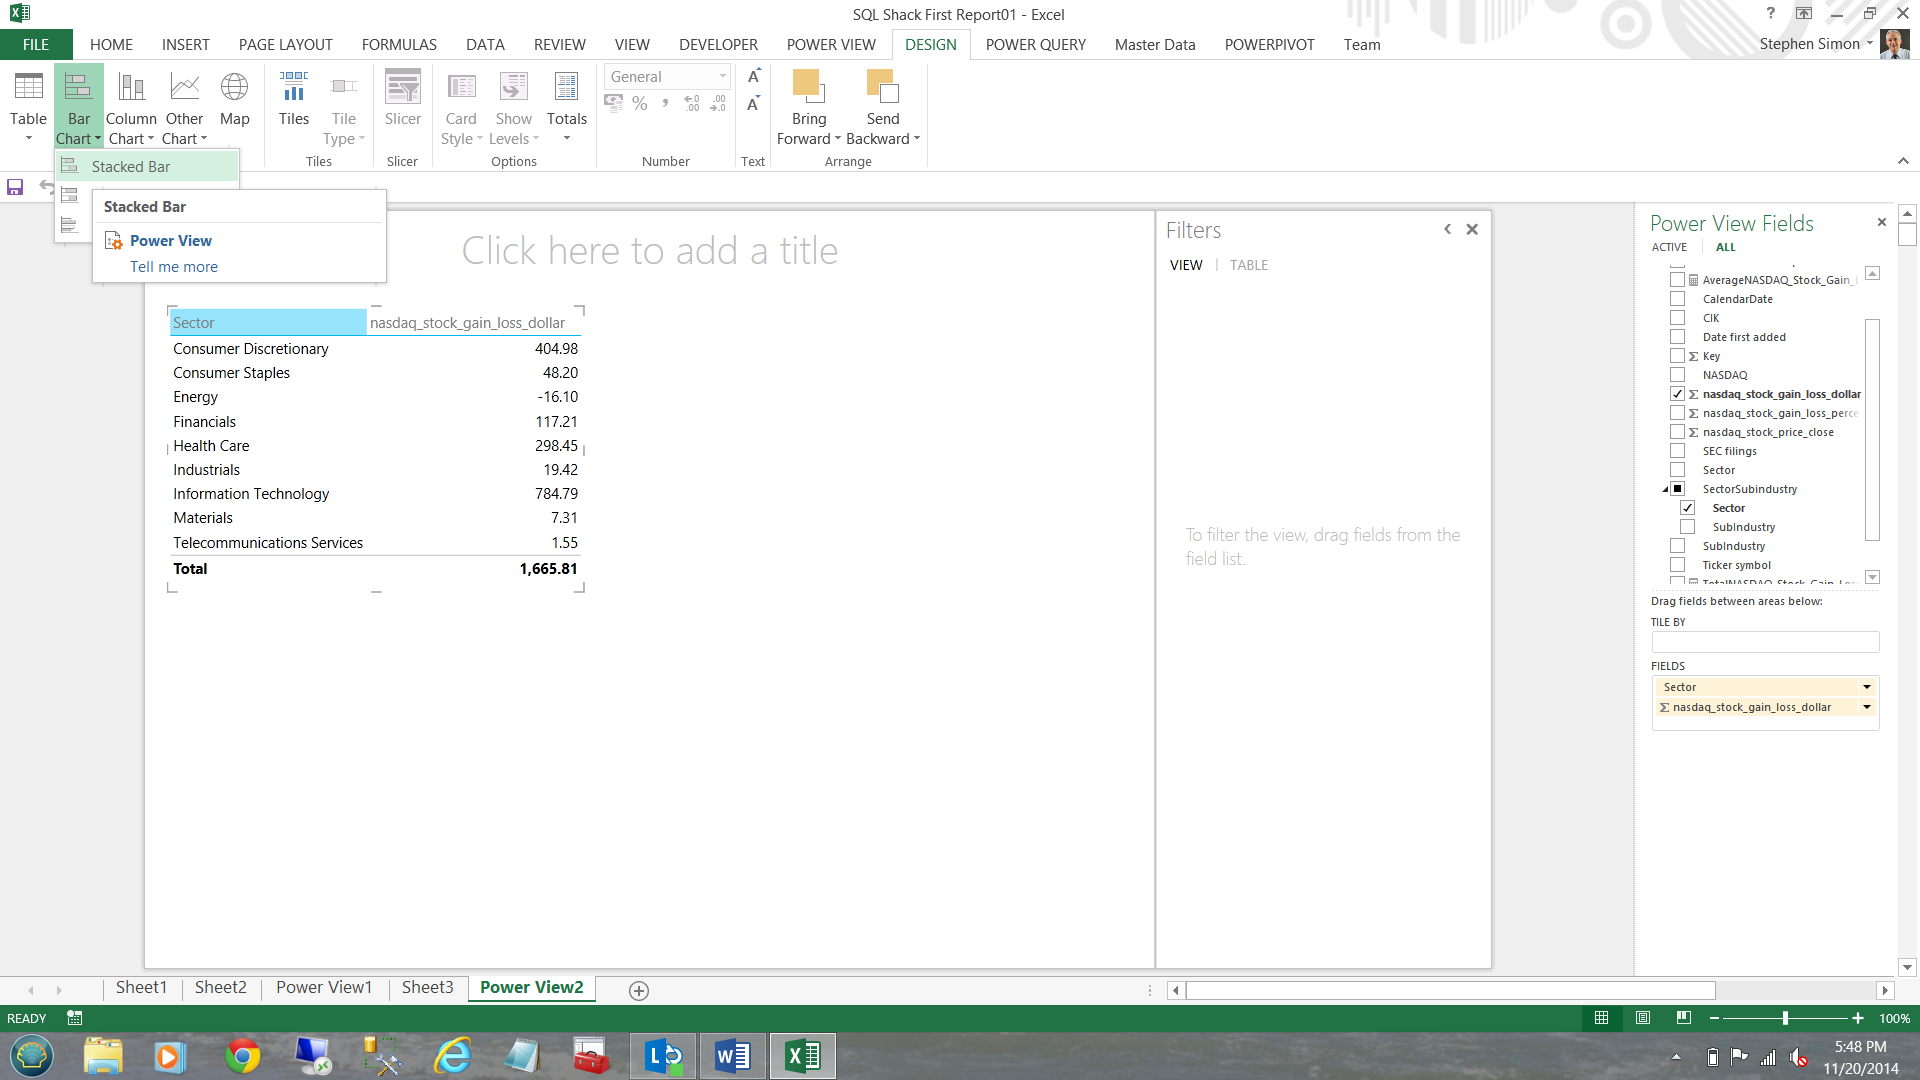
I now add the NASDAQ_STOCK_GAIN_LOSS_DOLLARS summary level totals (see below).
现在,我添加NASDAQ_STOCK_GAIN_LOSS_DOLLARS摘要级别总计(请参见下文)。
Now, I do not really like matrices thus I am going to convert the matrix to a chart.
现在,我不太喜欢矩阵,因此我将矩阵转换为图表。
I click ‘Design’, ‘Bar Chart’ and Stacked (see below).
我单击“设计”,“条形图”并堆叠(请参见下文)。
Our chart now appears.
现在出现我们的图表。
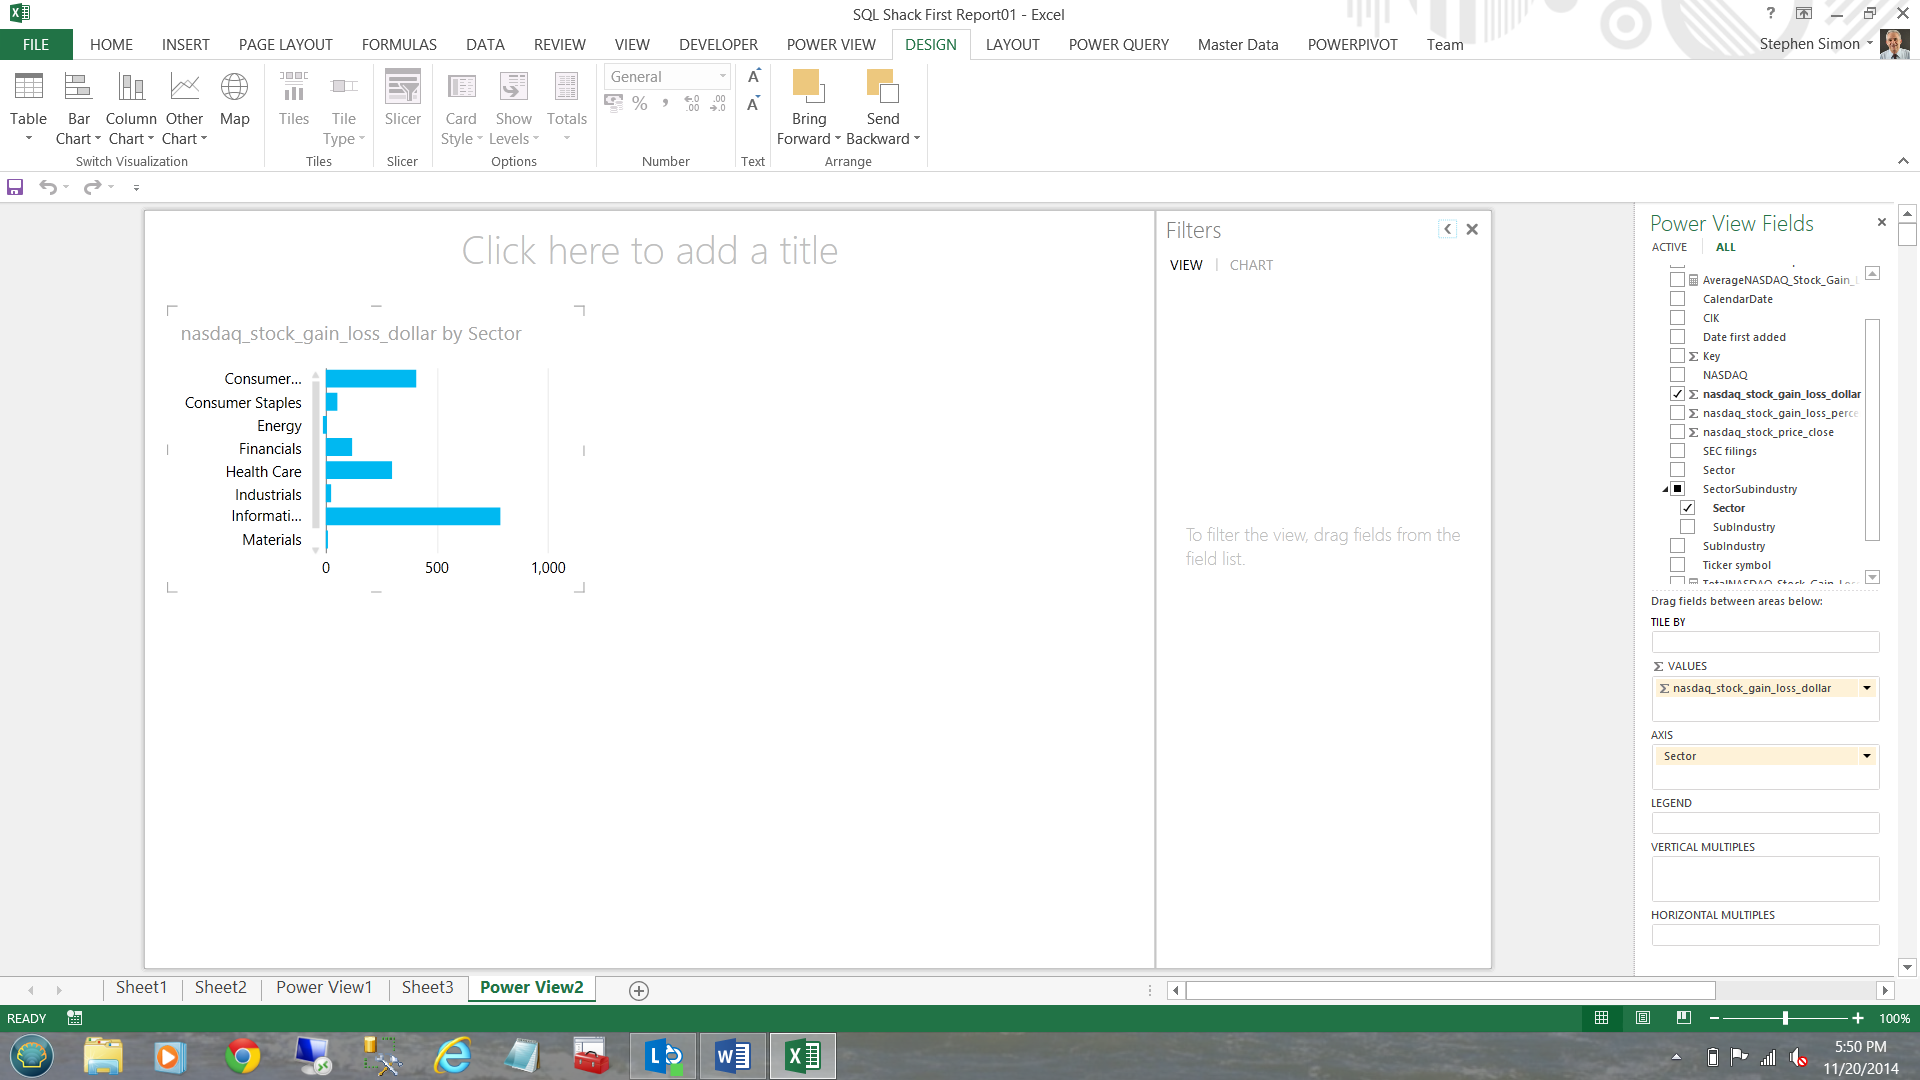
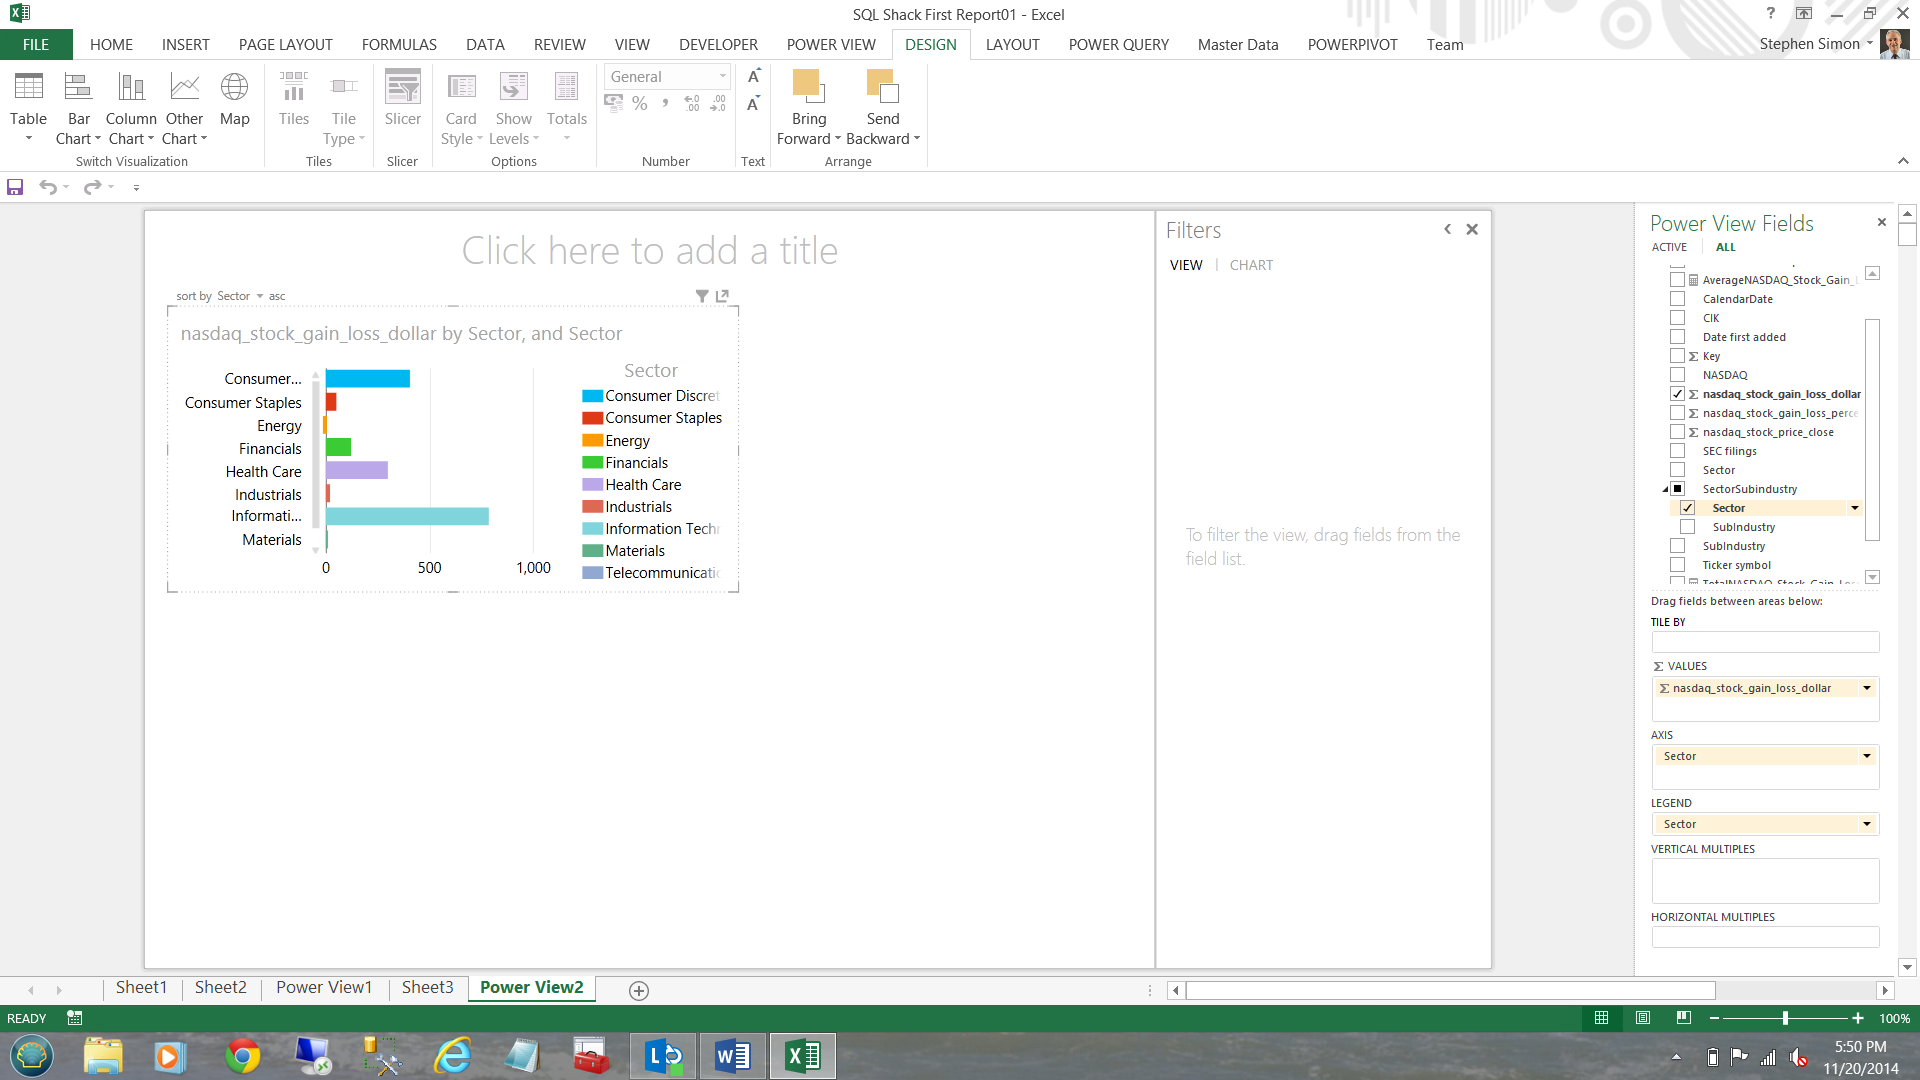
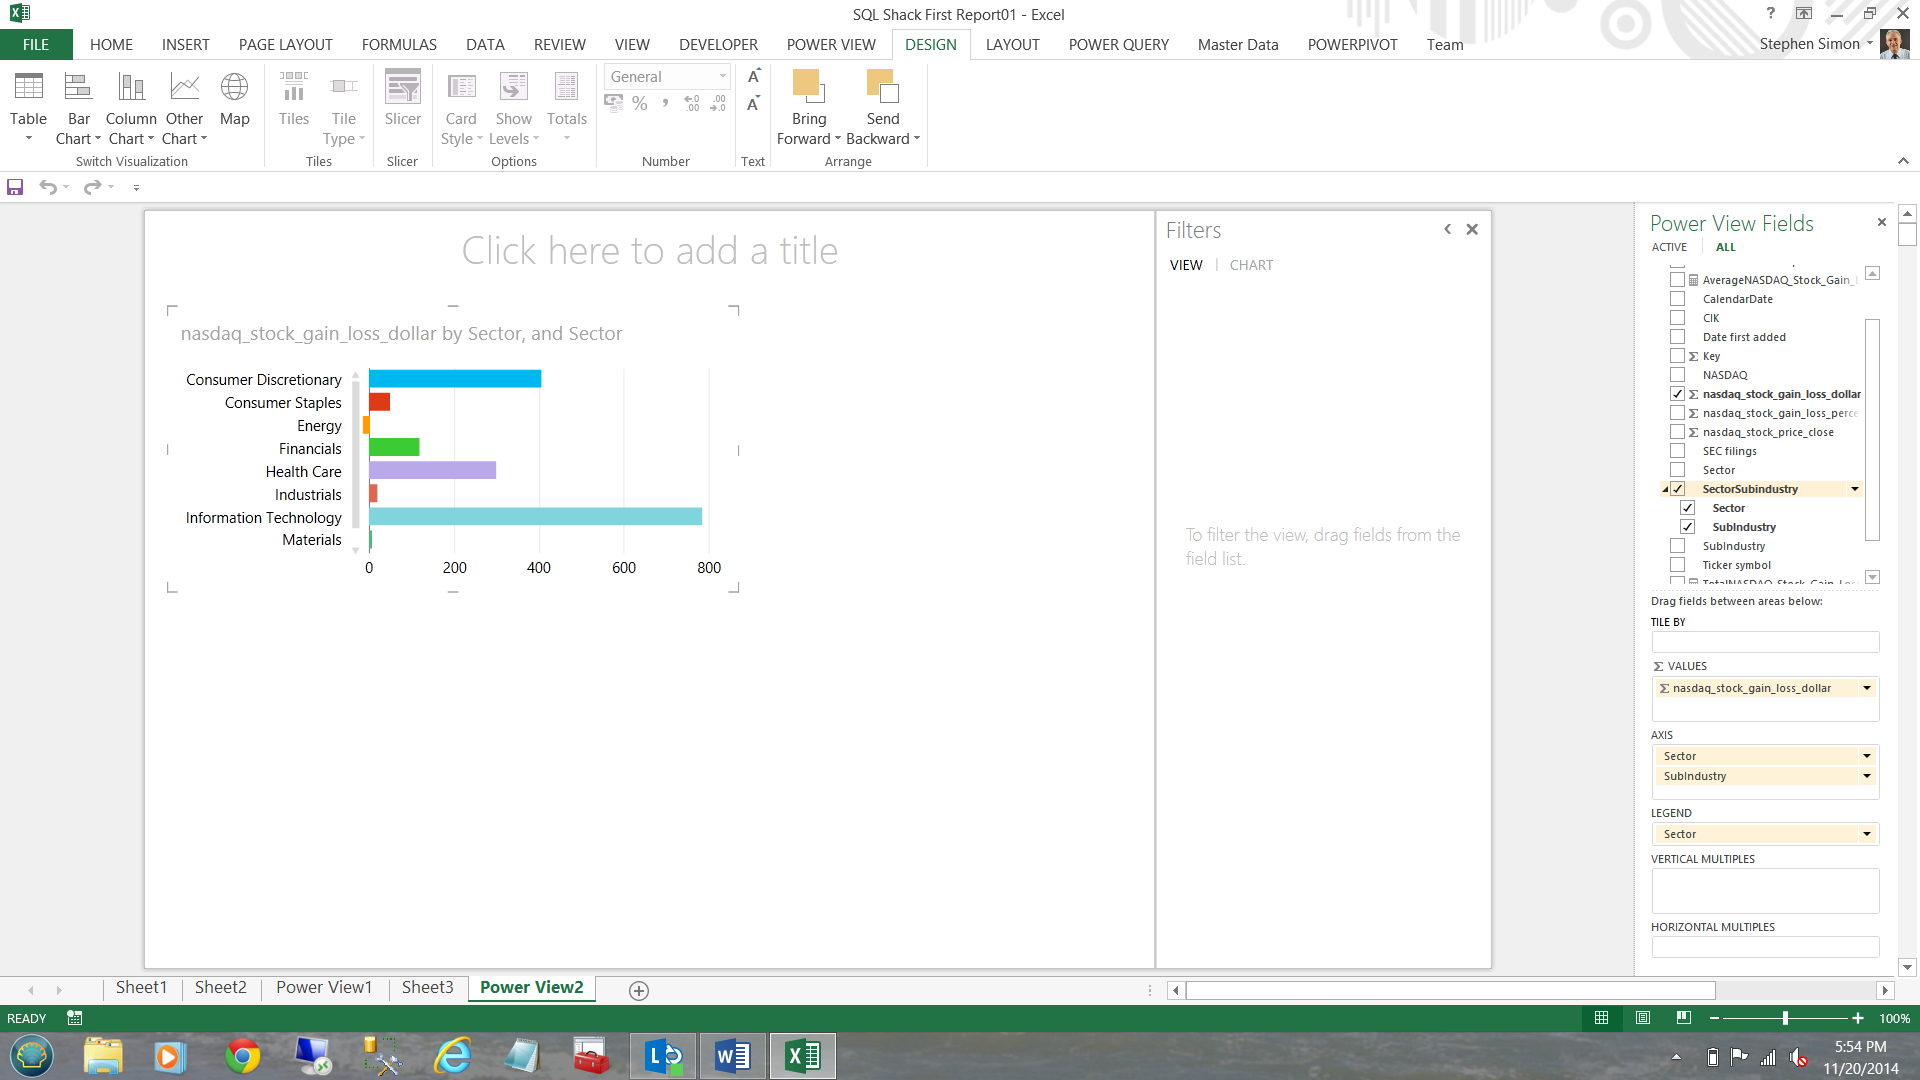
I drag the ‘Sector’ column to the ‘Legend’ box and the appearance of my chart changes (see below).
我将“部门”列拖到“图例”框中,图表的外观发生了变化(请参见下文)。
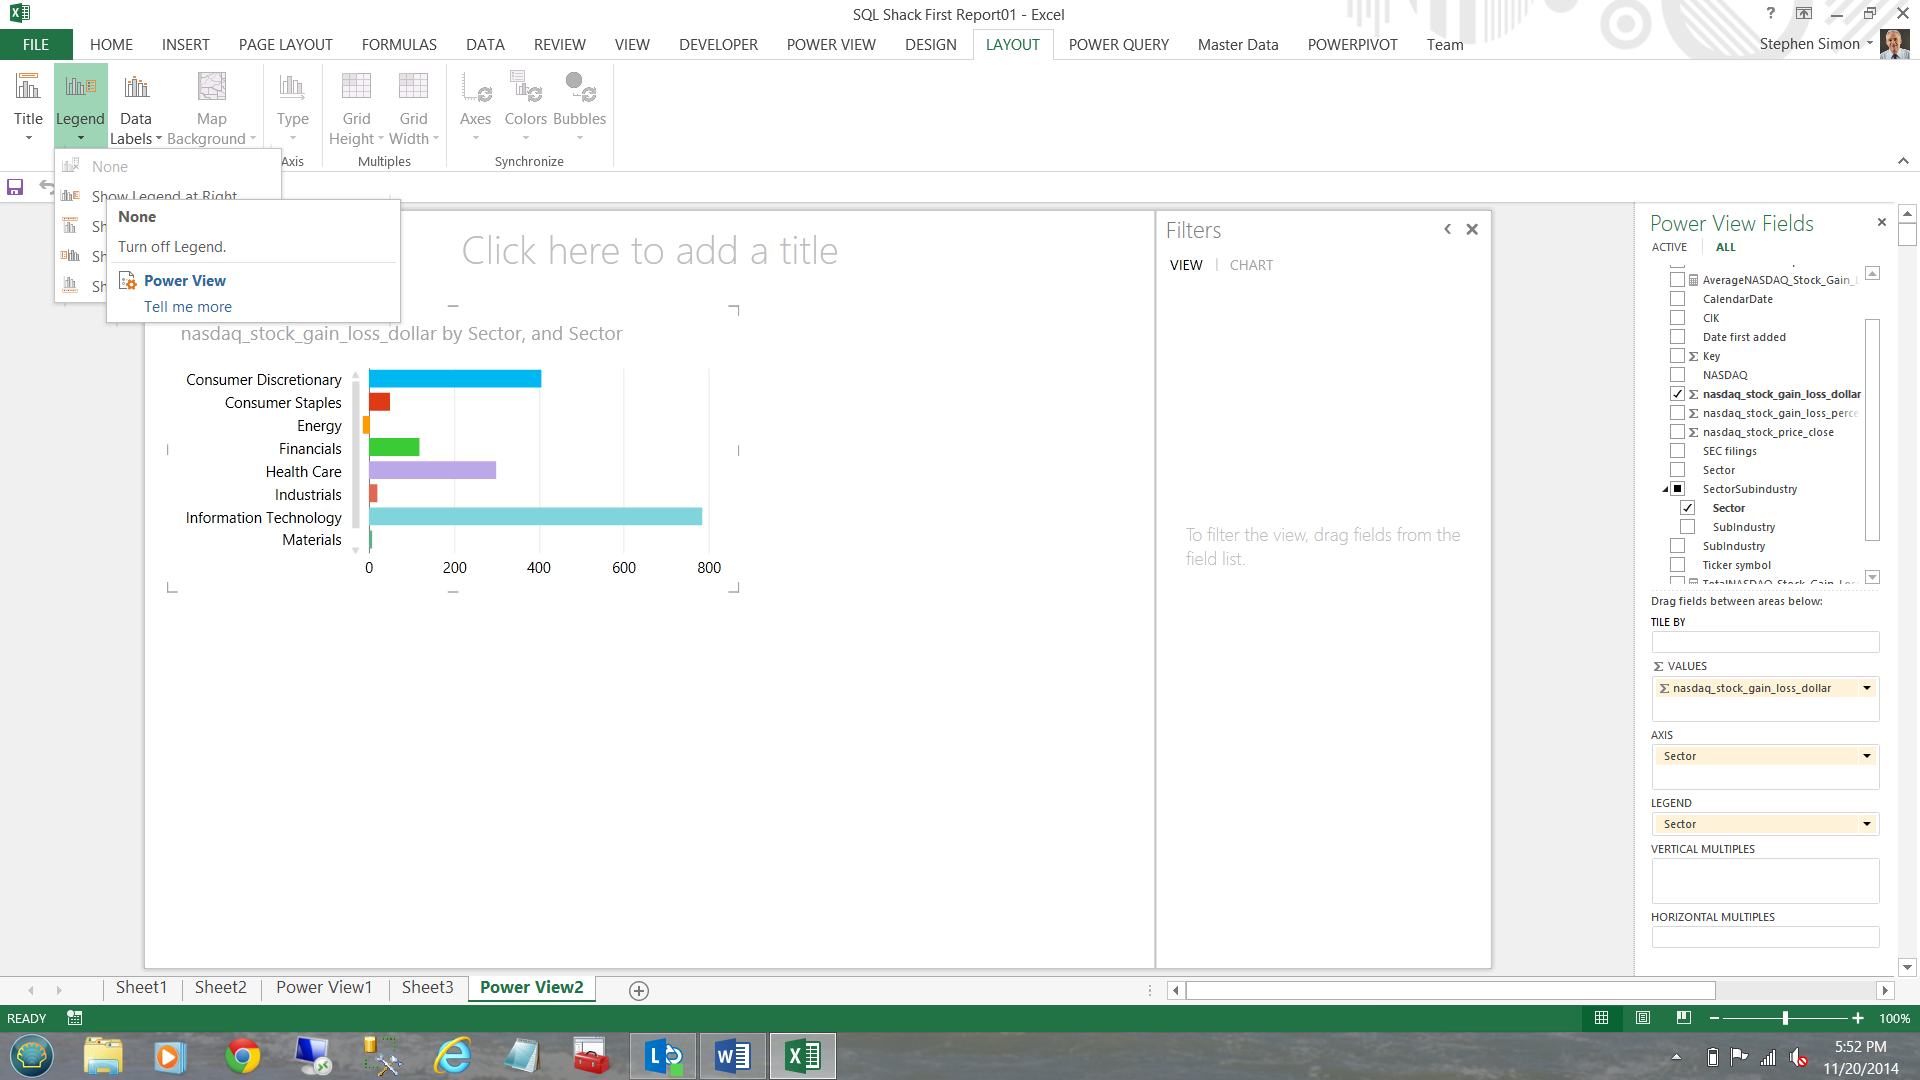
Clicking ‘Layout’ and ‘Legend’ and ‘None’ I am able to remove the legend box (to the right of the chart). The end result is that I now have more ‘real estate’ (see below).
单击“布局”,“图例”和“无”,我可以删除图例框(在图表的右侧)。 最终结果是我现在拥有更多的“房地产”(见下文)。
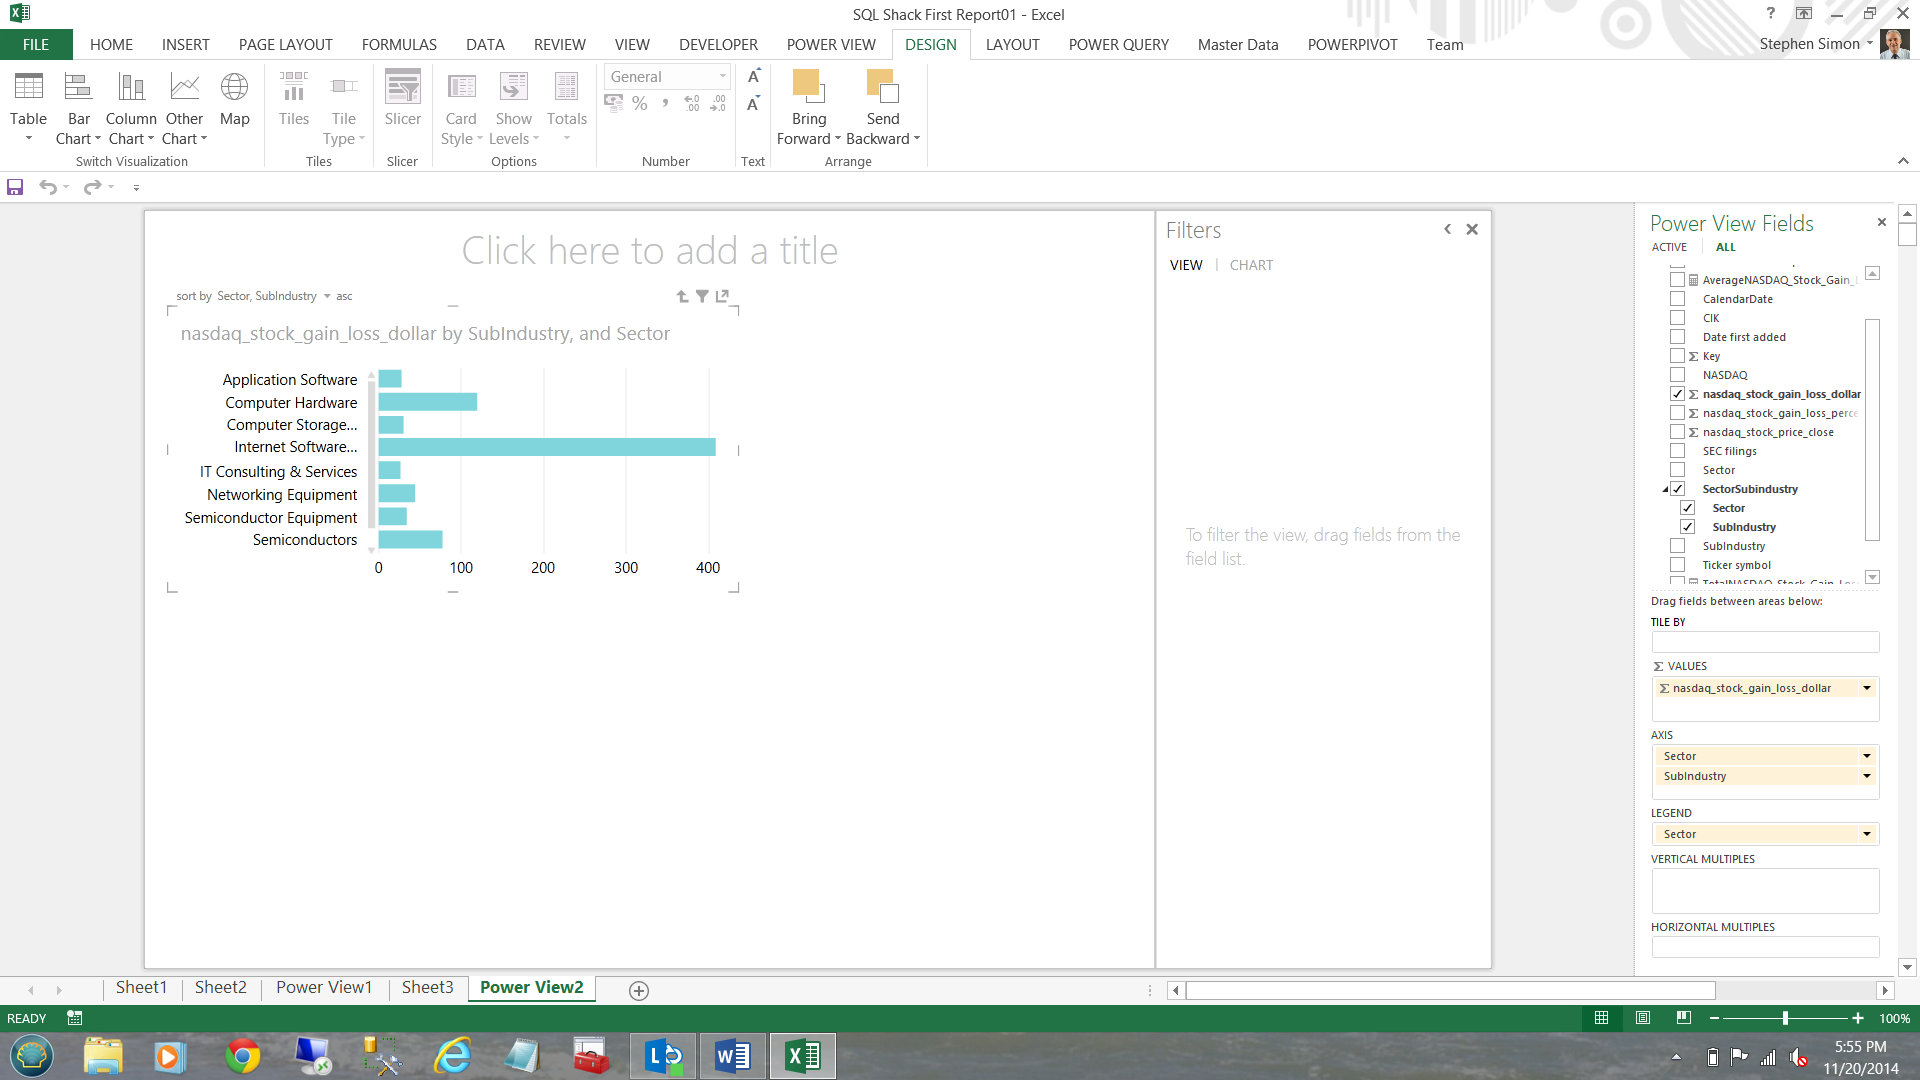
Having completed this I go back to my fields on the right and now check mark the ‘SectorSubindustry’ hierarchy (see below and to the right of the screen shot).
完成此操作后,我返回右侧的字段, 然后选中“ SectorSubindustry”层次结构 (请参见下面和屏幕截图的右侧)。
We have now completed our sector chart.
现在,我们已经完成了部门图表。
Wait a minute, what happens should I wish to see a particular sector broken down into sub-industries.
请稍等,我希望看到某个特定的行业细分为子行业时发生什么情况。
Double clicking on the ‘Information Technology’ sector (aquamarine) above enables us to drill through to the sub industries (see below).
双击上面的“信息技术”领域(海蓝宝石),使我们可以深入到子行业(请参阅下文)。
To return to the parent, one simply clicks the ‘up arrow’ immediately below the word ‘add’ in ‘Click here to add a title’
要返回父级,只需在“单击此处添加标题”中单击单词“添加”下方的“向上箭头”
This completes our very first Power View Report.
这样就完成了我们的第一个Power View报告。
使用地图 (Working with maps)
Often users perform ‘what if scenarios’ including looking at the demographics of their current markets. The client mentioned above was no exception. We shall now look at a variation on the same map based theme that I created for this client.
用户通常会执行“情景假设”,包括查看其当前市场的人口统计信息。 上述客户也不例外。 现在,我们将研究与我为此客户创建的基于地图的主题相同的变体。
To create a map based report, we shall create new query.
要创建基于地图的报告,我们将创建新查询。
The query may be constructed in a new workbook or within the same workbook that we have been using thus far.
可以在新工作簿中构造查询,也可以在到目前为止我们一直在使用的同一工作簿中构造查询。
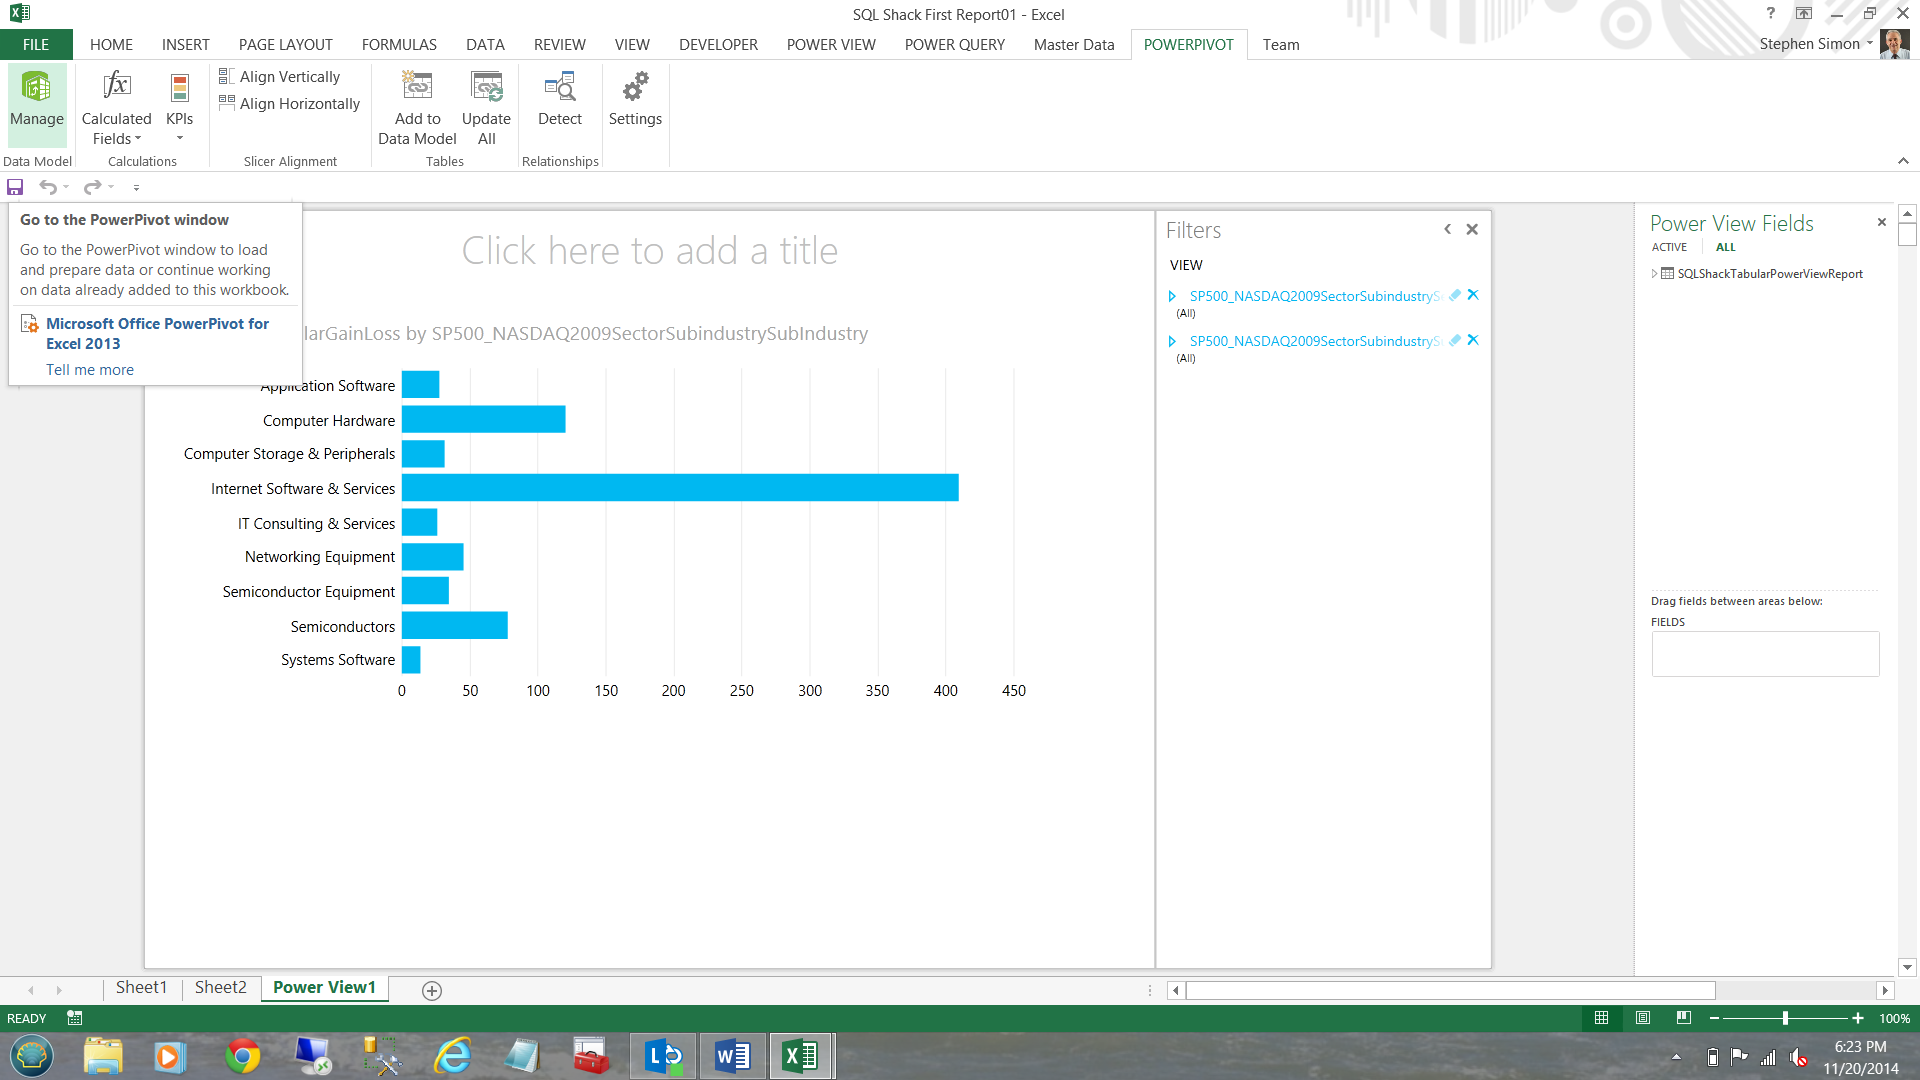
To start, I choose ‘PowerPivot’ and ‘Manage’.
首先,选择“ PowerPivot”和“管理”。
I choose an existing connection by selecting our ‘SQLShackTabularReportingModel’ (see below).
我通过选择“ SQLShackTabularReportingModel”来选择一个现有的连接(见下文)。
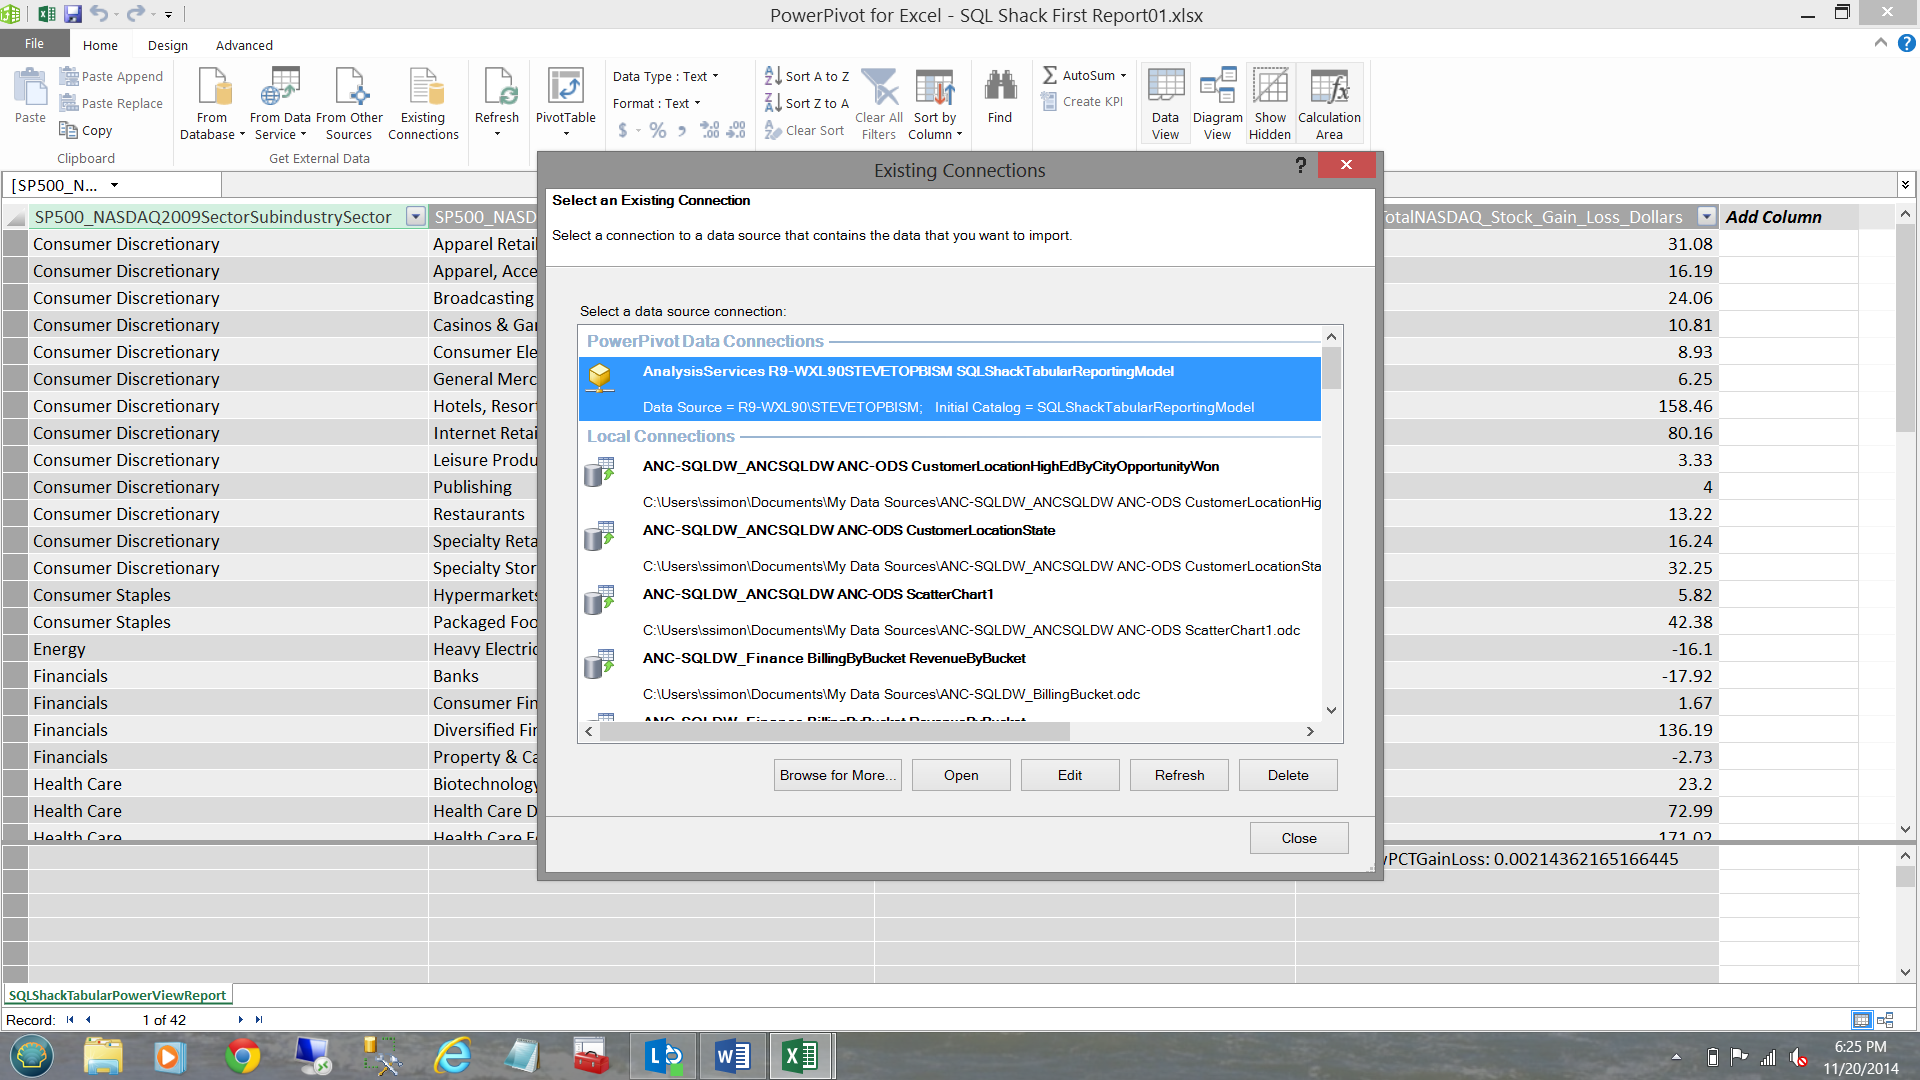
Clicking ‘Open’ our MDX query box opens. This is the same query box that we have seen above. Once again and as described above, I open the design box.
单击“打开”,我们的MDX查询框将打开。 这是我们上面看到的相同的查询框。 如上所述,我再次打开设计框。
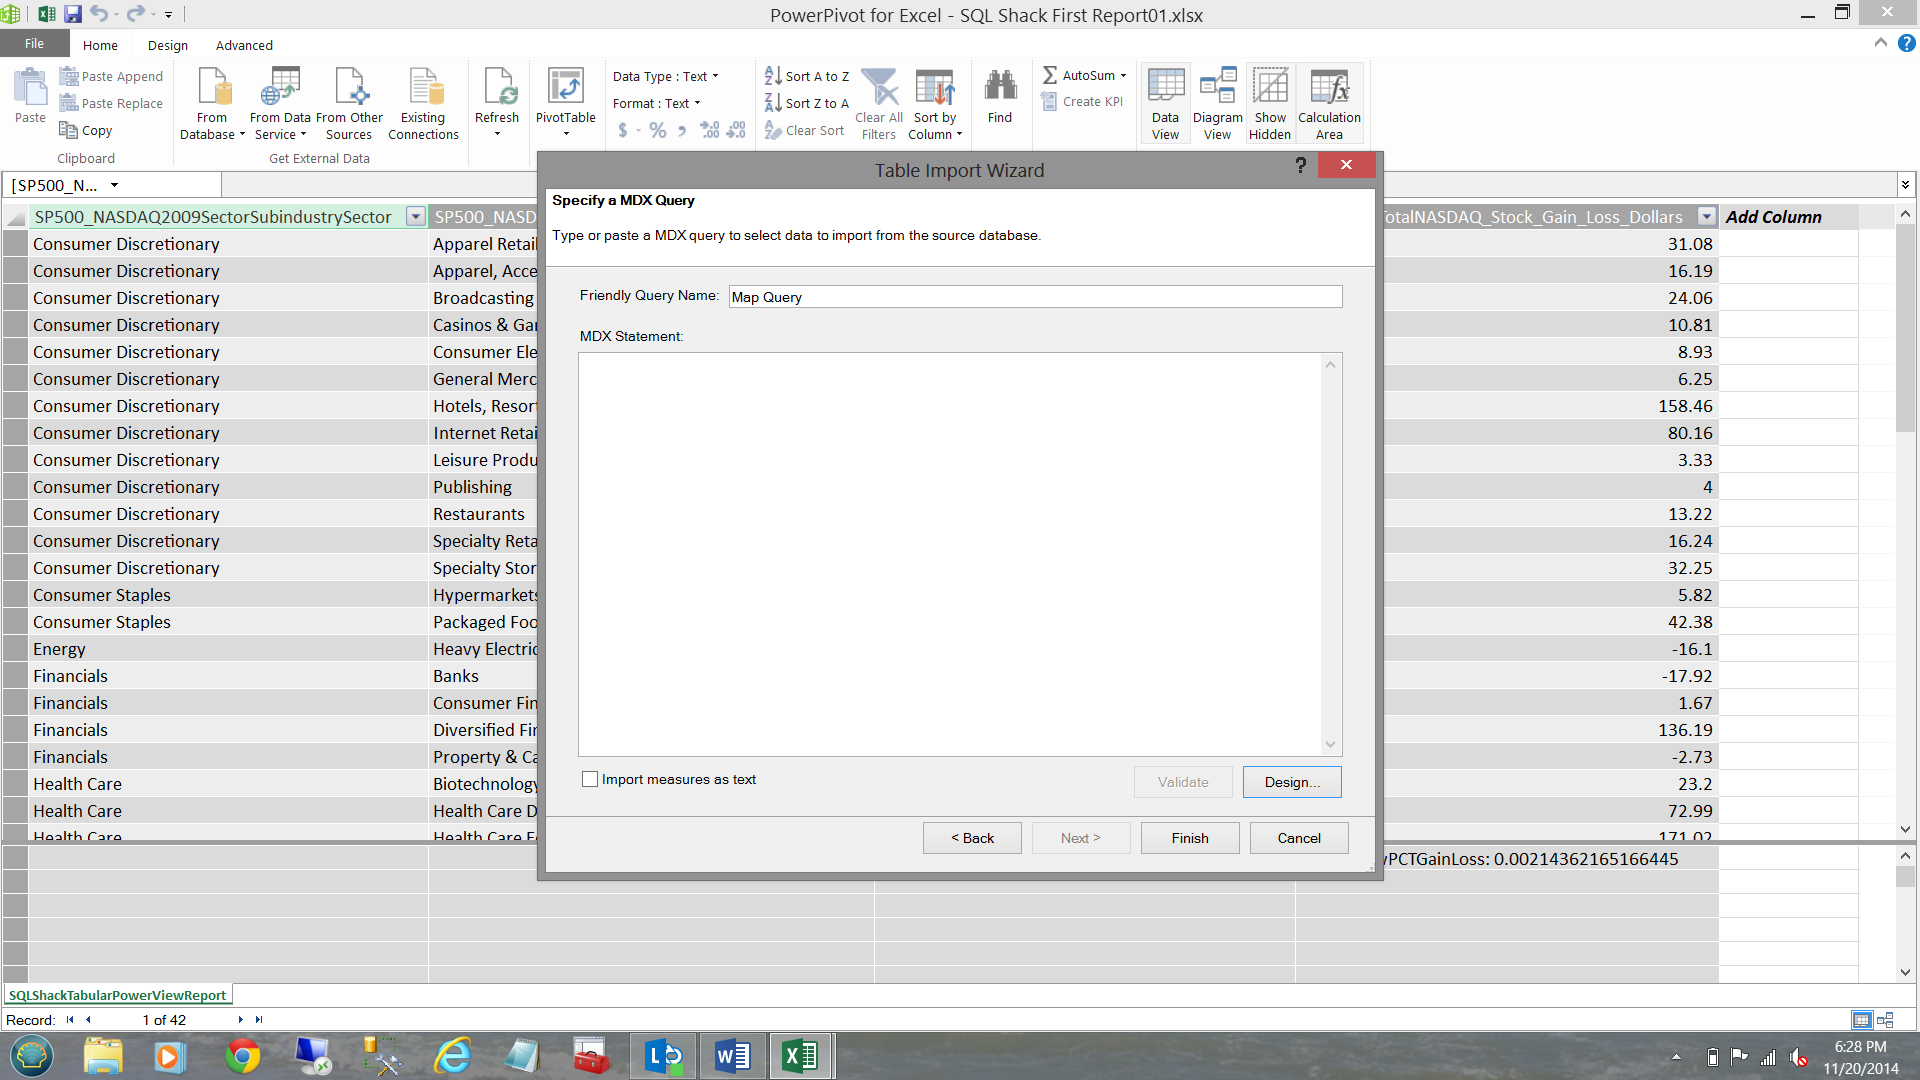
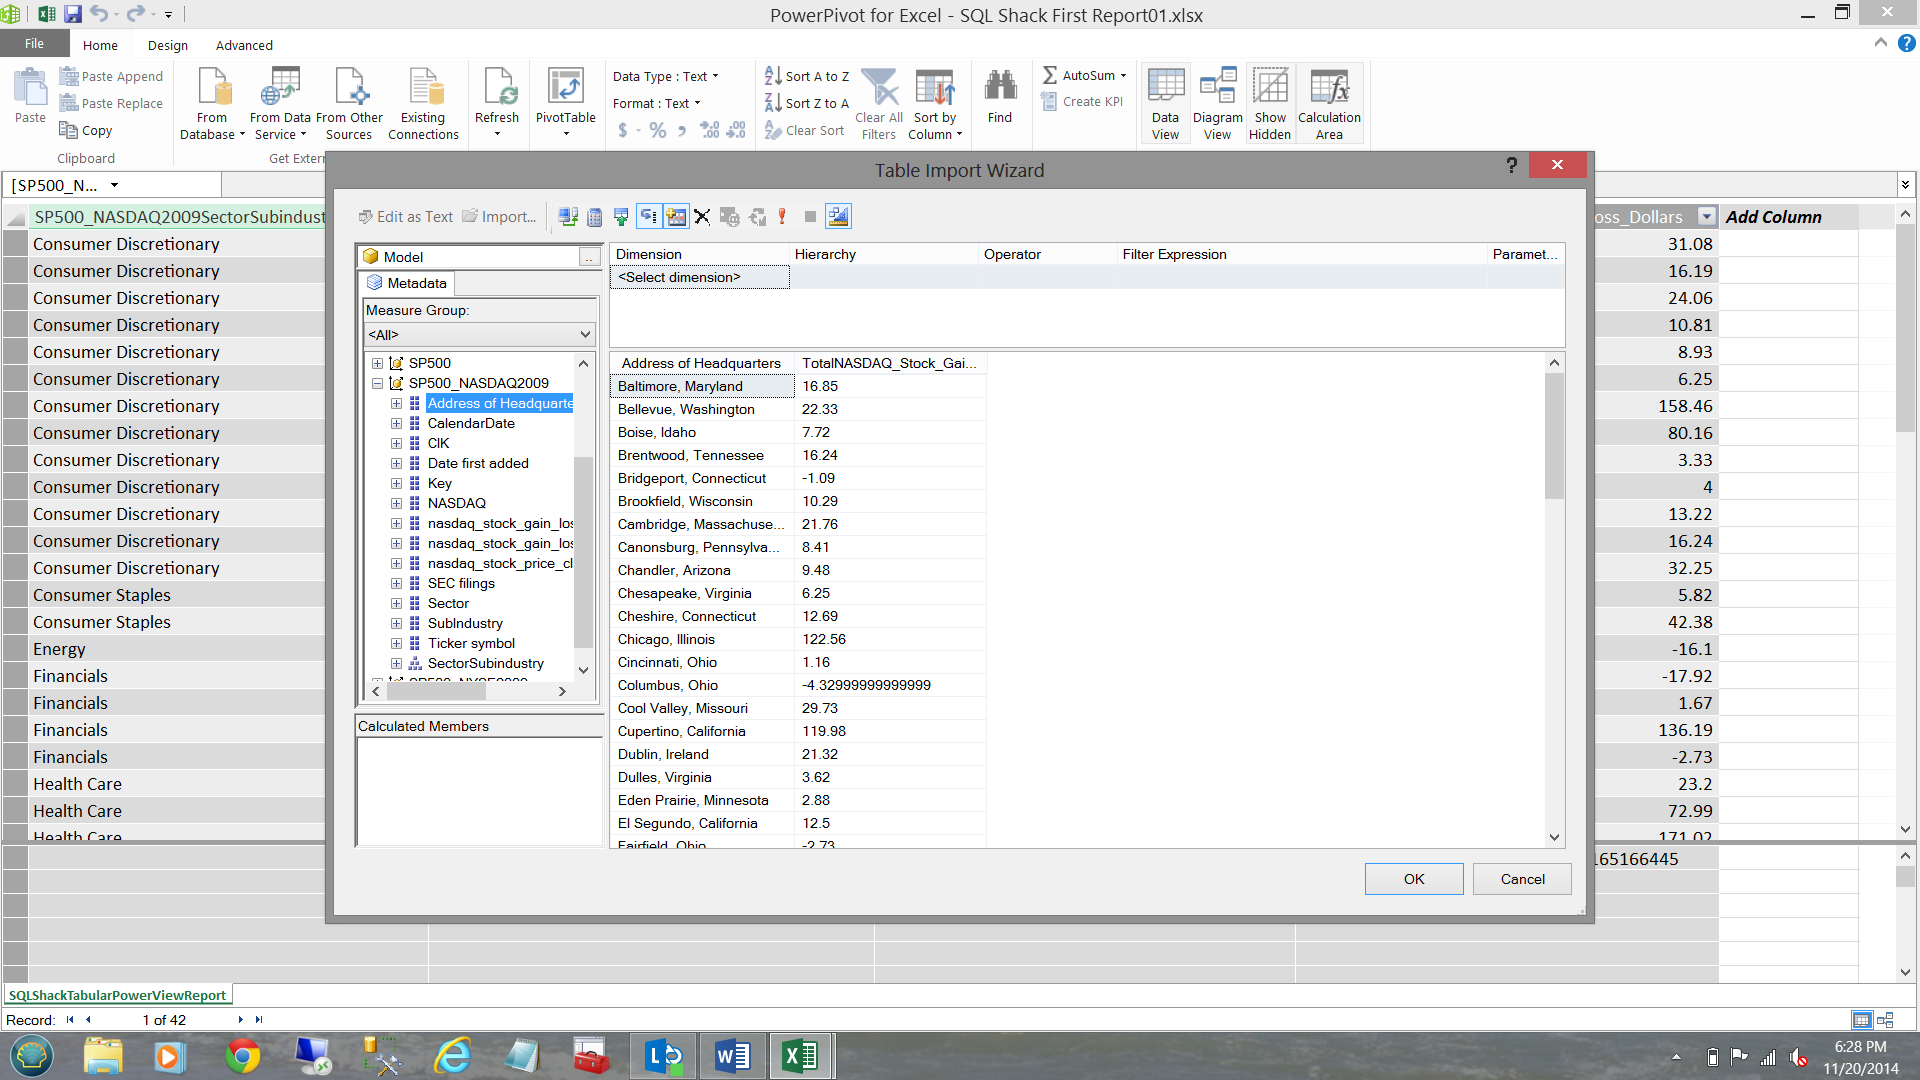
I drag ‘Address of Headquarters’ and ‘TotalNASDAQ_Stock_Gain_Loss_Dollars’ to the screen (see below).
我将“总部地址”和“ TotalNASDAQ_Stock_Gain_Loss_Dollars”拖到屏幕上(如下所示)。
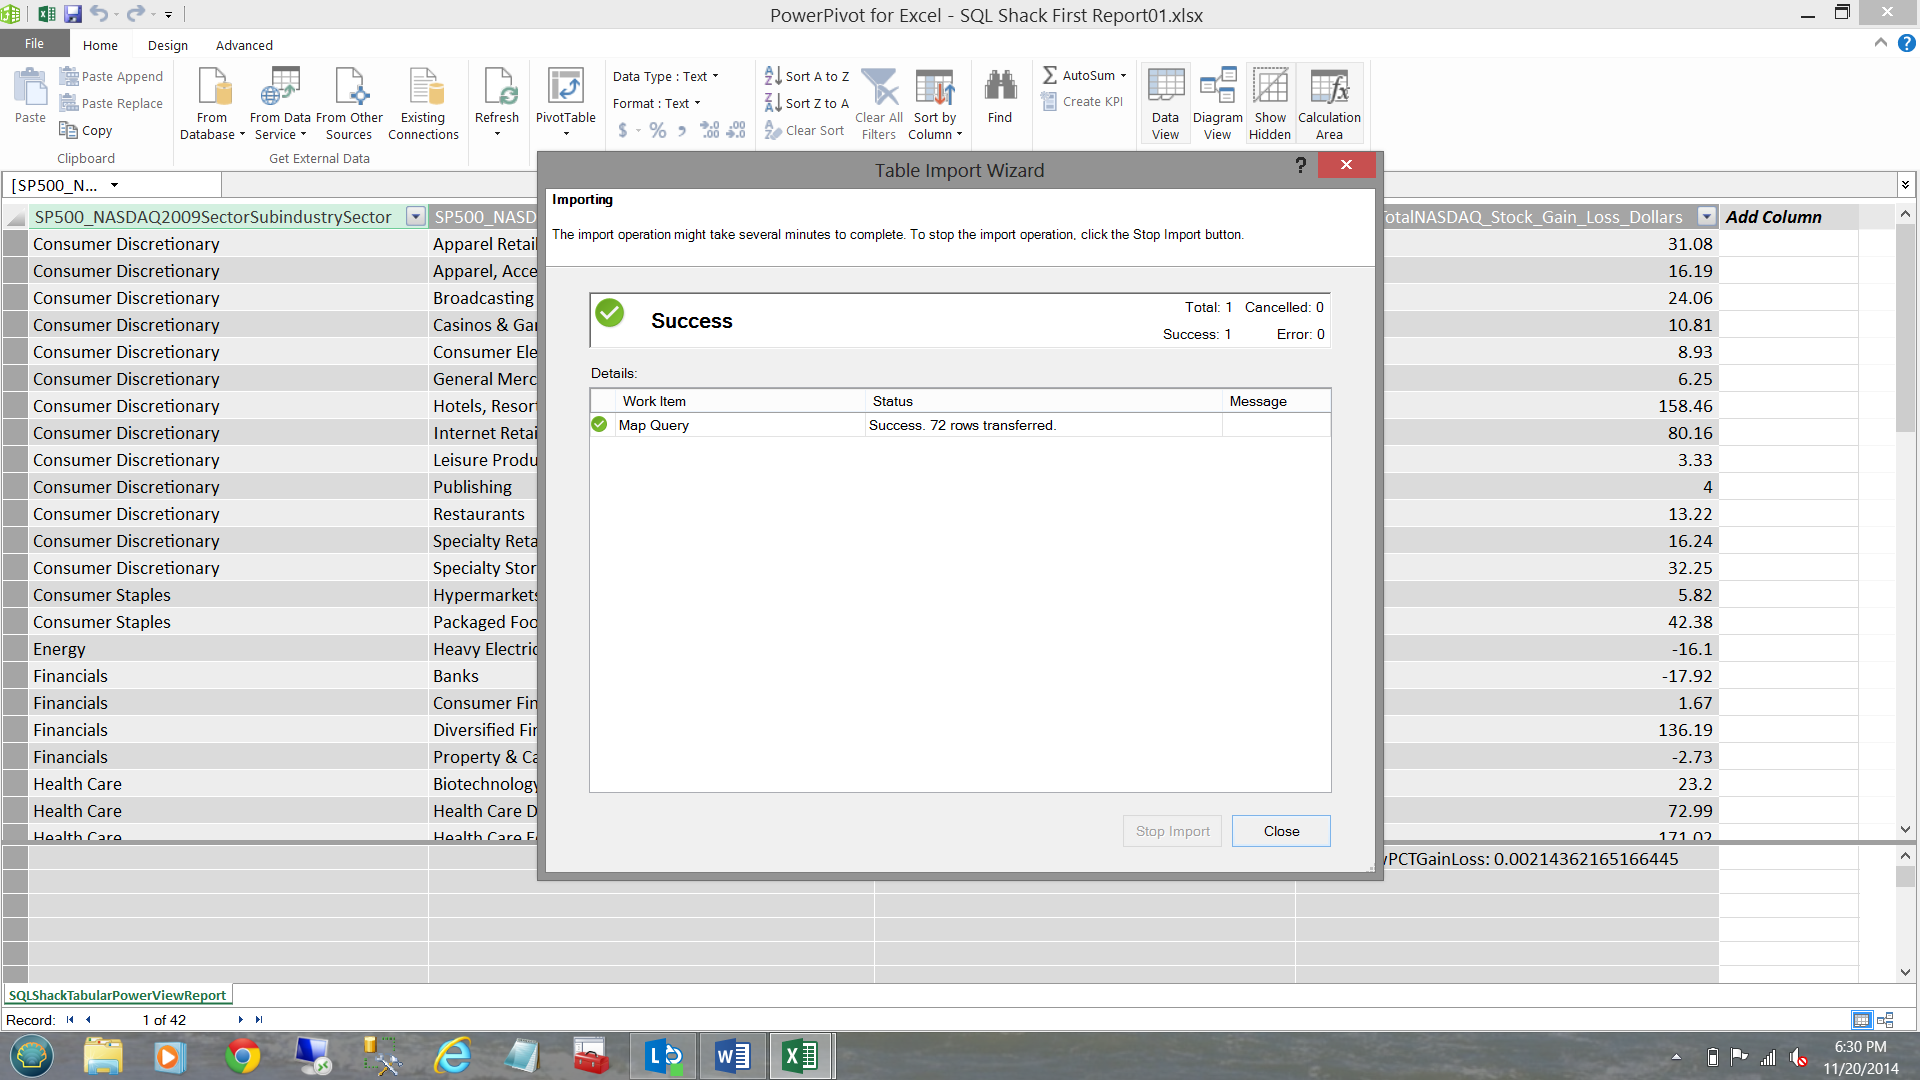
I complete the same process (as was previously discussed) by approving my selection and clicking ‘OK’. Once again I receive indications that all went well (see below).
通过批准选择并单击“确定”,我完成了相同的过程(如前所述)。 我再次收到一切进展顺利的迹象(见下文)。
I exit now exit from PowerPivot.
我退出,现在从PowerPivot退出。
创建我们的第一个基于地图的报告。 (Creating our first map based report.)
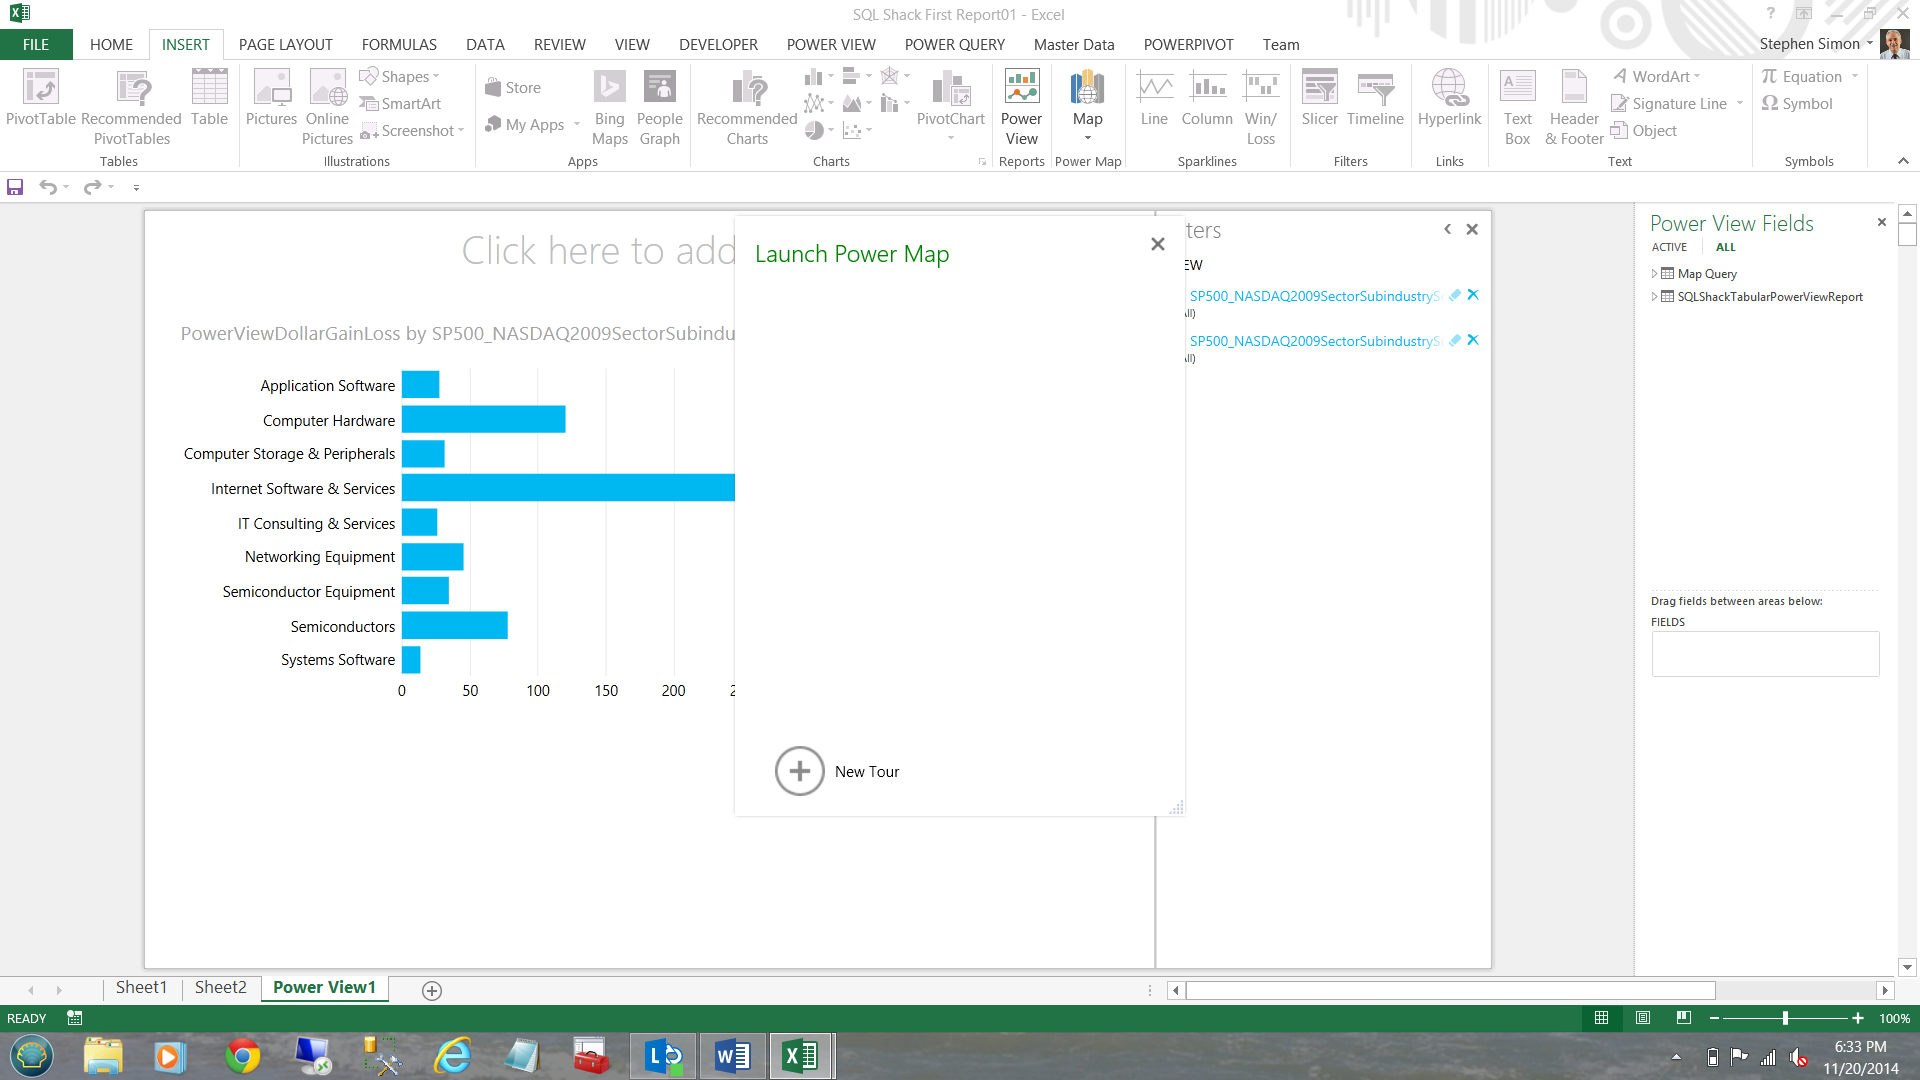
Selecting ‘Insert’ from the main menu and ‘Map’, I am able to launch Power Map.
从主菜单中选择“插入”,然后选择“地图”,我就可以启动Power Map。
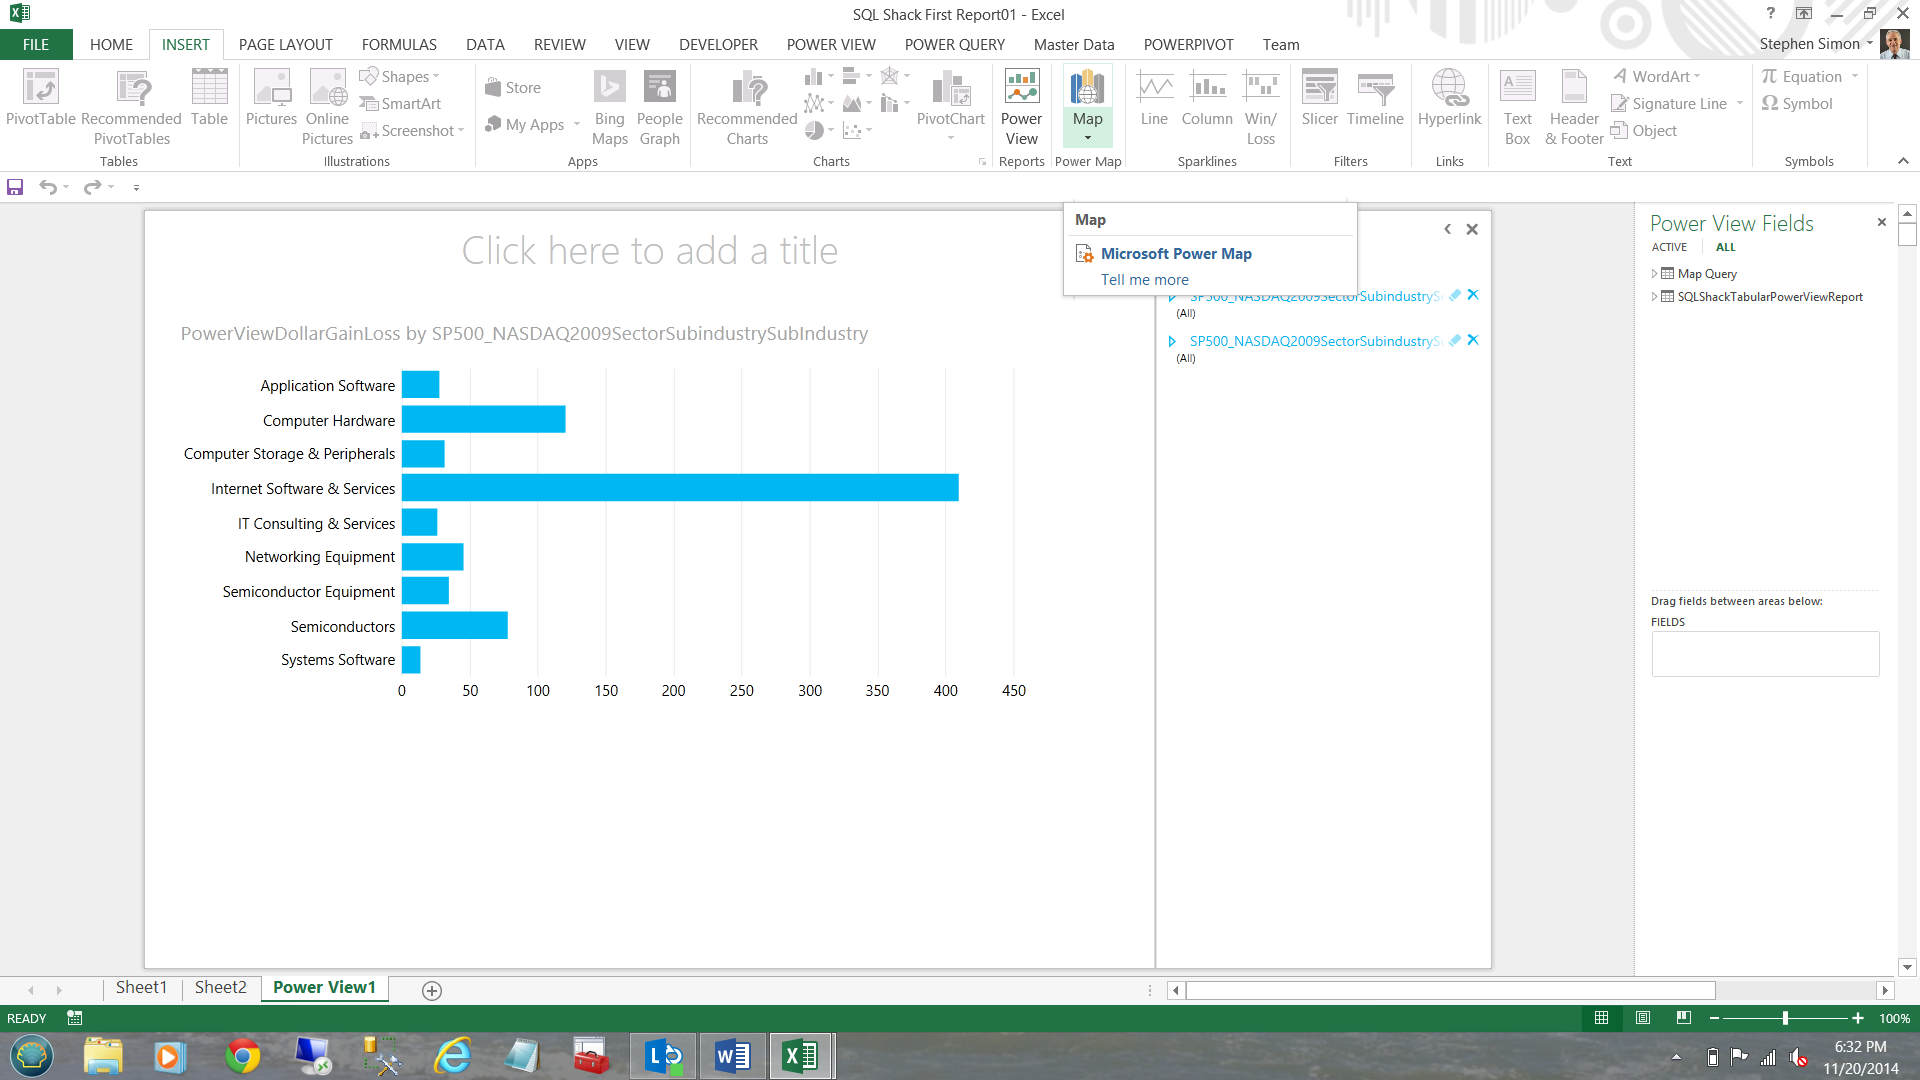
I click ‘New Tour’ (see below).
我点击“新游览”(见下文)。
Power Map will now appear on your screen.
Power Map现在将出现在屏幕上。
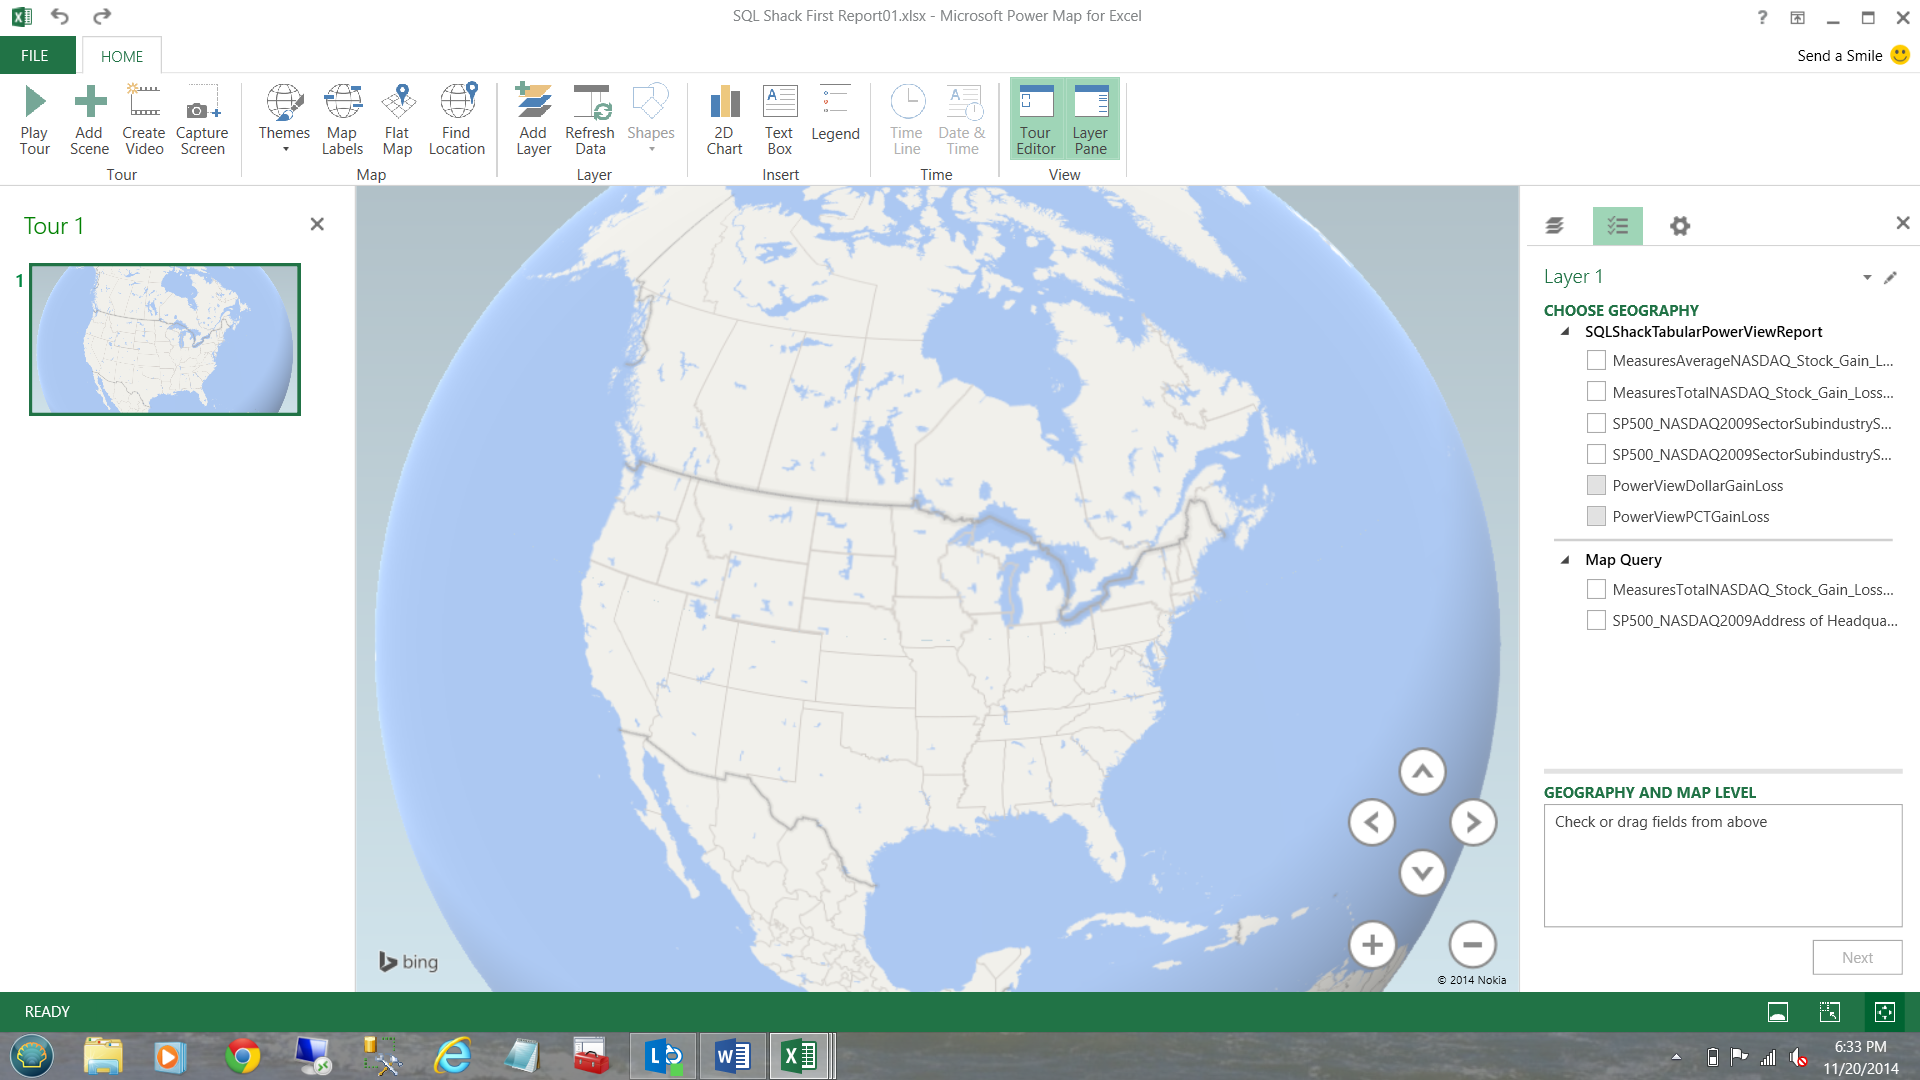
I drag the ‘SP500_NASDAQ2009Address of Headquarters’ into the ‘Geography and Map Level’ box (see below).
我将“ SP500_NASDAQ2009总部地址”拖到“地理和地图级别”框中(请参见下文)。
NOTE that the locations of the varied headquarters appear as blue dots on the map of the US.
请注意,变化的总部所在地在美国地图上显示为蓝点。
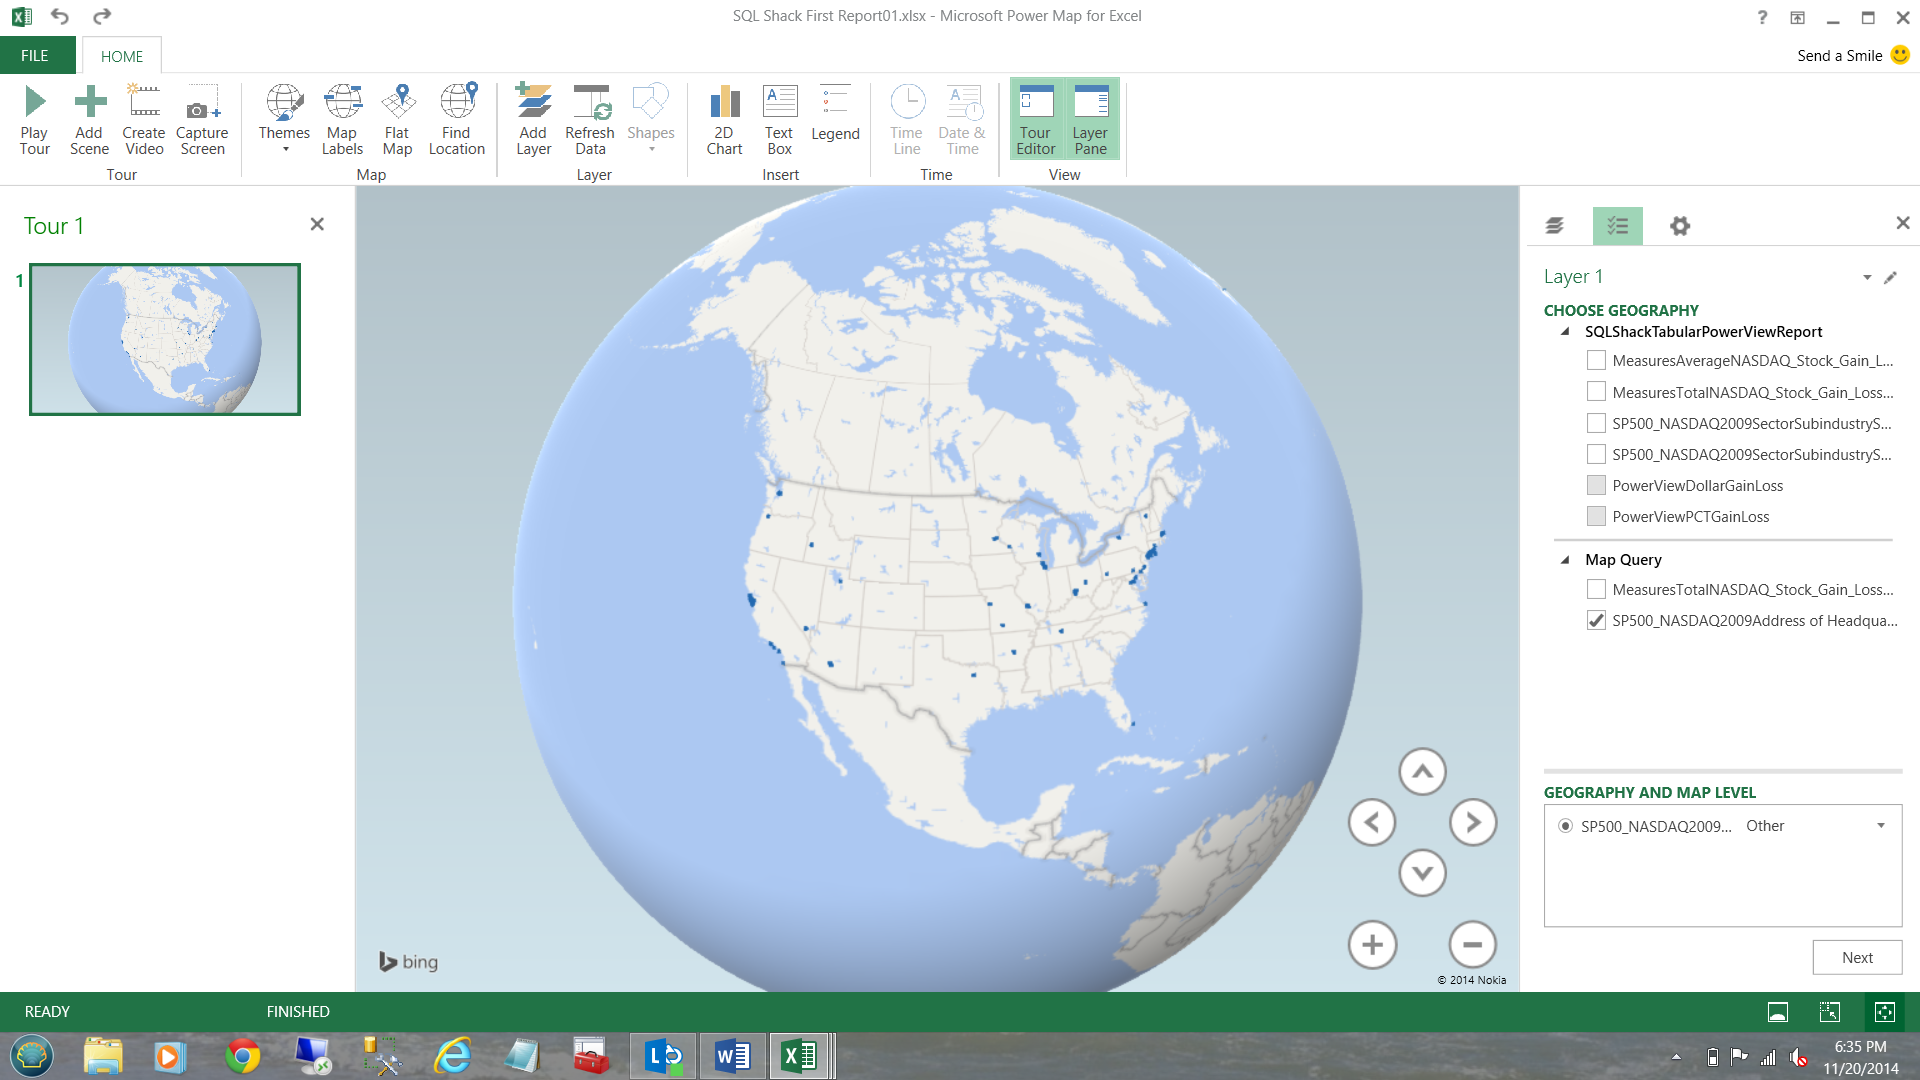
Clicking next, I am able to add the financial figures.
单击下一步,我能够添加财务数据。
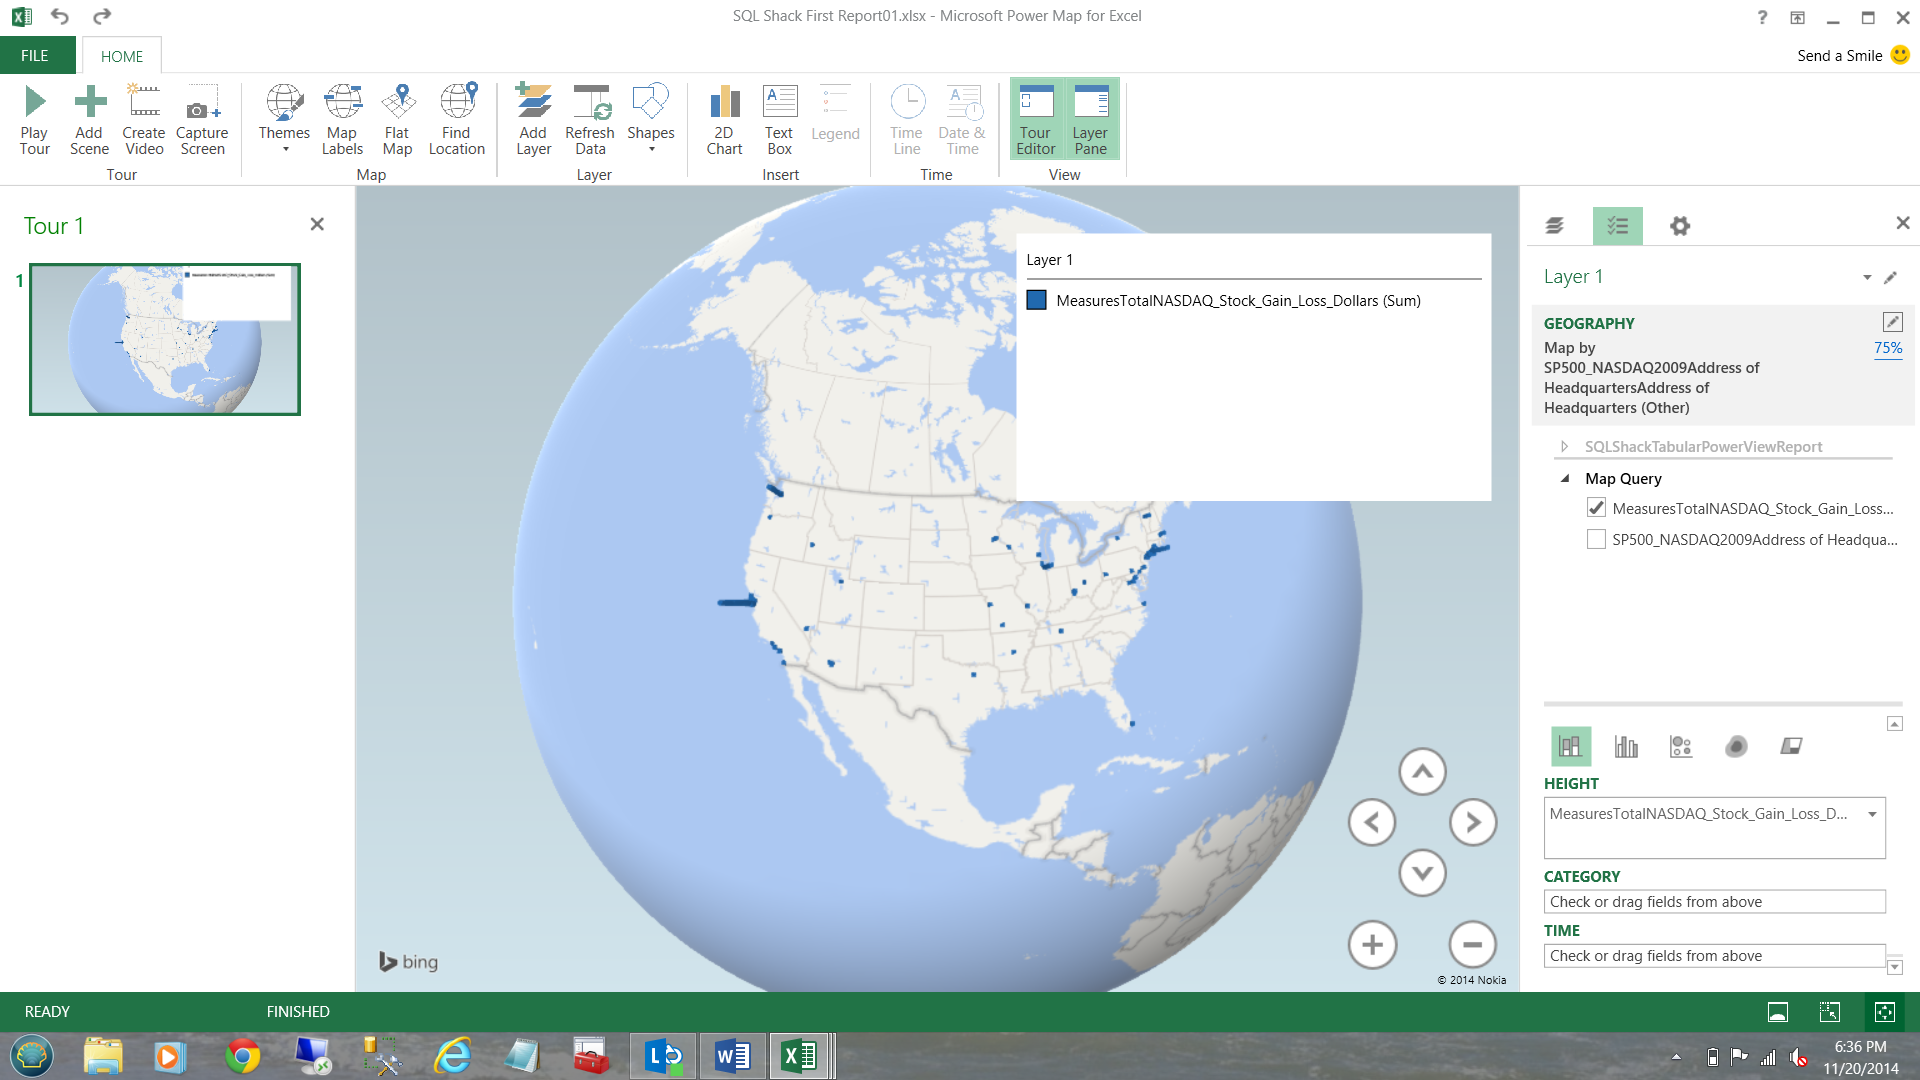
Once again, NOTE the way the value of the measures are shown on the map. If one zooms in, the relief is really cool. Oh yes!!! A ‘gotcha’: you must be connected to the internet for the Bing maps to be rendered.
再次注意在地图上显示度量值的方式。 如果放大一个,那浮雕真的很酷。 哦,是的! 一个“ 陷阱 ”:您必须连接到互联网才能呈现Bing地图。
This completes our quick venture into the world of Power BI.
这完成了我们对Power BI世界的快速冒险。
结论 (Conclusions)
Working with folks from the financial world presents challenges even at the best of times. From practical experience, these folks are more receptive to change when we can work within their comfort zone (a spreadsheet).
即使在最佳时机,与金融界人士的合作也带来了挑战。 根据实际经验,当我们可以在他们的舒适区域内工作时(电子表格),这些人更愿意接受变化。
The new tabular model (BISM) introduced with SQL Server 2012 has the same look and feel as conventional spreadsheets, but provides much more flexibility including reporting capabilities to a plethora of front end GUI’s. These include Excel, SQL Server Reporting Service and reports hosted on SharePoint.
SQL Server 2012引入的新表格模型(BISM)具有与常规电子表格相同的外观,但提供了更大的灵活性,包括向众多前端GUI的报告功能。 其中包括Excel,SQL Server报告服务和SharePoint上托管的报告。
This completes our quick venture into the super world of Power BI. I certainly hope that I have raised more questions than answers.
这完成了我们快速进入Power BI超级世界的冒险。 我当然希望我提出的问题多于答案。
Until the next time, happy programming!
直到下一次,编程愉快!
有用的参考 (Useful references)
Getting started using solely Excel and Office 365
The links to the freely available source data that I have used above may be found on this site. As a caveat, should you try to work through the exercise beware many parts do not function as they should. Finally this exercise is NOT SQL Server based.
我上面使用的免费可用源数据的链接可以在此站点上找到。 需要注意的是,如果您尝试通过练习进行操作,请注意,许多部件均无法正常运行。 最后,本练习不是基于SQL Server的。
翻译自: https://www.sqlshack.com/design-map-based-report-using-bi-semantic-model-excel/
墨鏡的bism


 1700
1700

 被折叠的 条评论
为什么被折叠?
被折叠的 条评论
为什么被折叠?
 到【灌水乐园】发言


