


 本文介绍了如何使用Azure Data Studio的SQL Notebook功能和DBATools PowerShell模块,来创建和使用诊断查询以解决SQL Server性能问题。通过执行一系列查询,收集关于SQL Server实例的详细信息,如版本、核心计数、内存、配置值、AlwaysOn AG状态、硬盘延迟等,帮助DBA快速定位和解决问题。
sql azure 语法
This article prepares a handy SQL Notebook for DBAs. You can use this notebook to troubleshoot performance issues and for getting SQL Server instance details.
本文为DBA准备了一个方便SQL Notebook。 您可以使用此笔记本来解决性能问题并获取SQL Server实例详细信息。
介绍 (Introduction)
SQL Notebook is an exciting and useful feature introduced in Azure Data Studio. In the article, SQL Notebooks introduction and overview, we took an overview of the notebook feature along with the introduction to markdown language.
SQL Notebook是Azure Data Studio中引入的一项令人兴奋且有用的功能。 在“ SQL笔记本介绍和概述”一文中 ,我们对笔记本功能进行了概述,同时介绍了降价语言。
前提和重点 (Prerequisites and important points)
Download and install Azure Data Studio using the link on a suitable platform such as Windows, macOS, and Linux. Current release – v1.2.2:
使用链接在合适的平台(例如Windows,macOS和Linux)上下载并安装Azure Data Studio。 当前版本– v1.2.2:
- SQL Notebook is a technique for preparing human-readable scripts embedded document. You can also execute the t-SQL scripts, PowerShell, python codes inside the notebook SQL Notebook是一种用于准备人类可读脚本的嵌入式文档的技术。 您还可以在笔记本中执行t-SQL脚本,PowerShell和python代码
- Understand the basics of SQL Notebook, different methods of launching it using the link mentioned above 了解SQL Notebook的基础知识,以及使用上述链接启动SQL Notebook的不同方法
- This article combines the DBATools PowerShell command for preparing a troubleshooting guide in Azure Data Studio 本文结合了DBATools PowerShell命令,用于在Azure Data Studio中准备故障排除指南
- link. You can also follow the SQLShack article 链接下载并安装DBATools。 您还可以按照SQLShack文章DBATools PowerShell Module for SQL Server for more information regarding DBATools SQL Server的DBATools PowerShell模块获取有关DBATools的更多信息。
If you have already installed it, upgrade it to the latest version using the following command in an administrative console of Azure Data Studio:
如果已安装它,请在Azure Data Studio的管理控制台中使用以下命令将其升级到最新版本:
Install-Module dbatools -force- Queries by Glenn Berry in the SQL Notebook. We will cover the useful queries in this article. 查询 。 我们将在本文中介绍有用的查询。
New-DbaDiagnosticAdsNotebook DBATools命令 (New-DbaDiagnosticAdsNotebook DBATools command)
DBATools version 1.0 introduces a new command New-DbaDiagnosticAdsNotebook for preparing the notebook with the diagnostic queries.
DBATools版本1.0引入了新命令New-DbaDiagnosticAdsNotebook,用于使用诊断查询准备笔记本。
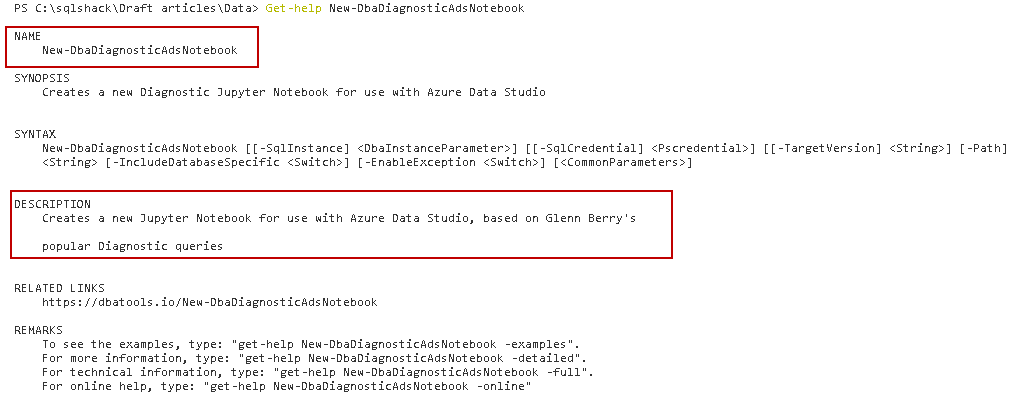
It is always good to check the syntax, description, and examples of the DBATools command using the Get-help command:
使用Get-help命令检查DBATools命令的语法,描述和示例总是好的:
Get-help New-DbaDiagnosticAdsNotebook
句法 (Syntax)
New-DbaDiagnosticAdsNotebook - SqlInstance -SqlCredential -TargetVersion -IncludeDatabaseSpecific - EnableException
- SqlInstance: In this argument, specify the SQL instance name (default or named) SqlInstance :在此参数中,指定SQL实例名称(默认或命名)
- TargetVersion: By default, it installs the diagnostic queries for the SQL instance specified in the above argument. We can also specify a target SQL instance version. This version should be SQL Server 2005 and greater TargetVersion :默认情况下,它将为上述参数中指定SQL实例安装诊断查询。 我们还可以指定目标SQL实例版本。 此版本应为SQL Server 2005及更高版本
- SqlCredential: By default, it uses Windows authentication for connecting to SQL Server instance. We can specify alternate credentials using this argument SqlCredential :默认情况下,它使用Windows身份验证连接到SQL Server实例。 我们可以使用此参数指定备用凭据
- IncludeDatabaseSpecific: We can enable this argument for including database-specific queries in the notebook IncludeDatabaseSpecific :我们可以启用此参数以在笔记本中包括特定于数据库的查询
- EnableException: If there is an error, the command uses a mechanism using the try-catch block and displays a friendly message. We can disable this behavior, but we should avoid any specifying this switch in the command EnableException :如果发生错误,该命令使用使用try-catch块的机制并显示友好消息。 我们可以禁用此行为,但是我们应该避免在命令中指定任何此开关
In the Azure Data Studio, execute the following query in an integrated PowerShell terminal for the SQL Server 2017 version. It automatically fetches all the diagnostic queries and imports them in the notebook with the corresponding heading on each section. We do not need to specify or import queries manually in this notebook:
在Azure Data Studio中,在集成的PowerShell终端中为SQL Server 2017版本执行以下查询。 它会自动获取所有诊断查询,并将它们导入笔记本中,并在每个部分带有相应的标题。 我们不需要在此笔记本中手动指定或导入查询:
New-DbaDiagnosticAdsNotebook -SqlInstance .\SQL2017 -Path C:\sqlshack\SQLNoteBook\DiagnosticSQLNotebook.ipynb
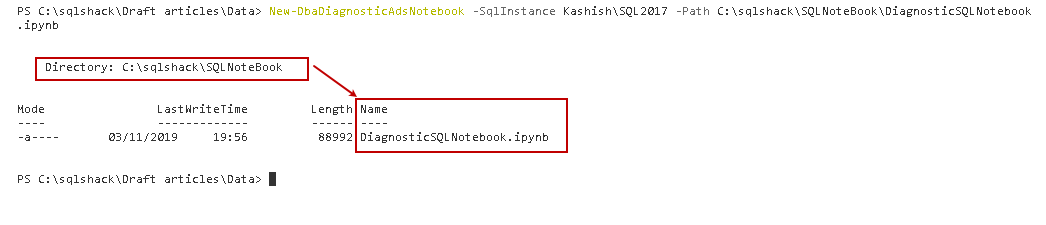
In the above screenshot, we can see it creates the SQL NoteBook in the specified directory. The extension of the notebook is ipynb.
在上面的屏幕截图中,我们可以看到它在指定目录中创建了SQL NoteBook。 笔记本的扩展名是ipynb。
You can browse the destination directory and verify the notebook file:
您可以浏览目标目录并验证笔记本文件:
Double-click on this file to open it in the Azure Data Studio. If the tool is already opened, you get the following warning message. You can close the data studio to skip this warning message:
双击此文件以在Azure Data Studio中将其打开。 如果该工具已经打开,您将收到以下警告消息。 您可以关闭数据工作室以跳过此警告消息:
We can also open it from the File | Open file menu option:
我们也可以从File | File中打开它。 打开文件菜单选项:
Specify the file path, and it opens the newly created notebook, as shown in the following image:
指定文件路径,它会打开新创建的笔记本,如下图所示:
探索SQL Notebook诊断查询 (Explore SQL Notebook diagnostic queries)
Firstly, let’s attach this notebook to a SQL Instance connection so that we do not need to specify a connection for executing each query:
首先,让我们将此笔记本连接到SQL实例连接,这样我们就无需指定用于执行每个查询的连接:
In the Attach To section, click on New Connection. Specify the SQL instance, authentication mode (Windows, SQL):
在“ 附加到”部分中,单击“ 新建连接” 。 指定SQL实例的身份验证模式(Windows,SQL):
Click on Connect, and it shows the SQL connection as shown below:
单击Connect ,它显示SQL连接,如下所示:
Let’s explore queries specified in the diagnostic SQL Notebook.
让我们探索诊断SQL Notebook中指定的查询。
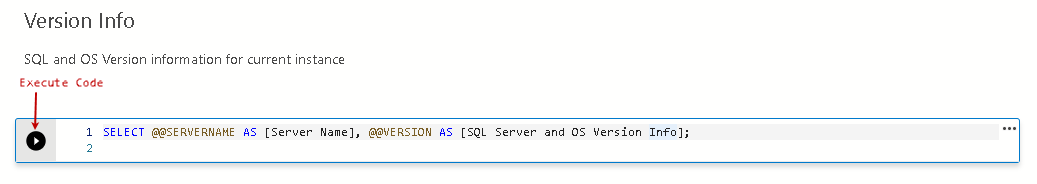
版本信息 (Version Info)
It returns the SQL instance and OS versions in this section. Click on the code, and you get a play icon for executing this query in the connection we specified earlier:
它返回此部分中SQL实例和OS版本。 单击代码,您将获得一个播放图标,用于在我们之前指定的连接中执行此查询:
SQL Notebook displays the result in the notebook itself. We do not require copying the code in another client tool and execute it. We can view, copy and clear the results if required:
SQL Notebook在笔记本本身中显示结果。 我们不需要将代码复制到另一个客户端工具中并执行它。 如果需要,我们可以查看,复制和清除结果:
Click on eclipse, and it gives you the option to clear output, as shown below:
单击eclipse,它为您提供了清除输出的选项,如下所示:
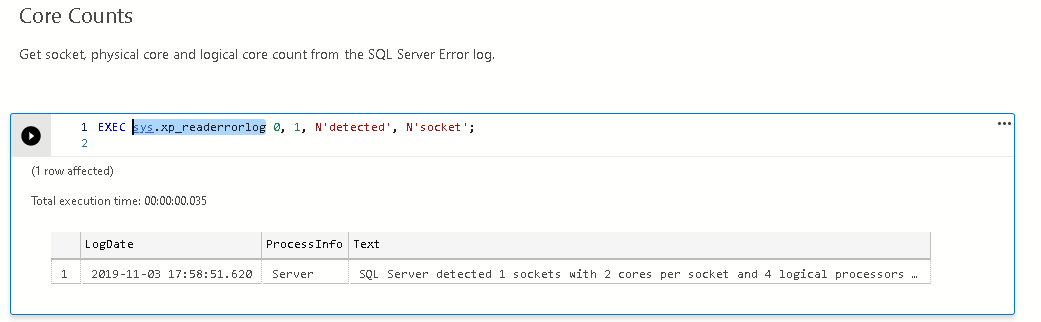
核心数量 (Core Counts)
It reads the SQL Server error logs using the sys.xp_readerrorlog and filter results for getting socket, physical and logical core counts:
它使用sys.xp_readerrorlog读取SQL Server错误日志,并过滤结果以获取套接字,物理和逻辑核心计数:
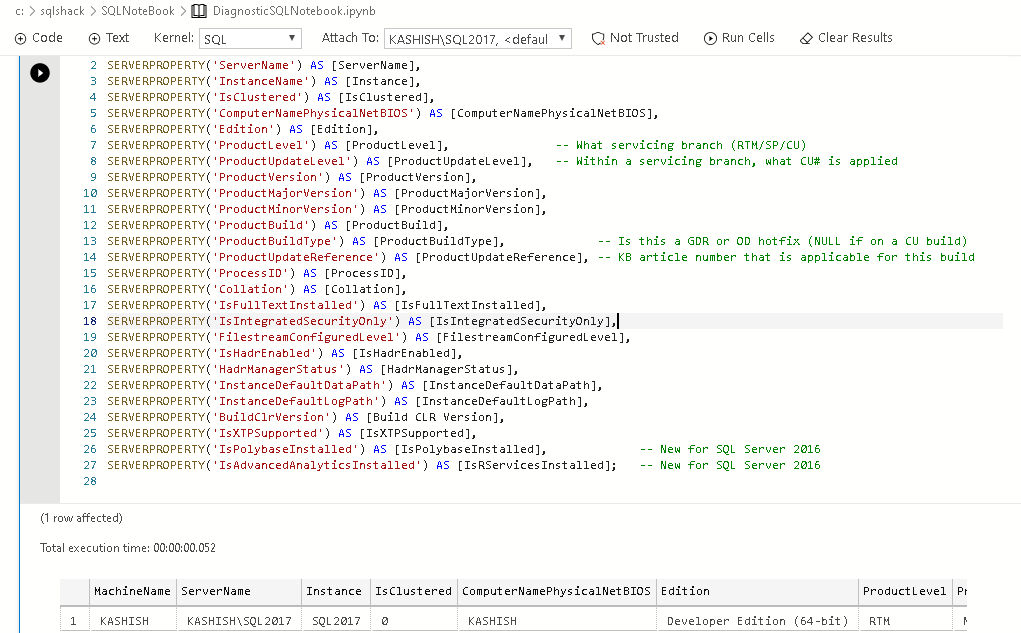
服务器属性 (Server Properties)
This section queries the SQL instance using the system defined function SERVERPROPERTY() and gives us useful information such as build, collation, edition, version, physical hostname, cluster property, instance default data, log path, etc. You can refer to Microsoft docs for more information about this function:
本节使用系统定义的函数SERVERPROPERTY()查询SQL实例,并向我们提供有用的信息,例如生成,整理,版本,版本,物理主机名,群集属性,实例默认数据,日志路径等。您可以参考Microsoft文档有关此功能的更多信息:
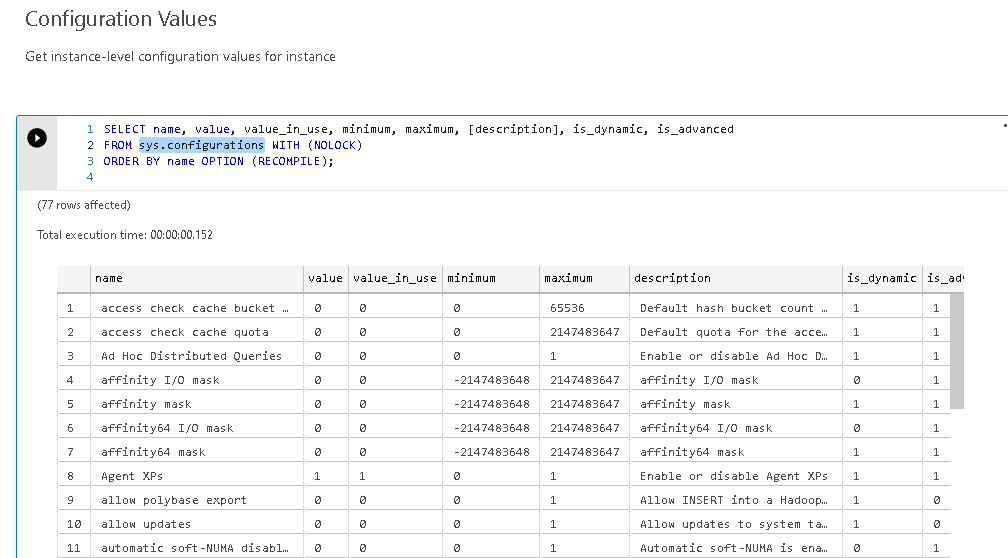
配置值 (Configuration Values)
It gives you various configuration options along with their minimum, maximum, in use-value for server-wide options. You can refer to the following link for reference:
它为您提供了各种配置选项,以及它们在服务器范围内选项的最小,最大和使用值。 您可以参考以下链接以供参考:
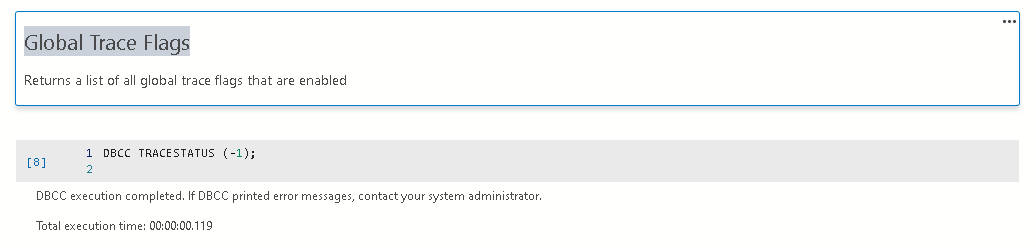
全局跟踪标志 (Global Trace Flags)
If you have enabled any trace flags globally, you can use the query in this section to get the details. In my instance, I do not have any such trace flag. Therefore, you do not get any output trace flag:
如果已全局启用任何跟踪标志,则可以使用本节中的查询来获取详细信息。 就我而言,我没有任何此类跟踪标志。 因此,您不会获得任何输出跟踪标志:
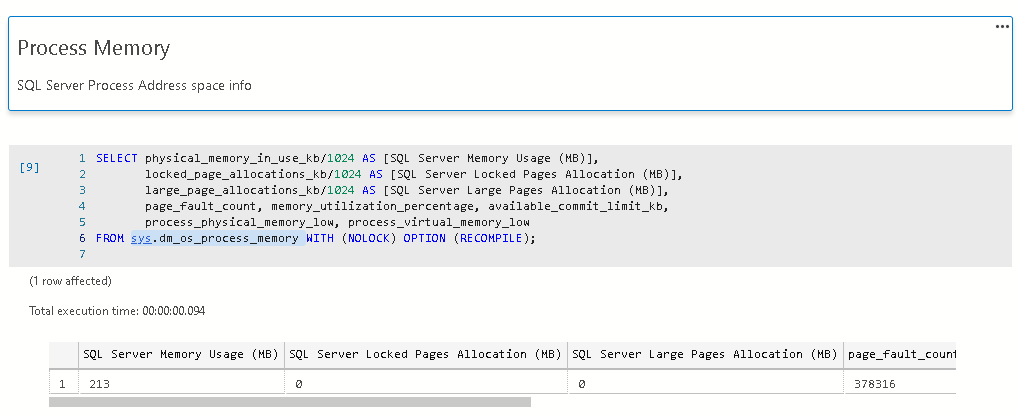
进程记忆 (Process Memory)
You can query dynamic management view sys.dm_os_process_memory for getting details of SQL Server memory allocations. You can refer Microsoft docs to learn about this DMV:
您可以查询动态管理视图sys.dm_os_process_memory以获取SQL Server内存分配的详细信息。 您可以参考Microsoft文档以了解有关此DMV的信息:
SQL Server服务信息 (SQL Server Services Info)
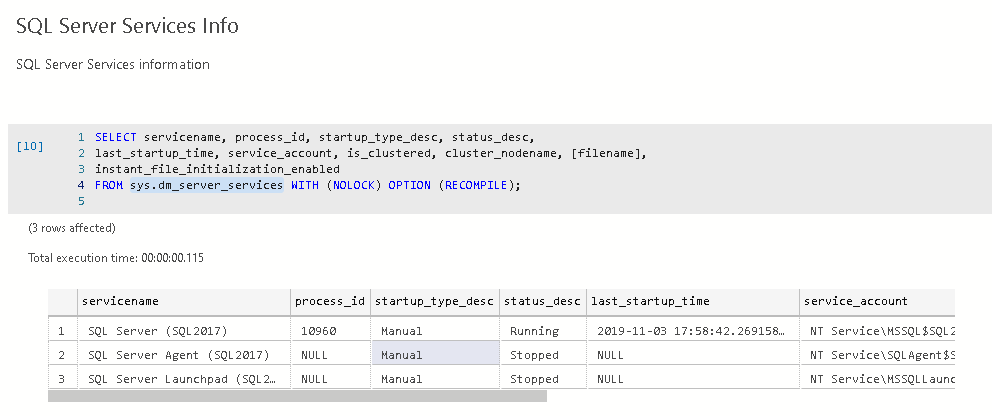
We can use sys.dm_server_services Dynamic management view for getting status of SQL Server, SQL Agent, and full-text services. It also shows service startup type, last start timestamp, service account, instant file initialization, and clustered status:
我们可以使用sys.dm_server_services动态管理视图来获取SQL Server,SQL Agent和全文服务的状态。 它还显示服务启动类型,上次启动时间戳,服务帐户,即时文件初始化和群集状态:
上次数据库备份 (Last Backup by Database)
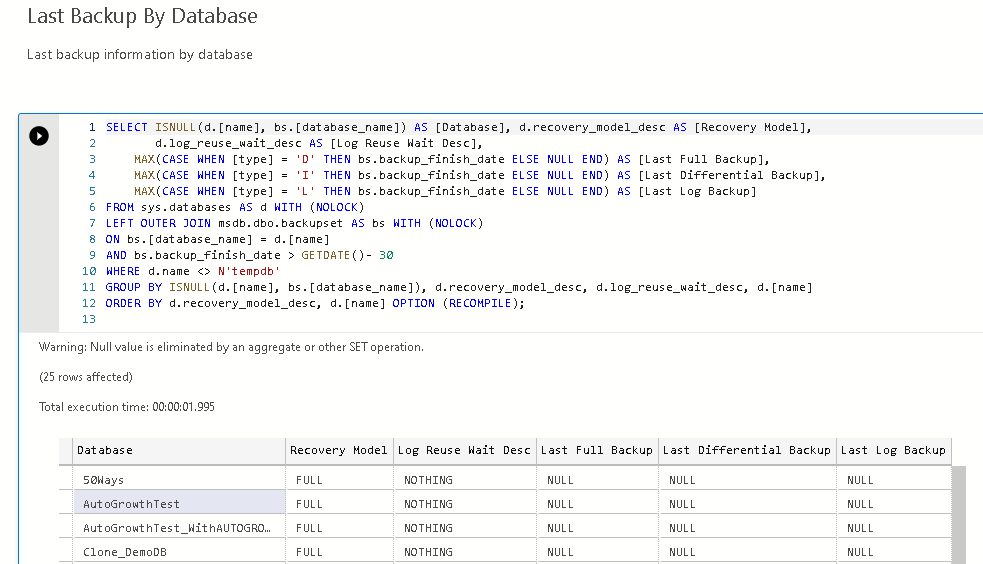
Backup information is a vital monitoring aspect for any DBA. We can use this section for fetching the following information about the last database backups. SQL Notebook query fetches the information from the system Database MSDB:
备份信息对于任何DBA都是至关重要的监视方面。 我们可以使用本节来获取有关最后一次数据库备份的以下信息。 SQL Notebook查询从系统数据库MSDB中获取信息:
- Database recovery model 数据库恢复模型
- Log use wait status 日志使用等待状态
- Last full, differential and log backup timestamp 最后的完整,差异和日志备份时间戳
SQL Server代理作业 (SQL Server Agent Jobs)
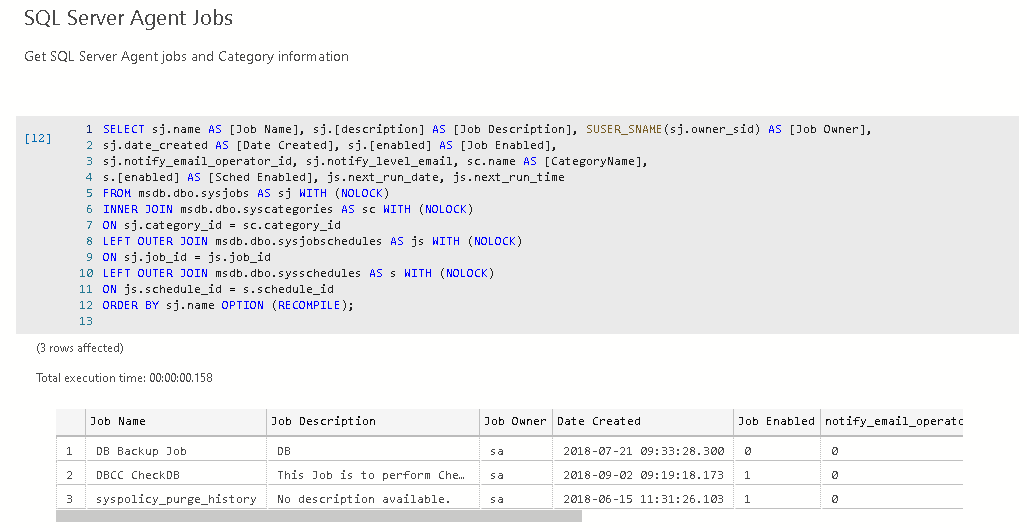
This section queries the MSDB jobs for fetching SQL agent jobs information such as created date, owner, job status (enabled\disabled), and next run schedule:
本节查询MSDB作业以获取SQL代理作业信息,例如创建日期,所有者,作业状态(启用/禁用)和下次运行时间表:
SQL Server代理警报 (SQL Server Agent Alerts)
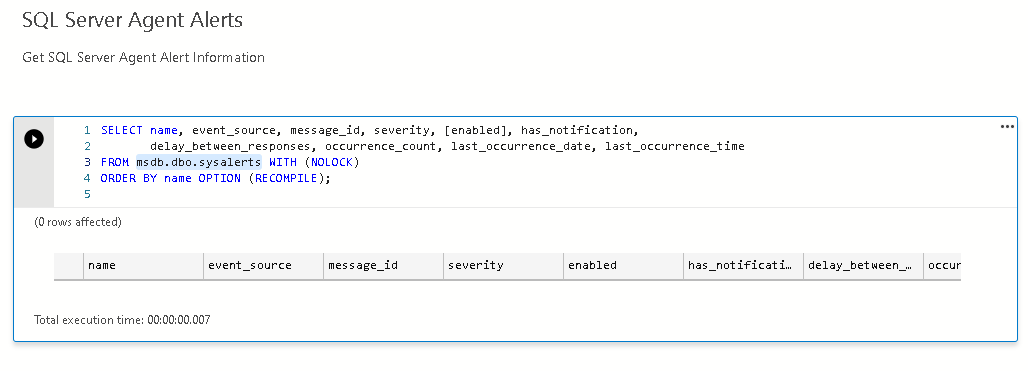
If we have specified SQL Server agent alerts, we get the details in this section query. It queries the msdb.dbo.sysalerts system table for fetching the required details. I do not have any agent alerts for my SQL instance; therefore, the result is blank:
如果我们指定了SQL Server代理警报,则会在此部分查询中获取详细信息。 它查询msdb.dbo.sysalerts系统表以获取所需的详细信息。 我SQL实例没有任何代理警报。 因此,结果为空白:
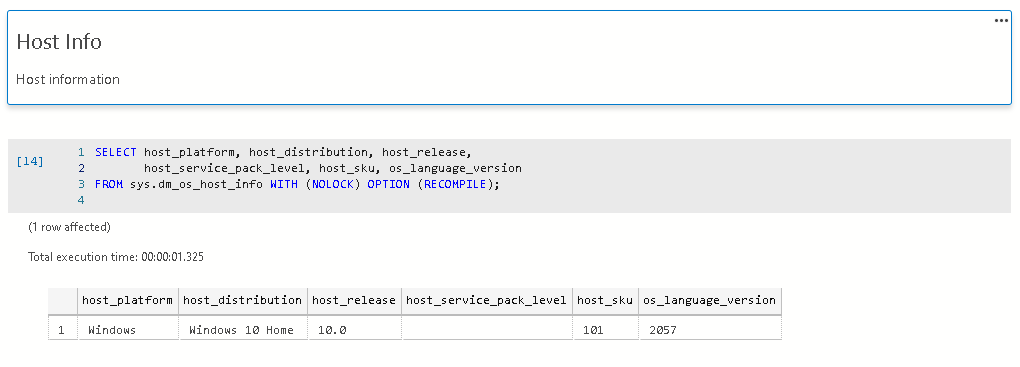
主机信息 (Host Info)
It uses the sys.dm_os_host_info DMV for fetching underlying operating system information for the SQL instance:
它使用sys.dm_os_host_info DMV来获取SQL实例的基础操作系统信息:
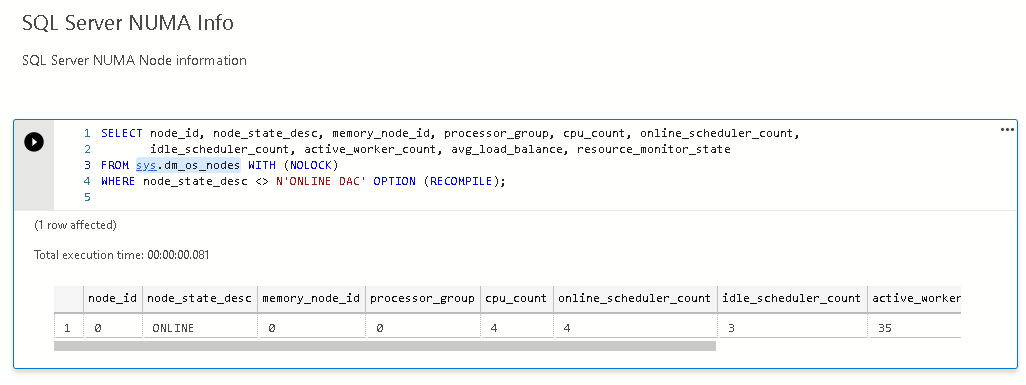
SQL Server NUMA信息 (SQL Server NUMA Info)
It is useful to know the SQL Server Numa information. We can get the information using the DMV sys.dm_os_nodes:
了解SQL Server Numa信息很有用。 我们可以使用DMV sys.dm_os_nodes获得信息:
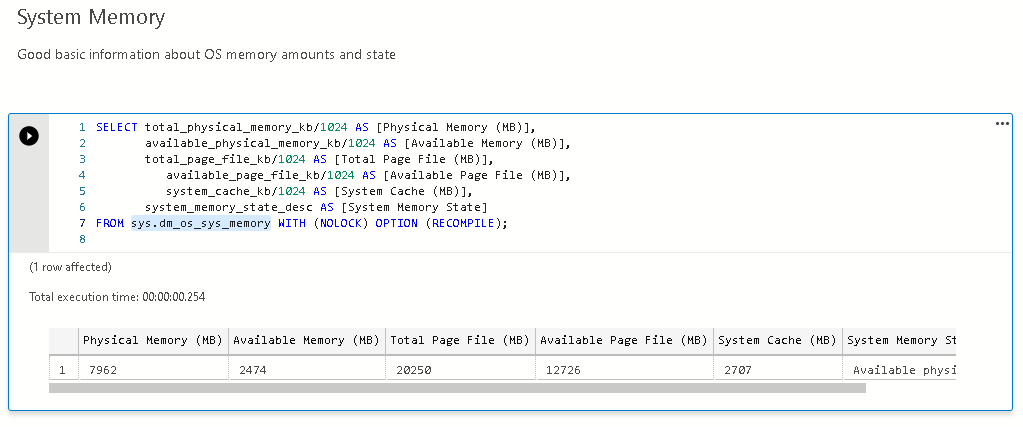
系统记忆体 (System Memory)
It is important to know the system memory information such as total physical memory, available physical memory, page file information, and system memory state. It runs DMV sys.dm_os_sys_memory for this data:
重要的是要了解系统内存信息,例如总物理内存,可用物理内存,页面文件信息和系统内存状态。 它为此数据运行DMV sys.dm_os_sys_memory :
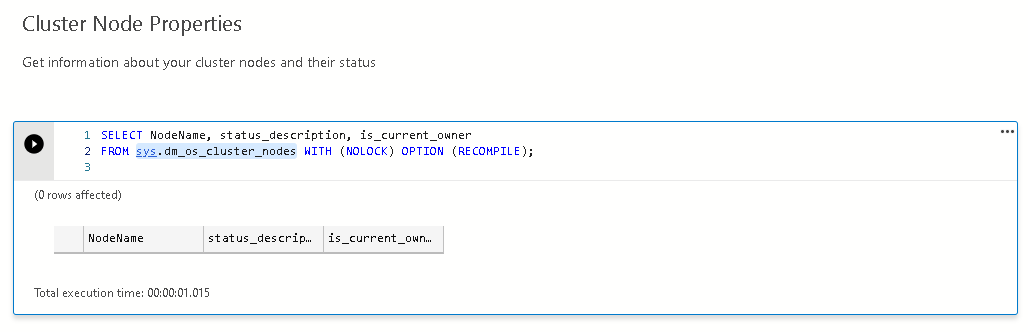
群集节点属性 (Cluster Node Properties)
If SQL instance is part of the Windows failover cluster, we get run DMV sys.dm_os_cluster_nodes to get cluster owner and status description. I am connected to a standalone instance; therefore, you do not get any output row:
如果SQL实例是Windows故障转移群集的一部分,我们将运行DMV sys.dm_os_cluster_nodes以获取群集所有者和状态描述。 我已连接到独立实例; 因此,您不会得到任何输出行:
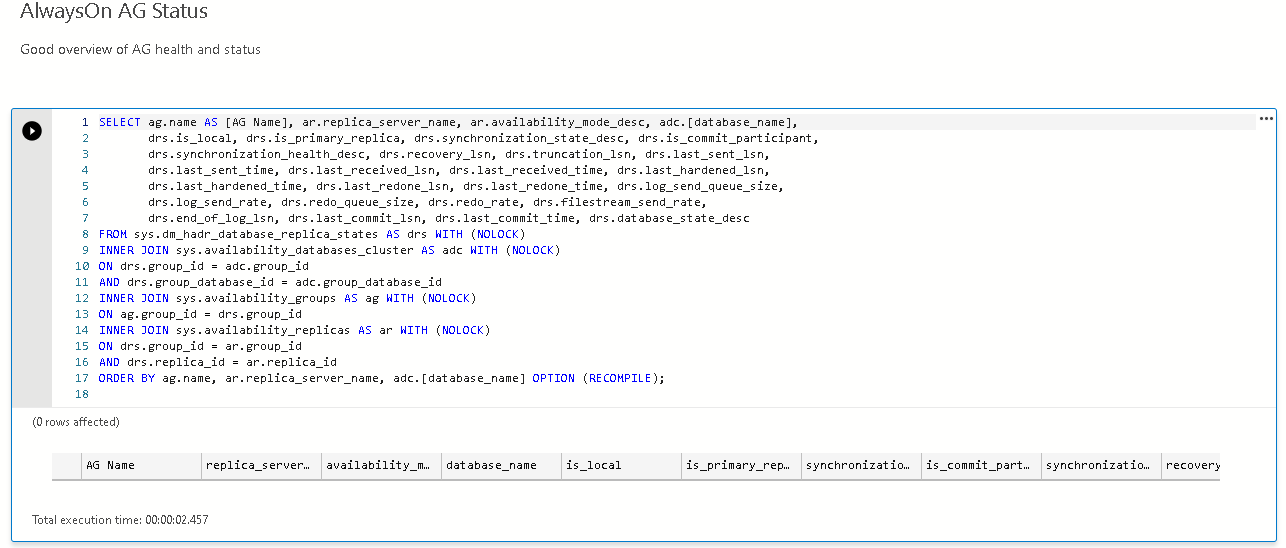
AlwaysOn AG状态 (AlwaysOn AG Status)
If you are using AlwaysOn Availability Groups, this section helps you in executing a query to find the AG health and synchronization status with LSN information:
如果使用的是AlwaysOn可用性组,则本节可帮助您执行查询以查找带有LSN信息的AG运行状况和同步状态:
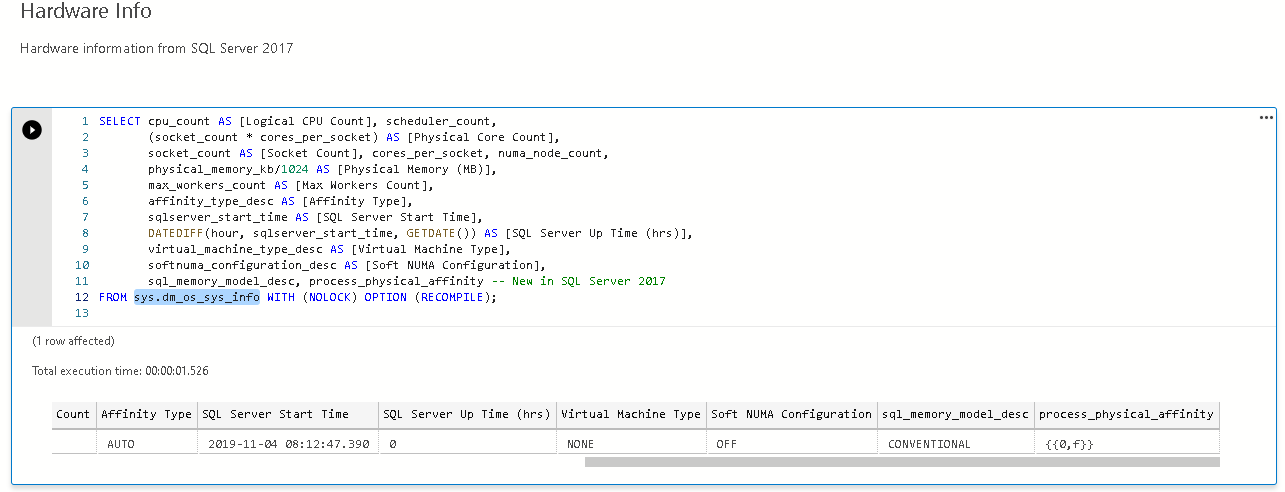
硬体资讯 (Hardware Info)
It is good to know the hardware configuration of SQL Server 2017 underlying hardware. You can query sys.dm_os_sys_info to fetch these details:
很高兴知道SQL Server 2017基础硬件的硬件配置。 您可以查询sys.dm_os_sys_info来获取以下详细信息:
There are many sections in this diagnostic book to retrieve useful information about SQL Server. You can execute these queries and etch the information in the SQL Notebook.
该诊断书中有很多部分可以检索有关SQL Server的有用信息。 您可以执行这些查询并在SQL Notebook中获取信息。
Let’s explore few useful diagnostic queries.
让我们探索一些有用的诊断查询。
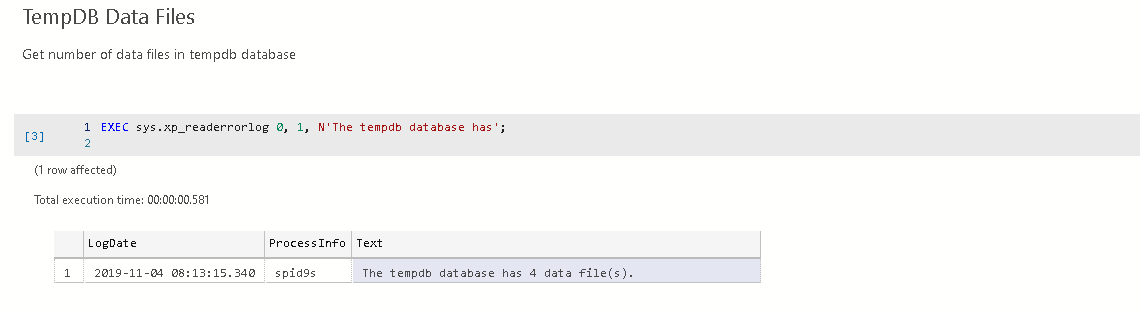
TempDB数据文件 (TempDB Data Files)
It is essential to know a number of data files for the system database TempDB. This section fetches the information from the error log:
必须了解系统数据库TempDB的许多数据文件。 本节从错误日志中获取信息:
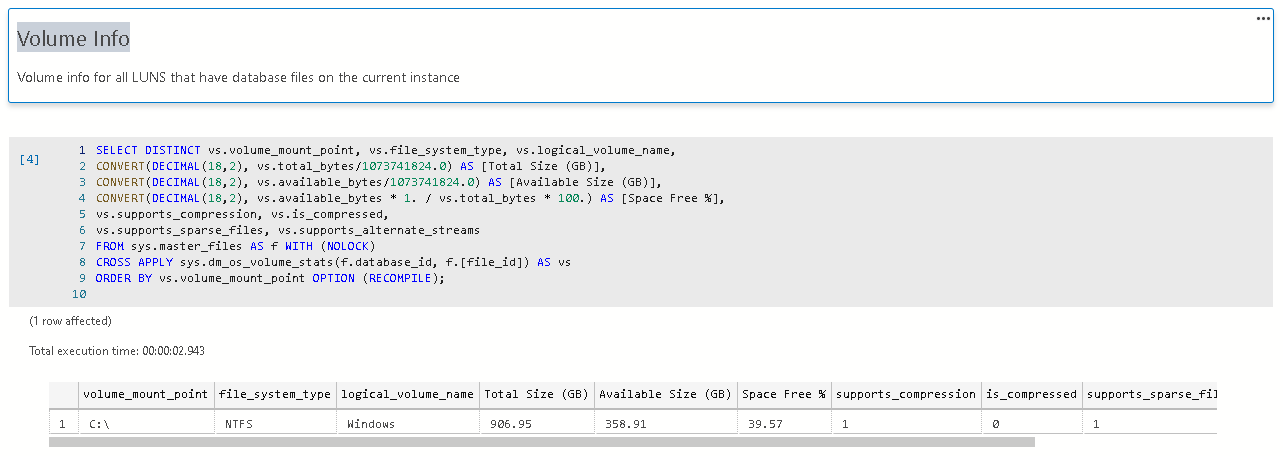
卷信息(监视磁盘空间) (Volume Info (Monitor Disk Space))
You can monitor the disk space for the disk that holds the database files. We should take proactive actions if the free disk space is getting low. You get total disk space, available size, space free (%) as shown below:
您可以监视用于保存数据库文件的磁盘的磁盘空间。 如果可用磁盘空间不足,我们应采取积极措施。 您将获得总磁盘空间,可用大小,可用空间(%),如下所示:
驱动器级延迟 (Drive Level Latency)
You should monitor the disk latency for the underlying storage system. A slow disk drive can cause performance issues for the workload:
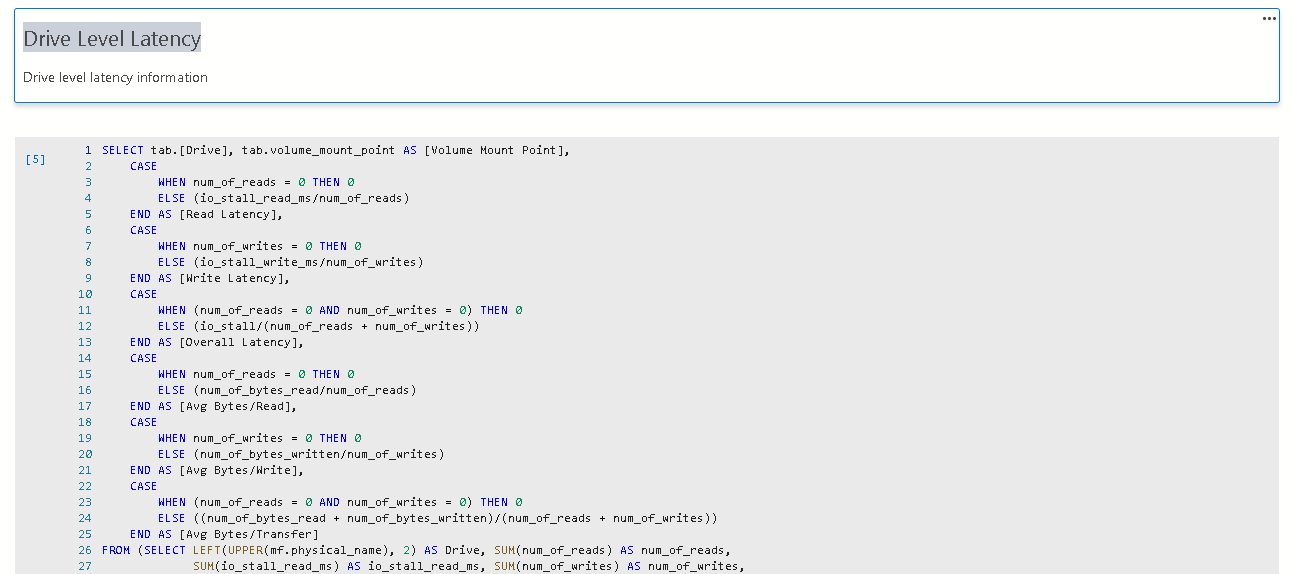
您应该监视基础存储系统的磁盘延迟。 慢速磁盘驱动器可能导致工作负载的性能问题:
In the output, you can note read, write, overall latency for the disk. You also get Avg Bytes/Read, Avg Bytes/write, and Avg Bytes/Transfer useful performance monitor counters as well:
在输出中,您可以记下磁盘的读取,写入和整体延迟。 您还将获得“平均字节数/读取”,“平均字节数/写入”和“平均字节数/传输”有用的性能监视器计数器:
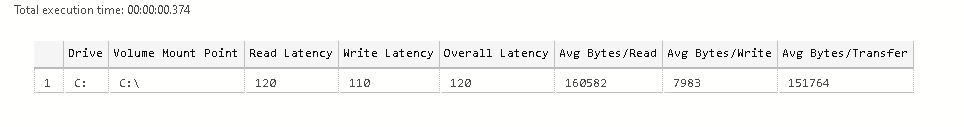
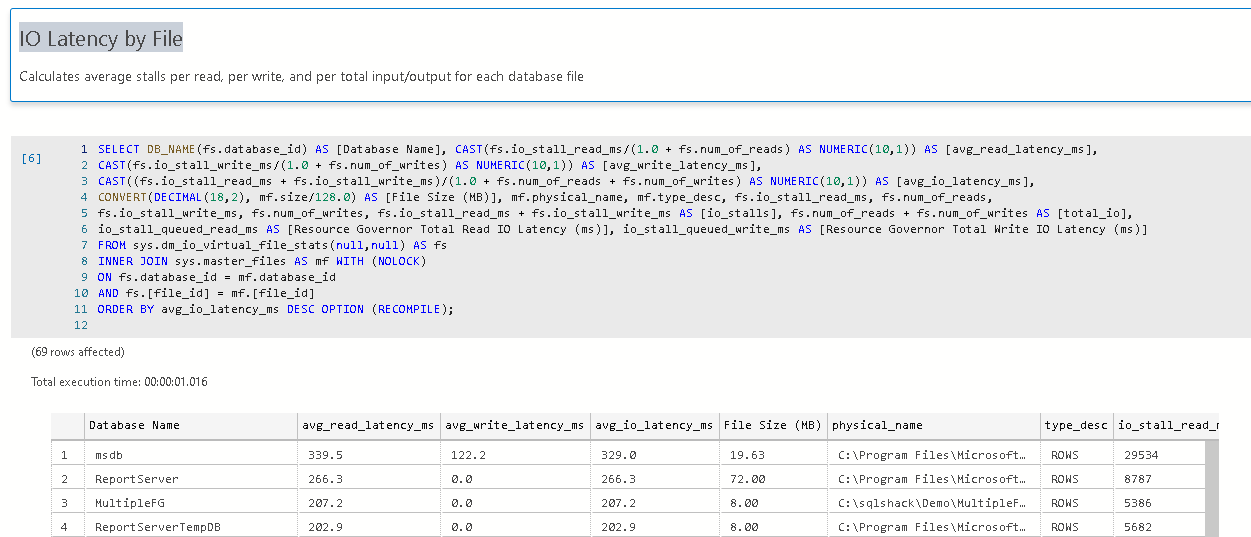
IO延迟(按文件) (IO Latency by File)
We might have multiple databases in a single SQL instance. We are interested in knowing which data files causing IO latency. It is an instrumental section in monitoring the latency for the data files:
我们可能在一个SQL实例中有多个数据库。 我们有兴趣了解哪些数据文件会导致IO延迟。 这是监视数据文件延迟的重要部分:
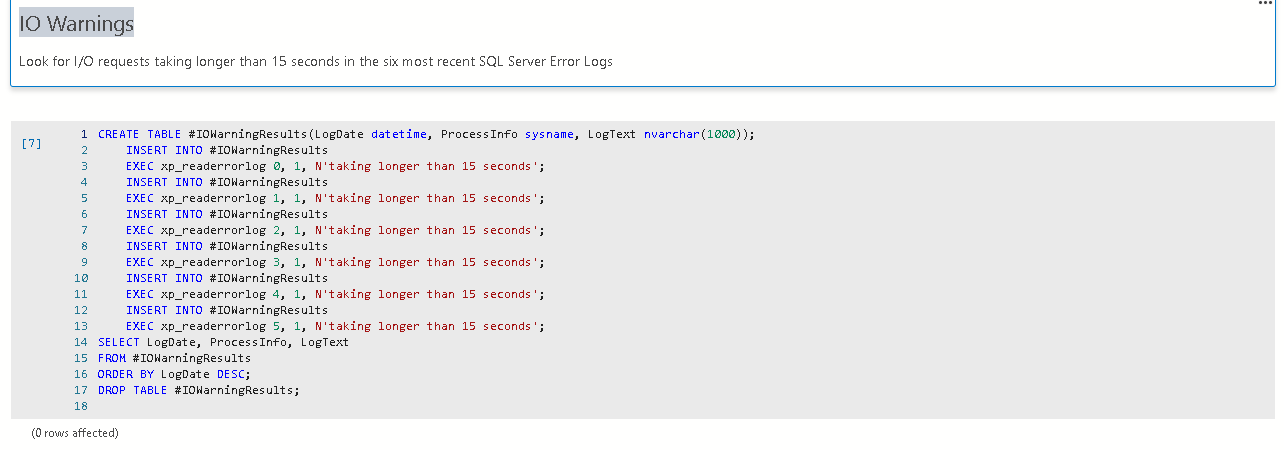
IO警告 (IO Warnings)
SQL Server logs an entry in the error log if the IO request takes longer than 15 seconds to complete. This section fetches all such occurrence from the error log:
如果IO请求花费的时间超过15秒,则SQL Server在错误日志中记录一个条目。 本节从错误日志中获取所有此类情况:
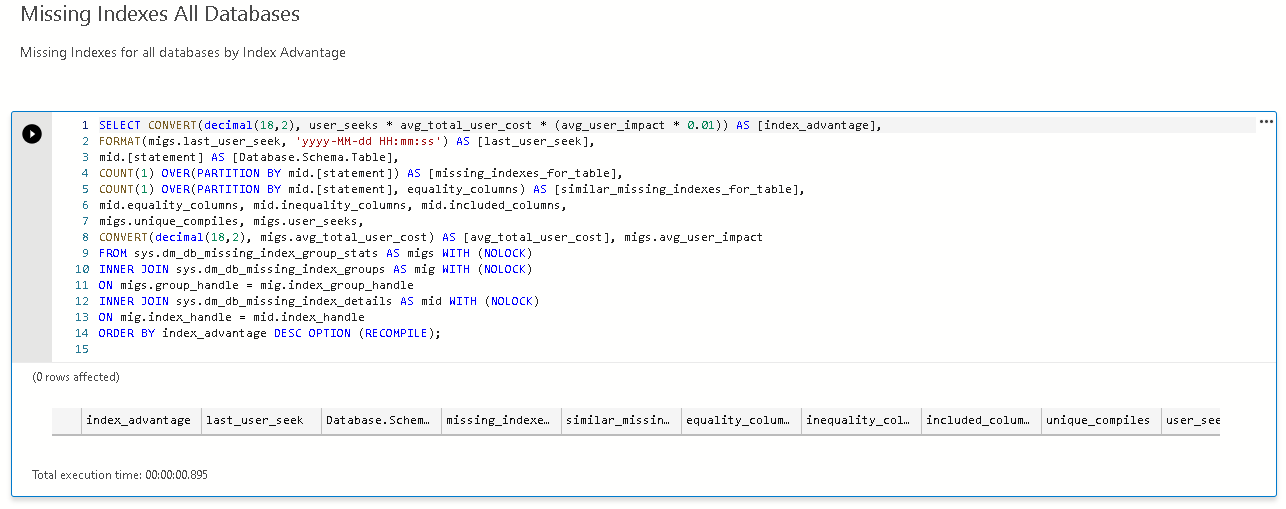
缺少索引所有数据库 (Missing Indexes All Databases)
We should evaluate the missing index recommendation by the SQL Server. We should implement them if we find them suitable:
我们应该评估SQL Server缺少的索引建议。 如果发现合适的话,我们应该实现它们:
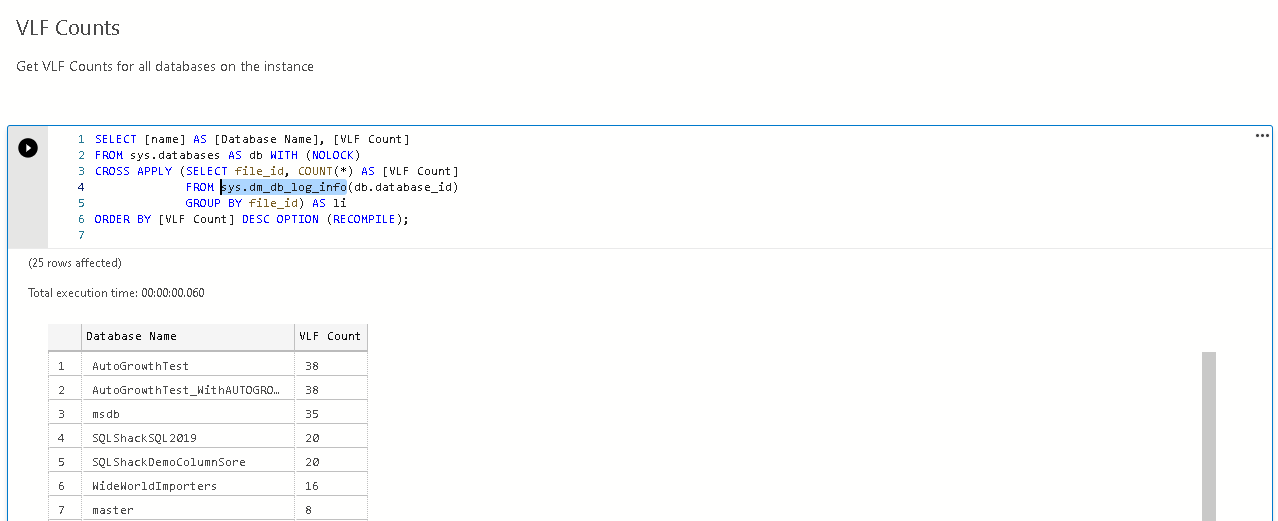
VLF计数 (VLF Counts)
We should also monitor the virtual log files (VLF) count and take appropriate actions if the VLF count is large. This section queries the sys.dm_db_log_info DMV and retrieves the information for each database in the instance:
如果VLF计数很大,我们还应该监视虚拟日志文件(VLF)计数并采取适当的措施。 本节查询sys.dm_db_log_info DMV并检索实例中每个数据库的信息:
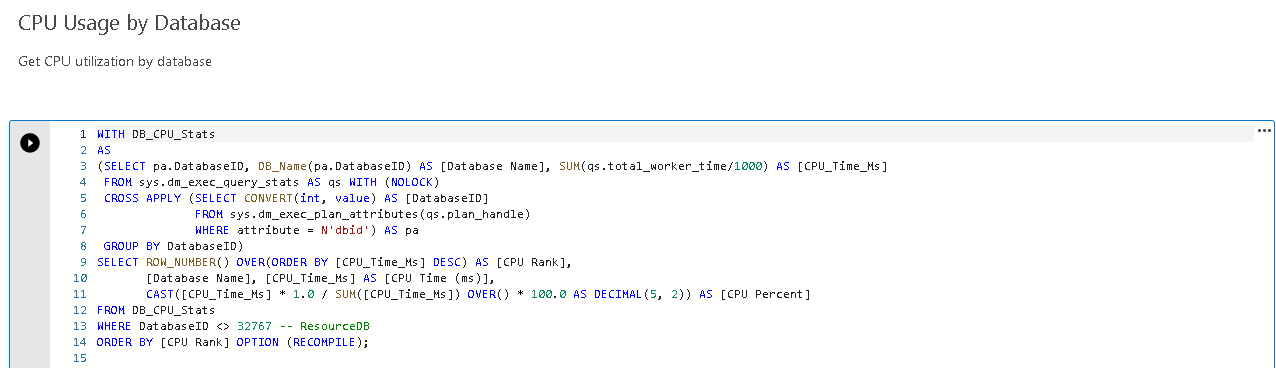
数据库使用率 (CPU Usage by Database)
We can use this section to get a CPU usage breakdown for each database. We can identify the pattern of CPU usage and focus on the queries for the specific database for reducing the CPU usage:
我们可以使用此部分来获取每个数据库的CPU使用率明细。 我们可以确定CPU使用率的模式,并专注于特定数据库的查询以减少CPU使用率:
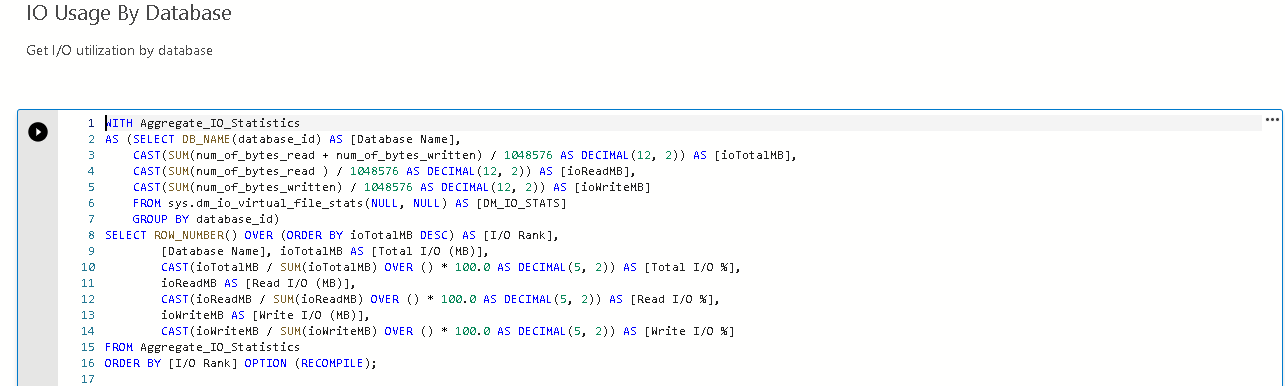
IO使用情况(按数据库) (IO Usage by Database)
We can use this section for knowing IO usage information for the individual database. It provides handy information for each database to troubleshoot performance issues:
我们可以使用此部分来了解各个数据库的IO使用情况信息。 它为每个数据库提供了方便的信息来解决性能问题:
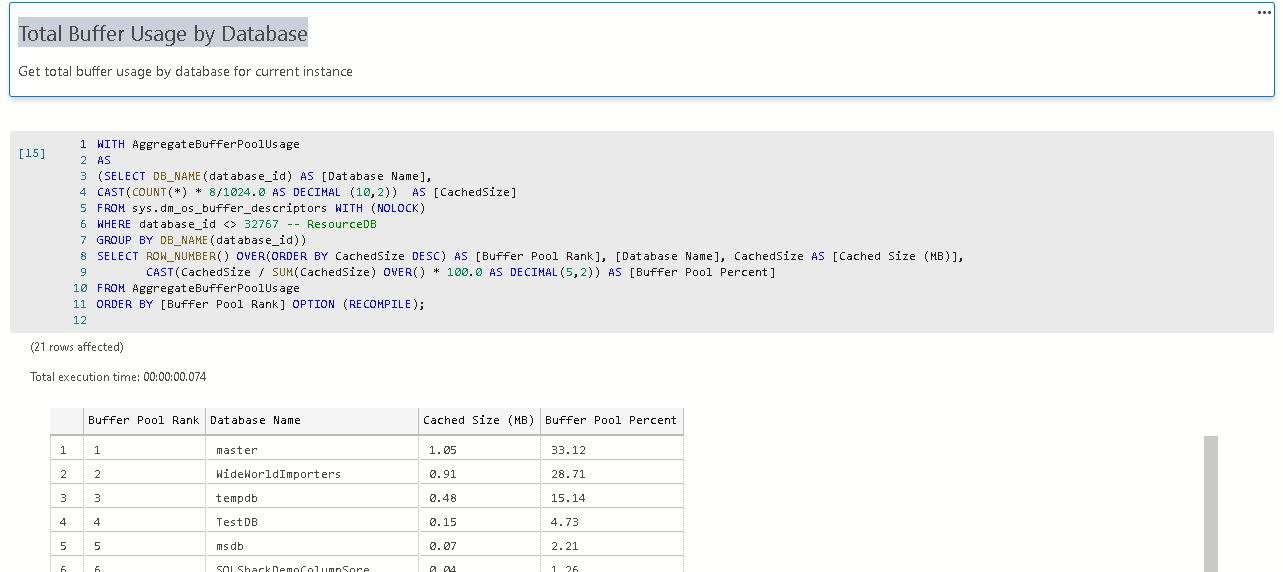
数据库的总缓冲区使用量 (Total Buffer Usage by Database)
We can execute the query specified here to know the contribution of each database in the buffer utilization. We might see an issue where a database is using most of the buffer space and the other databases see a performance issue due to this. Get the data and investigate:
我们可以执行此处指定的查询,以了解每个数据库对缓冲区利用率的贡献。 我们可能会看到一个问题,即数据库正在使用大多数缓冲区空间,而其他数据库因此会遇到性能问题。 获取数据并进行调查:
热门等待 (Top Waits)
Waits provide internal information of query execution in SQL Server. We can find the bottleneck on which query is waiting for its execution. This section fetches the information from the DMV’s and displays the top consuming wait resources:
等待提供SQL Server中查询执行的内部信息。 我们可以找到查询正在等待执行的瓶颈。 本节从DMV获取信息,并显示消耗最大的等待资源:
CPU使用率历史 (CPU Utilization History)
We can get the CPU utilization of the SQL Server and OS processes using the ring buffer. Suppose you get high CPU utilization alerts and we can get a history of CPU utilization that whether SQL or OS process is causing this issue:
我们可以使用环形缓冲区来获取SQL Server和OS进程的CPU利用率。 假设您收到较高的CPU使用率警报,并且我们可以获得有关SQL或OS进程导致此问题的CPU使用率的历史记录:
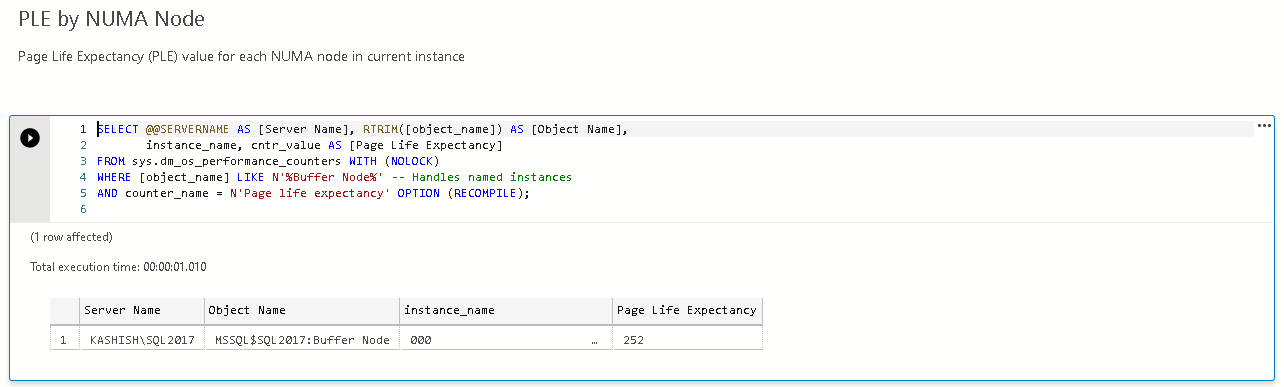
PLE by NUMA节点 (PLE by NUMA Node)
Page life expectancy is a useful monitoring parameter in troubleshooting performance issues. You should monitor the PLE value and investigate if the PLE value is continuously low:
页面预期寿命是对性能问题进行故障诊断的有用监控参数。 您应该监视PLE值,并调查PLE值是否一直很低:
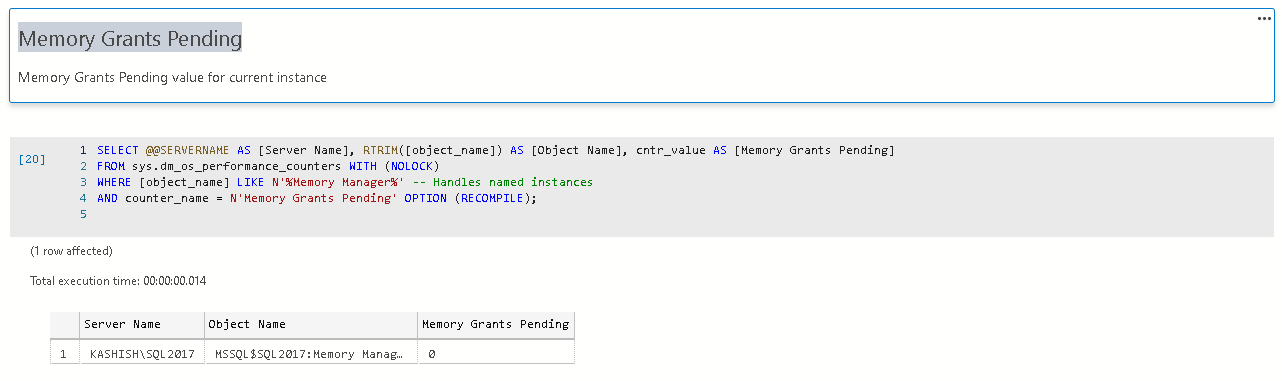
内存补助金待定 (Memory Grants Pending)
We should not have memory grants pending in SQL Server. If you have pending memory grants, queries will wait until memory is not allocated:
我们不应在SQL Server中有未决的内存授予。 如果您有未决的内存授予,查询将等待直到未分配内存:
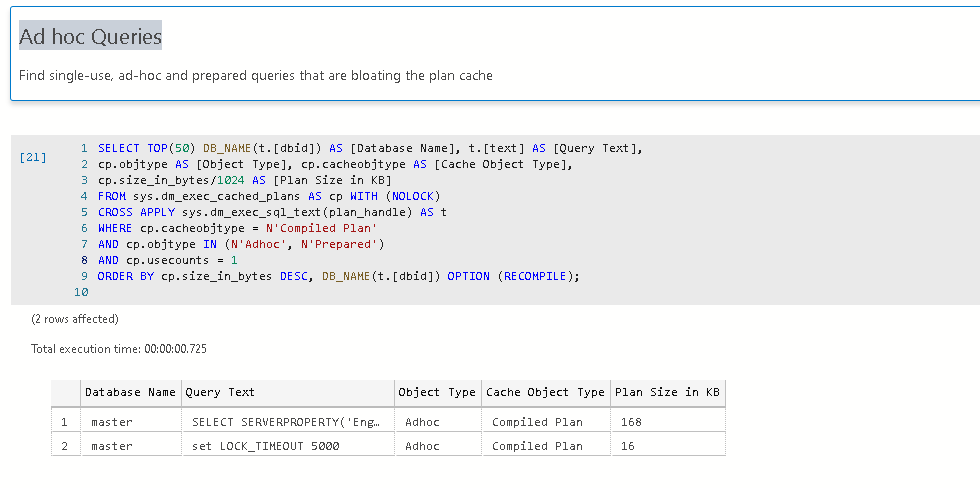
临时查询 (Ad hoc Queries)
We should minimize ad-hoc queries in SQL Server. An ad-hoc query causes SQL Server to prepare an execution plan for each query. It might bloat plan cache and cause performance issues if we have a large number of ad-hoc queries:
我们应该最小化SQL Server中的即席查询。 临时查询使SQL Server为每个查询准备执行计划。 如果我们有大量的临时查询,它可能会使计划缓存膨胀,并导致性能问题:
Execute query in this section to get ad-hoc queries
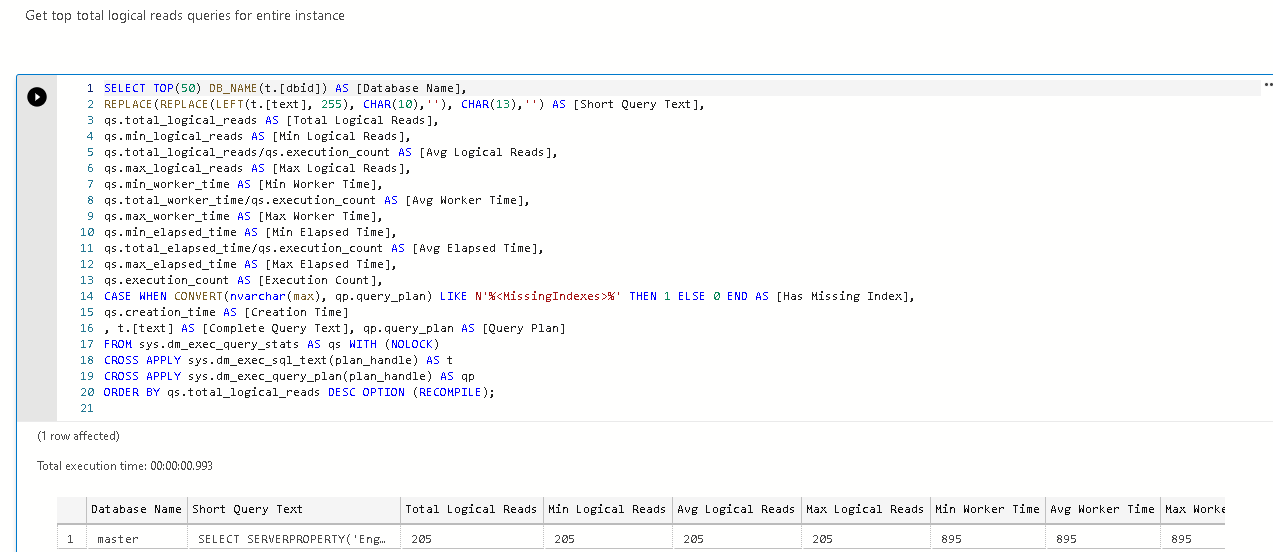
热门逻辑阅读查询 (Top Logical Reads Queries)
We should identify and tune the queries with high logical reads. This section uses DMV’s to fetch top logical reads and suggest any missing index as well:
我们应该识别和调整具有高逻辑读取的查询。 本部分使用DMV来获取顶级逻辑读取并建议任何缺失的索引:
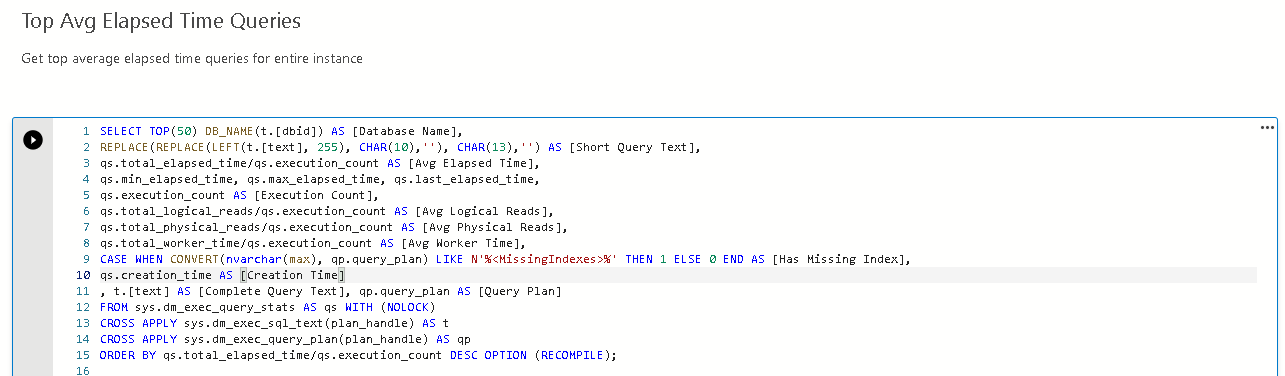
热门平均经过时间查询 (Top Avg Elapsed Time Queries)
We get the list of queries taking a long execution time. You can further investigate, fine-tune those queries to reduce the performance bottleneck:
我们得到执行时间很长的查询列表。 您可以进一步调查,微调这些查询以减少性能瓶颈:
结论 (Conclusion)
We explored SQL Notebooks in Azure data studio with the diagnostic queries. You can keep this notebook handy and execute the queries for your SQL instance. We do not require copying scripts to SSMS. We can directly execute queries in a notebook and view the data.
我们使用诊断查询在Azure数据工作室中探索了SQL笔记本。 您可以方便地使用此笔记本并执行SQL实例的查询。 我们不需要将脚本复制到SSMS。 我们可以直接在笔记本中执行查询并查看数据。
翻译自: https://www.sqlshack.com/a-handy-sql-notebook-for-troubleshooting-purpose-in-azure-data-studio/
sql azure 语法


 459
459

 被折叠的 条评论
为什么被折叠?
被折叠的 条评论
为什么被折叠?
 到【灌水乐园】发言


